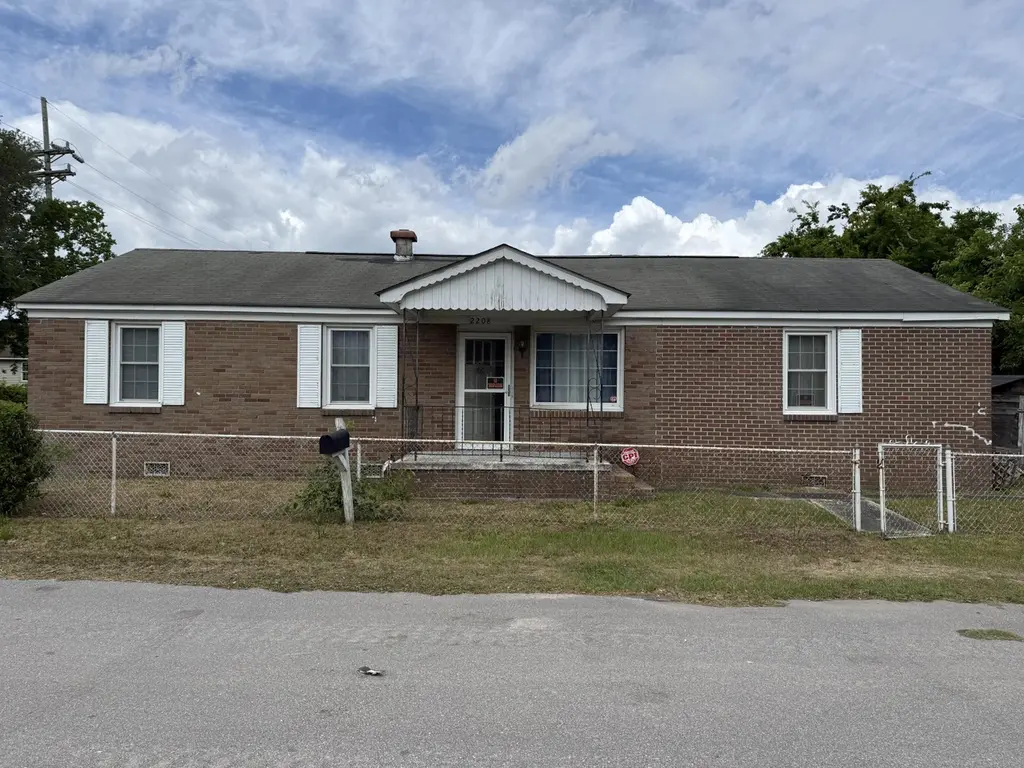
2208 Odessa St · Charleston, SC
Flood risk 5/10 · Moderate
- FEMA flood zone
- X (shaded)
- Chance of flooding over 30 yrs
- 0.24%
- Est. flood insurance / yr
- $507 – $1,088
Fire risk 4/10 · Minor
- Est. fire insurance / yr
- $783 – $1,453
Heat risk 10/10 · Severe
- Hot days now (above 105°F)
- 7 days/yr
- Hot days in 30 yrs
- 18 days/yr
Wind risk 9/10 · Severe
- Chance of severe wind over 30 yrs
- 99.0%
Air-quality risk 3/10 · Minor
- Unhealthy air days now
- 3 days/yr
- Unhealthy air days in 30 yrs
- 3 days/yr
Risk factors via First Street. Map © Google.
Why this score? — see what drove the C+ grade
The composite is a weighted blend of 9 inputs, each scored 0–100. Each bar is that input's sub-score; the figure is the points it added to the 100-point composite (weight × sub-score).
- Cash flow +20.4/30.0
- ARV discount +15.0/15.0
- DSCR +6.5/10.0
- Schools +4.3/10.0
- 1% rule +4.2/10.0
- Rent growth +4.1/5.0
- Livability +3.8/5.0
- Condition / age +2.5/5.0
- Appreciation +0.0/10.0
$265,000
🖨 Deal sheet 📄 Offer letter ✓ Due diligence
Listing remarks
Location, Location, Location! 2208 Odessa St presents a rare opportunity to own a single family home in one of Charleston's most desirable and rapidly growing areas. Ideally situated with convenient access to the King St. Rd extension and just minutes from the vibrant Upper King district, home to favorites like Edmund's Oast, Pelato, and much more, you'll enjoy some of the city's best dining, shopping, and entertainment just moments from your doorstep. Calling all Investors, this property offers strong potential to build immediate equity in an up and coming Charleston neighborhood. Opportunities to secure a single family home at this price point, this close to downtown Charleston, are incre
Key facts
- Single family home
- Convenient access
- 3,920 sq ft lot
Tags
Property features AI
Finance
- HOA & community: Community trash service
Exterior
- Parking: Off-street parking
- Utilities: Public sewer; Electric service by Dominion Energy
- Home design: Single-family detached home; One story
- Construction: No information on year built provided
- Exterior features: Metal enclosed fencing; Shed(s); Located on a cul-de-sac; Lot under 0.5 acre
Interior
- Kitchen: Electric oven; Gas cooktop
- Bedrooms: 4 bedrooms; Primary bedroom on lower level with ceiling fan(s)
- Flooring: Carpet; Laminate
- Bathrooms: 1 bathroom
- Heating & cooling: Central air conditioning; Electric forced-air heating
- Interior features: Family room; Separate dining room
- Laundry & utility: Electric dryer hookup
Neighborhood map
What this means for you Summary
Snapshot
- This is a 4-bed/1.0-bath single-family listed at $265k.
Deal economics
- At list price, monthly cash flow is $346 ($4k/yr) — positive.
- The deal already cash-flows at list — no discount required.
- To meet the 1% rule (rent ≥ 1% of price), the offer needs to be $244k (7.8% below list).
- Recommended offer: $244k (7.8% below list) — sets the bar for 1% rule.
- Cap rate 7.9% vs local median 2.4% in Charleston — top-decile yield for the area; either an underpriced asset or a hidden risk that comps aren't pricing in. Stress-test before assuming the spread holds.
Location & tenants
- Location reads 76/100 on livability (#22 in SC, #3,336 nationally) — a middle-class / working-renter tenant base. Strengths: amenities A+, housing A+, health & safety A+; Watch: crime D+, commute F, cost of living D-.
- Charleston 01 (urban): math 48% / reading 53% proficiency, ranked #7 of 80 in SC (top 9%) — acceptable for families but not a draw, mixed tenant base, ~2y average lease.
- Zoned schools: Sanders-Clyde Elementary (math 12% / reading 12%, grade F, #572 of 597 statewide, top 97%, 390 students, 100% FRL); Simmons Pinckney Middle (math 3% / reading 13%, grade F, #226 of 229 statewide, top 99%, 219 students, 100% FRL); Burke High (math 32% / reading 67%, grade D, #151 of 196 statewide, top 79%, 352 students, 100% FRL) — zoned schools average 100% FRL vs 44% district-wide (56 pts higher); higher-poverty schools than district average — tighter screening recommended.
- Zoned-school proficiency averages 23% at this address vs 50% district-wide (-27 pts) — the specific schools serving this property underperform the Charleston 01 average; the district grade overstates school quality for this exact location.
- Market conditions: Rents rising fast (+6.4%/yr); 203 active listings in the ZIP; 5 comparable units currently listed for rent nearby; rentals at typical pace (median 15d on market — plan ~3-4 weeks tenant-placement turnaround); 4,156 units permitted in Charleston County in 2024 (857 in 5+ unit buildings).
- At $2,444/mo this rent would consume 52% of the median local household income ($57k/yr) (locally 1564% of renters already pay >50% of income on rent) — very limited rent-growth headroom before tenants either downsize or default.
Forward outlook
- Local home prices are declining (-3.0%/yr); year-one equity from $2k of loan paydown is wiped out by about $8k of value loss. Plan a longer hold.
- Charleston County population projected at +44% by 2050 — long-run rental-demand tailwind backs the buy-and-hold thesis.
- At projected returns (-3.0% appreciation + 6.4% rent growth), your $74k cash investment doubles in ~10 years — after that, you're playing with house money.
Negotiation context
- It's been on market 16 days — a 2% lower offer ($261k) is reasonable based on typical stale-listing flexibility.
Risks & watch-outs
- Climate carrying-cost: moderate flood risk; severe wind risk, 99% chance of damaging wind over 30y; extreme-heat days projected 7→18/yr by 2055 (HVAC capex compounding) — expect insurance premiums to compound above CPI over the hold.
Questions for the listing agent
- Built in 1965 — when were the roof, HVAC, electrical panel, plumbing, and water heater last replaced?
- Is there a deadline driving the sale (1031 exchange, divorce, estate, relocation)? That informs how much negotiation room exists.
- Schools are A-rated — typically a magnet for longer-tenancy family renters. What's the average tenant stay here, and is there a school-zone premium baked into asking?
- Crime grade is D in this area — have there been break-ins, vandalism, or insurance claims at this property in the last 3 years? What carrier currently insures it and at what premium?
- What's the average days-on-market for RENTAL listings here right now (not sales)? A rising rental-DOM trend means longer vacancies and softer asking-rent achievability than the comps imply.
- What's the recent tenant-quality profile in this submarket — average credit score on applications, eviction rate, late-payment / NSF rate, and stable-employment percentage? A property-management company in the area should have these aggregated.
- How much new for-sale + rental construction is in the pipeline within 1–3 miles? Heavy new supply typically softens prices + rents 12–24 months out; constrained supply supports both.
Investment metrics
- 1% rule
- 0.92% ✗
- Cap rate
- 7.86%
- Cash-on-cash
- 5.60%
- DSCR
- 1.25
- GRM
- 9.0
CMA / ARV
- ARV (on-the-fly)
- $357,408
- Comps found
- 9
Show comp detail 9 sales within ~0.75 mi
| Address | Dist | Beds/Ba | Sqft | Sold | Price | $/sf | Match |
|---|---|---|---|---|---|---|---|
| 2209 Odessa St | 0.02mi | 3/2.0 (-1) | 1,164 (-6%) | 2mo | $355,000 | $305 | 78 |
| 2305 Odessa St | 0.09mi | 4/2.0 | 1,224 (-1%) | 16mo | $299,000 | $244 | 76 |
| 2304 Delano St | 0.13mi | 3/2.0 (-1) | 1,190 (-4%) | 6mo | $390,000 | $328 | 73 |
| 1976 Forest Ave | 0.69mi | 5/1.0 (+1) | 1,300 (+5%) | 10mo | $235,000 | $181 | 46 |
| 2044 Delaware Ave | 0.73mi | 3/2.0 (-1) | 1,250 (+1%) | 18mo | $360,000 | $288 | 41 |
| 2006 Delaware Ave | 0.74mi | 3/2.0 (-1) | 1,326 (+7%) | 9mo | $407,300 | $307 | 37 |
| 2025 Forest Ave | 0.63mi | 4/1.5 | 1,056 (-15%) | 18mo | $262,000 | $248 | 29 |
| 2019 Echo Ave | 0.68mi | 3/2.5 (-1) | 1,368 (+10%) | 20mo | $365,000 | $267 | 24 |
| 2030 Delaware Ave | 0.73mi | 3/2.5 (-1) | 1,400 (+13%) | 22mo | $445,000 | $318 | 15 |
Match score weights: distance 35% · size 25% · config 20% · recency 20%. Top-matched comps best support the ARV.
Projected returns pro-forma
-3.0% appreciation · 6.36% rent growth · sell at horizon
- IRR
- -4.4%
- Equity multiple
- 0.83×
- Total profit
- $-12,447
- Equity at exit
- $39,512
- IRR
- 8.5%
- Equity multiple
- 1.74×
- Total profit
- $54,670
- Equity at exit
- $22,912
Cash invested: $74,200 (down + closing). Projections, not guarantees.
Landlord ↔ Tenant lean methodology
- Overall (STATE)
- 90 Strongly Landlord-Friendly
- State South Carolina
- 90 Strongly Landlord-Friendly · R+6
- County
- — inherits STATE
- City
- — inherits STATE
ZIP-level market 29405
- Home prices YoY
- -29.0%
- Rents YoY
- 6.4%
- Active inventory
- 203
- Price-to-rent
- 9.0×
Monthly cashflow live
- Estimated rent
- $2,444 high interval (Pro) →
- Mortgage (P&I)
- −$1,390
- Tax from tax record
- −$84 /mo · $1,013/yr
- Insurance
- −$110
- HOA
- −$0
- Vacancy / Maint / Mgmt
- −$513
- Net cashflow
- $346
Break-even live
UW: 25.0% down · 7.5% · 30yr · 1.5% tax · 5.0% vac · 8.0% maint · 8.0% mgmt
Financing live
Cash to close
- Down payment
- $66,250
- Closing costs
- $7,950
- Reserves months
- —
- Total cash needed
- —
Loan-product check · same deal, 3 products live
Conventional
25% down · 7.5% · 30yr
- Down + closing
- —
- Monthly P&I
- —
- Monthly cashflow
- —
- DSCR
- —
- Eligible?
- —
Personal DTI + credit; lowest rate.
DSCR
20% down · 8.5% · 30yr
- Down + closing
- —
- Monthly P&I
- —
- Monthly cashflow
- —
- DSCR
- —
- Eligible?
- —
No personal income docs; deal must DSCR.
Hard money
10% down · 12.0% · 12mo
- Down + closing
- —
- Monthly P&I
- —
- Monthly cashflow
- —
- DSCR
- —
- Eligible?
- —
Short-term bridge; refi at stabilization.
Rent comps 5 comps
| Address | Beds | Baths | Sqft | Rent | $/sqft | DOM | Units | Dist |
|---|---|---|---|---|---|---|---|---|
| 1855 Doscher Ave North Charleston, SC | 4.0 | 2.0 | 1338 | $2,495 | $1.86 | 10d | 1 | 0.03mi |
| 1837 Doscher Ave North Charleston, SC | 4.0 | 1.0 | 1299 | $2,000 | $1.54 | 23d | 1 | 0.05mi |
| 2023 Four Mile Ln North Charleston, SC | 3.0 | 2.0 | 1104 | $2,300 | $2.08 | 14d | 1 | 0.26mi |
| 925 Rutledge Ave Charleston, SC | 3.0 | 1.0 | 1302 | $2,800 | $2.15 | 14d | 1 | 1.22mi |
| 1941 Clements Ave North Charleston, SC | 4.0 | 2.0 | 984 | $2,200 | $2.24 | 23d | 1 | 1.39mi |
Listing history 2 events
-
2026-05-17status Pending
-
2026-05-01$265,000 Active
ⓘ Source: listings_history table (triggers on properties + properties_extension) + one-shot
backfill from property_details.listing_events for pre-trigger history.
Tax reassessment forecast SC · Resets to sale price
- Current annual tax
- $1,013 · $84/mo
- Projected year-2 tax
- $1,510 · $126/mo
- Expected delta
- +$498/yr (+$41/mo · 49.1%)
ⓘ Screening estimate from a state-policy table — verify with the county assessor before closing.
Climate risk First Street
- Flood 5/10 Major FEMA zone X (shaded) · 24% chance over 30 yrs
- Wildfire 4/10 Moderate
- Heat 10/10 Extreme 7 d/yr ≥105°F today · 18 d/yr by 30 yrs out
- Wind 9/10 Extreme 99% chance of damaging wind over 30 yrs
- Air quality 3/10 Moderate 3 unhealthy d/yr today · 3 by 30 yrs out
Nearby sold comps map
Loading sold comps map…
Walkable amenities ~0.75 mi
Loading nearby amenities…
Taxation est. · year 1
- Rental income
- $29,331
- − Mortgage interest
- −$14,844
- − Property taxes
- −$1,013
- − Insurance
- −$1,325
- − Repairs & maintenance
- −$2,347
- − Management
- −$2,347
- − Depreciation
- −$7,709
- Taxable loss
- −$253
- Est. tax savings @ 24.0%
- +$61
- After-tax cash flow
- $4,218/yr
For passive investors: Depreciation is non-cash, so a rental often shows a tax loss while cash-flowing — sheltering income. Rental losses are passive: they offset passive income freely, and up to $25,000/yr can offset ordinary (W-2) income if you actively participate and your MAGI is under $100k (phasing out to $0 by $150k); unused losses carry forward. On sale, claimed depreciation is recaptured at up to 25%, and gains may owe capital-gains tax (a 1031 exchange can defer both). Figures are a year-1 estimate at your 24.0% rate — not tax advice; consult a CPA.
Schools (NCES district)
- District
- Charleston 01
- NCES district ID
- 4501440
- Math proficiency
- 48% ▼ -2.00%
- Reading proficiency
- 53% ▬ 0.00%
- Median HH income
- $52,376
- Composite
- 43.41/100
- National rank
- #3018
- State rank
- #7 of 80 in SC
Livability — Charleston
- Score
- 76/100
- State rank
- #22
- US rank
- #3336
Category grades
Schools grade is shown separately in the Schools card above.
Census & demographics
- Census place
- Charleston, SC
- County
- Charleston County · 366,793 people
- City population
- 200,573
- Metro
- Charleston-North Charleston, SC
- Population (ZIP)
- 26,254
- Household income
- $56,600
- Rent vs Own
- Severe rent burden
- 1564.0
Population outlook (Charleston County) Hauer SSP2
- Today (2025)
- 480,562 people
- By 2030
- 525,921 · +9.4%
- By 2040
- 612,189 · +27.4%
- By 2050
- 691,627 · +43.9%
- By 2075
- 847,979 · +76.5%
- By 2100
- 926,482 · +92.8%
Race, ethnicity, and origin ACS 2023
- Neighborhood character
- Majority Black (57%)
- Race & ethnicity
- Black 57% White 34% Hispanic / Latino 5% Two or more races 4%
- Hispanic origin (detail)
- Mexican 2%
- Common ancestry
- Slovak 1% Lithuanian 1% Italian 1%
- Foreign-born
- 4% · Canada
- Languages at home
- 93% English-only · Spanish 5%
Political lean MEDSL · Charleston
- 2024 margin
- Lean D (+5.7) · D 51.9% · R 46.3% · Other 1.8%
- 2008→2024 swing
- -2.7pp toward R · 2008: 8.3pp · 2024: 5.7pp
- All cycles
- 2024: D+5.7 2020: D+12.9 2016: D+7.9 2012: D+2.4 2008: D+8.3
Not yet ingested
- Civics
- —
Market trends
- HPI YoY
- ▼ -152.19%
- Current HPI
- 372.8886
- Rent YoY
- ▲ 6.36%
- Metro
- Charleston-North Charleston, SC
- State GDP YoY
- ▲ 4.51%
- F500 in state
- 2
Industry mix (Fortune 500 HQ in SC)
| Industry | F500 HQs | Revenue |
|---|---|---|
| Packaging | 1 | $7B |
|
||
Price history
2 events — show timeline
- 2026-05-17 Pending — Charleston Trident MLS
- 2026-05-01 Listed $265,000 Charleston Trident MLS
Property tax history
-2.6%/yrLatest (2022): $1,013 · +1.1% YoY. Source: county tax records.
Cash-flow waterfall
monthlySold comps — $/sqft
last 12 mo · ≤1 miLoading sold comps…