729 Don Felmet Rd #2 · Marshall, NC
Flood risk 1/10 · Minimal
- FEMA flood zone
- X (unshaded)
- Chance of flooding over 30 yrs
- 0.0%
- Est. flood insurance / yr
- $473 – $860
Fire risk 7/10 · Major
- Est. fire insurance / yr
- $906 – $1,684
Heat risk 4/10 · Minor
- Hot days now (above 98°F)
- 7 days/yr
- Hot days in 30 yrs
- 20 days/yr
Wind risk 2/10 · Minimal
- Chance of severe wind over 30 yrs
- —
Air-quality risk 2/10 · Minimal
- Unhealthy air days now
- 1 days/yr
- Unhealthy air days in 30 yrs
- 1 days/yr
Risk factors via First Street. Map © Google.
Why this score? — see what drove the B grade
The composite is a weighted blend of 9 inputs, each scored 0–100. Each bar is that input's sub-score; the figure is the points it added to the 100-point composite (weight × sub-score).
- Cash flow +20.3/30.0
- ARV discount +15.0/15.0
- Appreciation +10.0/10.0
- DSCR +6.4/10.0
- 1% rule +5.4/10.0
- Schools +4.0/10.0
- Condition / age +3.8/5.0
- Livability +3.4/5.0
- Rent growth +2.5/5.0
$149,000
🖨 Deal sheet 📄 Offer letter ✓ Due diligence
Listing remarks
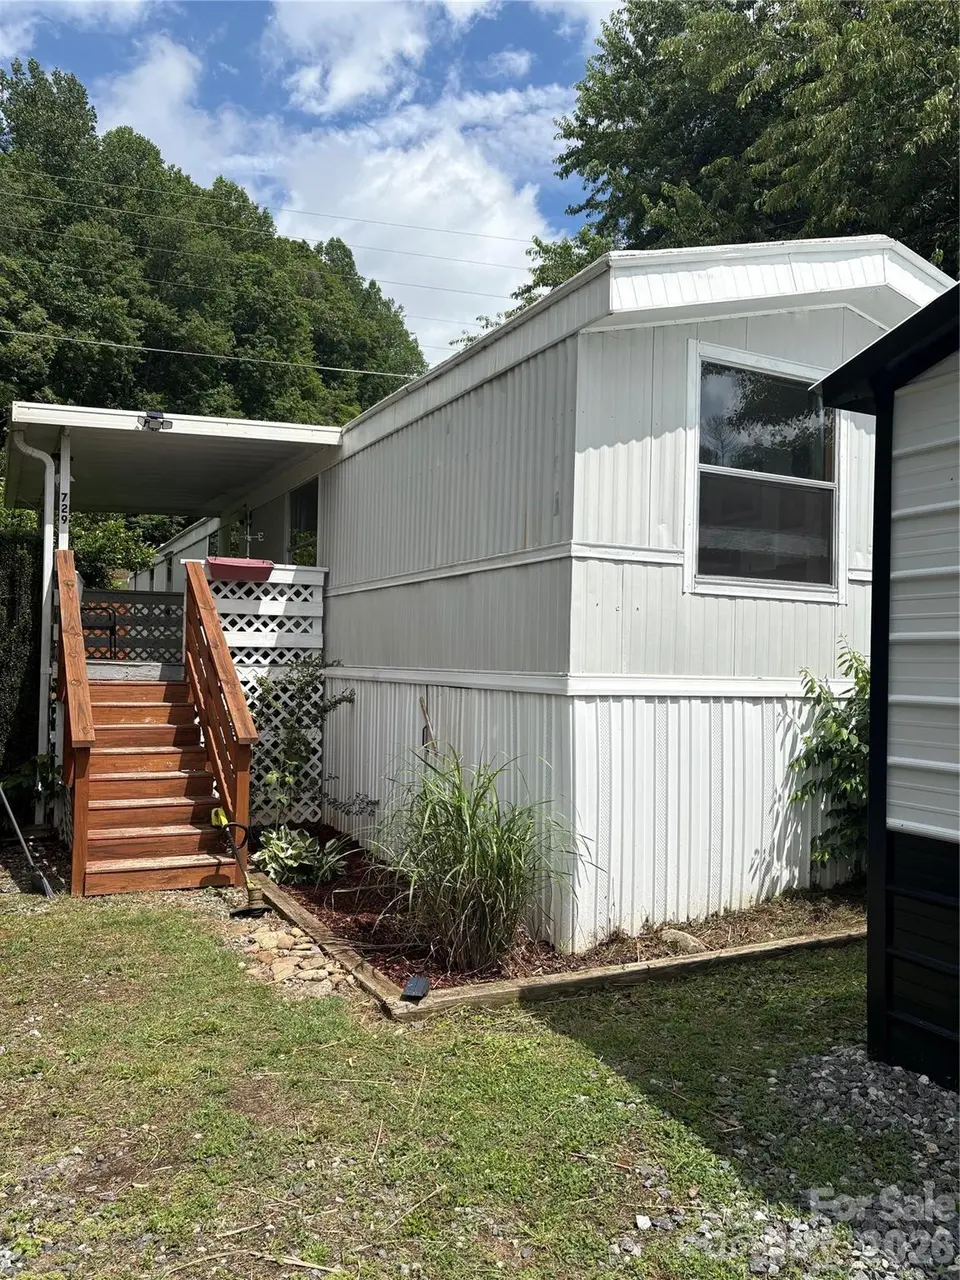
If you want the Perfect Place to get away from the hustle and bussel of the city, yet only be a few minutes ride to Asheville, then this is place for you! This home is perfect for a mountain getaway, first time home owner or rental investment. There are NO RESTRICTIONS and NO HOA. Walk up to your covered front porch and enjoy long range mountain views. Enjoy a private back yard with a huge deck and an outbuilding for additional storage. The home boast an impressive Primary Suite with large double vanity En-Suite and walk-in shower. There is a separate area for the laundry room off the hallway with access to the back deck. The kitchen and dining area offer the open concept so no one is left
Key facts
- Covered front porch
- Private back yard
- Primary suite
Tags
Property features AI
Finance
- Other: No restrictions; Land included with sale
- HOA & community: Not subject to HOA dues
Exterior
- Parking: Detached garage that faces the side; 1 garage space; 1 open parking space
- Utilities: Shared well water; Shared septic
- Home design: Manufactured singlewide residence; Single-story; Crawl space foundation; Facing/entry level: main
- Construction: Vinyl exterior; Manufactured construction
- Exterior features: Outbuilding on property; Publicly maintained road access; Road surfaces: paved and gravel
Interior
- Kitchen: Dishwasher; Electric range; Exhaust hood; Microwave; Refrigerator
- Bedrooms: 1 bedroom on the main level
- Bathrooms: 2 full bathrooms (main level)
- Heating & cooling: Electric heating; Forced air; Heat pump for heating and cooling; Central air; Ceiling fans
- Interior features: 7 total rooms; Entry at main level
- Laundry & utility: Washer/Dryer included; Electric dryer hookup; Laundry room located in hall
Neighborhood map
What this means for you Summary
Snapshot
- This is a 1-bed/2.0-bath single-family listed at $149k. Condition is rated good.
Deal economics
- At list price, monthly cash flow is $191 ($2k/yr) — positive.
- The deal already cash-flows at list — no discount required.
- Meets the 1% rule at list price ($2k rent vs $149k).
- Recommended offer: $147k (1.5% below list) — sets the bar for market timing.
- Cap rate 7.8% vs local median 2.1% in Marshall — top-decile yield for the area; either an underpriced asset or a hidden risk that comps aren't pricing in. Stress-test before assuming the spread holds.
Location & tenants
- Location reads 68/100 on livability (#182 in NC) — a middle-class / working-renter tenant base. Strengths: cost of living A+, health & safety A+, housing B+; Watch: crime D+, amenities D-, commute F.
- Buncombe County Schools (suburban): math 45% / reading 50% proficiency, ranked #72 of 178 in NC (top 40%) — families likely to look elsewhere, expect single-tenant / working-renter base with shorter leases.
- Zoned schools: Leicester Elementary (math 32% / reading 42%, grade F, #771 of 1,410 statewide, top 57%, 367 students, 70% FRL) — zoned schools average 70% FRL vs 47% district-wide (23 pts higher); higher-poverty schools than district average — tighter screening recommended.
- Market conditions: 136 active listings in the ZIP; 3,305 units permitted in Buncombe County in 2024 (1,855 in 5+ unit buildings).
Forward outlook
- In year one you build about $16k of equity ($1k loan paydown + $15k appreciation (10.0% local appreciation)).
- Buncombe County population projected at +24% by 2050 — long-run rental-demand tailwind backs the buy-and-hold thesis.
- At projected returns (10.0% appreciation + 3.0% rent growth), your $42k cash investment doubles in ~3 years — after that, you're playing with house money.
- By year 3, paydown + projected appreciation supports a ~$40k cash-out refi (75% LTV) — recoverable capital for the next deal without selling this one.
Negotiation context
- It's been on market 22 days — a 2% lower offer ($147k) is reasonable based on typical stale-listing flexibility.
Risks & watch-outs
- Climate carrying-cost: major wildfire risk — expect insurance premiums to compound above CPI over the hold.
Questions for the listing agent
- Is there a deadline driving the sale (1031 exchange, divorce, estate, relocation)? That informs how much negotiation room exists.
- Crime grade is D in this area — have there been break-ins, vandalism, or insurance claims at this property in the last 3 years? What carrier currently insures it and at what premium?
- What's the average days-on-market for RENTAL listings here right now (not sales)? A rising rental-DOM trend means longer vacancies and softer asking-rent achievability than the comps imply.
- What's the recent tenant-quality profile in this submarket — average credit score on applications, eviction rate, late-payment / NSF rate, and stable-employment percentage? A property-management company in the area should have these aggregated.
- How much new for-sale + rental construction is in the pipeline within 1–3 miles? Heavy new supply typically softens prices + rents 12–24 months out; constrained supply supports both.
Investment metrics
- 1% rule
- 1.04% ✓
- Cap rate
- 7.83%
- Cash-on-cash
- 5.50%
- DSCR
- 1.24
- GRM
- 8.0
CMA / ARV
- ARV (on-the-fly)
- $241,821
- Comps found
- 2
Show comp detail 2 sales within ~0.75 mi
| Address | Dist | Beds/Ba | Sqft | Sold | Price | $/sf | Match |
|---|---|---|---|---|---|---|---|
| 729 Don Felmet Rd | 0.00mi | 1/2.0 | 873 (0%) | 4mo | $127,500 | $146 | 97 |
| 731 Don Felmet Rd | 0.00mi | 2/1.0 (+1) | 830 (-5%) | 5mo | $230,000 | $277 | 79 |
Match score weights: distance 35% · size 25% · config 20% · recency 20%. Top-matched comps best support the ARV.
Projected returns pro-forma
10.0% appreciation · 3.0% rent growth · sell at horizon
- IRR
- 28.3%
- Equity multiple
- 3.24×
- Total profit
- $93,345
- Equity at exit
- $134,231
- IRR
- 24.6%
- Equity multiple
- 7.36×
- Total profit
- $265,360
- Equity at exit
- $289,474
Cash invested: $41,720 (down + closing). Projections, not guarantees.
Landlord ↔ Tenant lean methodology
- Overall (STATE)
- 85 Strongly Landlord-Friendly
- State North Carolina
- 85 Strongly Landlord-Friendly · R+3
- County
- — inherits STATE
- City
- — inherits STATE
ZIP-level market 28753
- Home prices YoY
- 10.2%
- Active inventory
- 136
- Price-to-rent
- 8.0×
Monthly cashflow live
- Estimated rent
- $1,545 medium interval (Pro) →
- Mortgage (P&I)
- −$781
- Tax est. 1.5%
- −$186 /mo · $2,235/yr
- Insurance
- −$62
- HOA
- −$0
- Vacancy / Maint / Mgmt
- −$325
- Net cashflow
- $191
Break-even live
UW: 25.0% down · 7.5% · 30yr · 1.5% tax · 5.0% vac · 8.0% maint · 8.0% mgmt
Financing live
Cash to close
- Down payment
- $37,250
- Closing costs
- $4,470
- Reserves months
- —
- Total cash needed
- —
Loan-product check · same deal, 3 products live
Conventional
25% down · 7.5% · 30yr
- Down + closing
- —
- Monthly P&I
- —
- Monthly cashflow
- —
- DSCR
- —
- Eligible?
- —
Personal DTI + credit; lowest rate.
DSCR
20% down · 8.5% · 30yr
- Down + closing
- —
- Monthly P&I
- —
- Monthly cashflow
- —
- DSCR
- —
- Eligible?
- —
No personal income docs; deal must DSCR.
Hard money
10% down · 12.0% · 12mo
- Down + closing
- —
- Monthly P&I
- —
- Monthly cashflow
- —
- DSCR
- —
- Eligible?
- —
Short-term bridge; refi at stabilization.
Listing history 16 events
-
2026-06-18days on market $149,000 Active 22 DOM
-
2026-06-17days on market $149,000 Active 21 DOM
-
2026-06-16pricedays on market $149,000 Active 20 DOM
-
2026-06-15days on market $150,000 Active 19 DOM
-
2026-06-14days on market $150,000 Active 17 DOM
-
2026-06-10statusdays on market $150,000 Active 14 DOM
-
2026-06-09days on market $150,000 Active Under Contract 13 DOM
-
2026-06-08days on market $150,000 Active Under Contract 12 DOM
-
2026-06-07days on market $150,000 Active Under Contract 11 DOM
-
2026-06-03days on market $150,000 Active Under Contract 7 DOM
-
2026-06-03status $150,000 Active Under Contract 6 DOM
-
2026-06-02days on market $150,000 Active 6 DOM
-
2026-06-01days on market $150,000 Active 5 DOM
-
2026-05-31days on market $150,000 Active 4 DOM
-
2026-05-30days on market $150,000 Active 3 DOM
-
2026-05-27$150,000 Active
ⓘ Source: listings_history table (triggers on properties + properties_extension) + one-shot
backfill from property_details.listing_events for pre-trigger history.
Climate risk First Street
- Flood 1/10 Low FEMA zone X (unshaded) · 0% chance over 30 yrs
- Wildfire 7/10 Severe
- Heat 4/10 Moderate 7 d/yr ≥98°F today · 20 d/yr by 30 yrs out
- Wind 2/10 Low
- Air quality 2/10 Low 1 unhealthy d/yr today · 1 by 30 yrs out
Nearby sold comps map
Loading sold comps map…
Walkable amenities ~0.75 mi
Loading nearby amenities…
Taxation est. · year 1
- Rental income
- $18,544
- − Mortgage interest
- −$8,346
- − Property taxes
- −$2,235
- − Insurance
- −$745
- − Repairs & maintenance
- −$1,484
- − Management
- −$1,484
- − Depreciation
- −$4,335
- Taxable loss
- −$84
- Est. tax savings @ 24.0%
- +$20
- After-tax cash flow
- $2,314/yr
For passive investors: Depreciation is non-cash, so a rental often shows a tax loss while cash-flowing — sheltering income. Rental losses are passive: they offset passive income freely, and up to $25,000/yr can offset ordinary (W-2) income if you actively participate and your MAGI is under $100k (phasing out to $0 by $150k); unused losses carry forward. On sale, claimed depreciation is recaptured at up to 25%, and gains may owe capital-gains tax (a 1031 exchange can defer both). Figures are a year-1 estimate at your 24.0% rate — not tax advice; consult a CPA.
Condition & rehab AI · 13 photos
This single-family home is in good condition with a good condition score of 75. It has a good roof, exterior siding, and interior walls/paint. The kitchen and bathrooms are clean and functional. The home is surrounded by a well-maintained lawn and a wooden fence. The home is a good investment for both resale and rental.
Value-add opportunities
- Resale Paint the exterior siding — Painting the exterior siding can improve the curb appeal and make the house look more attractive to potential buyers.
- Rental Clean the gutters — Clean gutters can prevent water damage and improve the overall appearance of the house, which can attract more renters.
- Both Trim the bushes and trees around the house — Trimming the bushes and trees can improve the curb appeal and make the house look more attractive to potential buyers and renters.
Renovation cost estimate screening
Value-add ROI direction
- Resale Paint the exterior siding — Painting the exterior siding can improve the curb appeal and make the house look more attractive to potential buyers. ↑
- Rental Clean the gutters — Clean gutters can prevent water damage and improve the overall appearance of the house, which can attract more renters. ↑
- Both Trim the bushes and trees around the house — Trimming the bushes and trees can improve the curb appeal and make the house look more attractive to potential buyers and renters. ↑
ⓘ Cost ranges are severity-bucket heuristics (US national rule-of-thumb). Get contractor quotes + a written scope before underwriting a rehab budget.
Schools (NCES district)
- District
- Buncombe County Schools
- NCES district ID
- 3700450
- Math proficiency
- 45% ▬ 0.00%
- Reading proficiency
- 50% ▲ 2.00%
- Median HH income
- $45,981
- Composite
- 40.32/100
- National rank
- #3749
- State rank
- #72 of 178 in NC
Livability — Marshall
- Score
- 68/100
- State rank
- #182
- US rank
- #9259
Category grades
Schools grade is shown separately in the Schools card above.
Census & demographics
- Population (ZIP)
- 9,778
Population outlook (Buncombe County) Hauer SSP2
- Today (2025)
- 286,475 people
- By 2030
- 302,237 · +5.5%
- By 2040
- 330,687 · +15.4%
- By 2050
- 356,370 · +24.4%
- By 2075
- 409,383 · +42.9%
- By 2100
- 437,270 · +52.6%
Race, ethnicity, and origin ACS 2023
- Neighborhood character
- Predominantly White (91%)
- Race & ethnicity
- White 91% Two or more races 6% Hispanic / Latino 3%
- Common ancestry
- Serbian 6% Slovak 3% Iranian 2%
- Foreign-born
- 1% · Canada
- Languages at home
- 99% English-only · Spanish 1%
Political lean MEDSL · Buncombe
- 2024 margin
- Strong D (+24.8) · D 61.7% · R 36.9% · Other 1.4%
- 2008→2024 swing
- +10.9pp toward D · 2008: 13.9pp · 2024: 24.8pp
- All cycles
- 2024: D+24.8 2020: D+21.1 2016: D+14.6 2012: D+12.4 2008: D+13.9
Not yet ingested
- Civics
- —
Market trends
- HPI YoY
- ▲ 28.22%
- Current HPI
- 305.7339
- Rent YoY
- —
- Metro
- —
- State GDP YoY
- ▲ 3.28%
- F500 in state
- 26
Industry mix (Fortune 500 HQ in NC)
| Industry | F500 HQs | Revenue |
|---|---|---|
| Financial Services | 2 | $213B |
|
||
| Retail | 2 | $95B |
|
||
| Industrial Conglomerate | 1 | $38B |
|
||
| Metals / Steel | 1 | $35B |
|
||
| Utilities | 1 | $30B |
|
||
| Industrial Machinery | 1 | $19B |
|
||
Price history
1 event — show timeline
- 2026-05-27 Listed $150,000 CANOPYMLS as Distributed by MLS Grid
Cash-flow waterfall
monthlySold comps — $/sqft
last 12 mo · ≤1 miLoading sold comps…