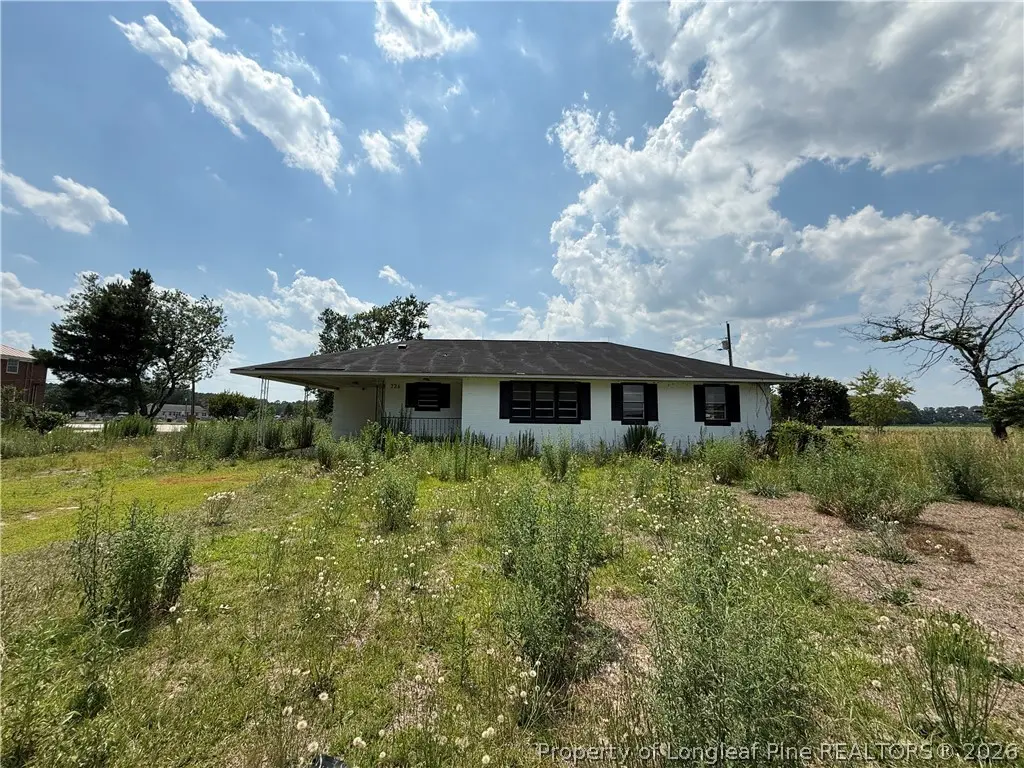
736 Tobermory Rd · St. Pauls, NC
Flood risk 3/10 · Minor
- FEMA flood zone
- X (unshaded)
- Chance of flooding over 30 yrs
- 0.1%
- Est. flood insurance / yr
- $507 – $1,088
Fire risk 5/10 · Moderate
- Est. fire insurance / yr
- $906 – $1,684
Heat risk 7/10 · Major
- Hot days now (above 107°F)
- 7 days/yr
- Hot days in 30 yrs
- 16 days/yr
Wind risk 8/10 · Major
- Chance of severe wind over 30 yrs
- 80.0%
Air-quality risk 1/10 · Minimal
- Unhealthy air days now
- 0 days/yr
- Unhealthy air days in 30 yrs
- 0 days/yr
Risk factors via First Street. Map © Google.
Why this score? — see what drove the C+ grade
The composite is a weighted blend of 9 inputs, each scored 0–100. Each bar is that input's sub-score; the figure is the points it added to the 100-point composite (weight × sub-score).
- Cash flow +29.6/30.0
- DSCR +10.0/10.0
- ARV discount +7.5/15.0
- 1% rule +7.1/10.0
- Rent growth +2.7/5.0
- Livability +2.5/5.0
- Condition / age +2.5/5.0
- Schools +2.1/10.0
- Appreciation +0.0/10.0
$135,000
🖨 Deal sheet (PDF) 📄 Offer letter ✓ Due diligence
Listing remarks
Investor Special. All Brick Ranch. Just Over the Bladen County Line. 3 bedrooms, 2 bathrooms, has a flex room that could be a fourth bedroom. All brick ranch style home sitting on just under an acre of land. No HVAC, no appliances, and no water heater in place. Property is being sold as-is and is priced accordingly. Solid brick construction gives you a strong starting point. The lot size offers room to breathe and potential for added value. This is a rehab opportunity for the investor or handy buyer looking to build equity.
Key facts
- All brick ranch
- Just under an acre
- Parking
Tags
Property features AI
Finance
- Other: Zoning: Residential District
Exterior
- Parking: 1 covered parking space; Carport (1 space)
- Utilities: Water: Other; Sewer: Holding tank and septic tank
- Home design: Single-family residence; One story
- Construction: Brick veneer exterior; Crawl space foundation
- Exterior features: Cleared lot/topography
Interior
- Kitchen: Eat-in kitchen; Granite counters
- Flooring: Laminate flooring
- Bathrooms: 2 full bathrooms
- Heating & cooling: No heating
- Interior features: Eat-in kitchen; Granite counters
Neighborhood map
What this means for you Summary
Snapshot
- This is a 3-bed/3.0-bath single-family listed at $135k.
Deal economics
- At list price, monthly cash flow is $487 ($6k/yr) — positive.
- The deal already cash-flows at list — no discount required.
- Meets the 1% rule at list price ($2k rent vs $135k).
Location & tenants
- Location reads: area grade C — affects rentability + tenant quality, not the cash-flow math above.
- Bladen County Schools (rural): math 20% / reading 31% proficiency, ranked #161 of 178 in NC (top 90%) — low school quality limits family demand, transient renter base, plan for 1-2y turnover; 70% free/reduced lunch — lower-income household profile, screen leases tightly.
- Market conditions: Rents flat; 401 active listings in the ZIP; 159 units permitted in Bladen County in 2024 (0 in 5+ unit buildings).
Forward outlook
- Local home prices are declining (-3.0%/yr); year-one equity from $933 of loan paydown is wiped out by about $4k of value loss. Plan a longer hold.
- Bladen County population projected at -28% by 2050 — secular population decline; favor cash flow + early exit over multi-decade hold.
- At projected returns (-3.0% appreciation + 0.9% rent growth), your $38k cash investment doubles in ~10 years — after that, you're playing with house money.
Negotiation context
- Only 6 days on market — expect competitive offers; lowballing is unlikely to land.
- 4 sale attempts since 4y ago with the ask held roughly flat each time — persistent listings suggest the price (not the market) is what's stuck; bring a comps-based counter.
- Current owner paid $110k; 23% above their basis — modest negotiation headroom, anchor on the comps not their cost.
Risks & watch-outs
- Climate carrying-cost: severe wind risk, 80% chance of damaging wind over 30y; moderate wildfire risk; extreme-heat days projected 7→16/yr by 2055 (HVAC capex compounding) — expect insurance premiums to compound above CPI over the hold.
Questions for the listing agent
- Built in 1967 — when were the roof, HVAC, electrical panel, plumbing, and water heater last replaced?
- Is there a deadline driving the sale (1031 exchange, divorce, estate, relocation)? That informs how much negotiation room exists.
- What's the average days-on-market for RENTAL listings here right now (not sales)? A rising rental-DOM trend means longer vacancies and softer asking-rent achievability than the comps imply.
- What's the recent tenant-quality profile in this submarket — average credit score on applications, eviction rate, late-payment / NSF rate, and stable-employment percentage? A property-management company in the area should have these aggregated.
- How much new for-sale + rental construction is in the pipeline within 1–3 miles? Heavy new supply typically softens prices + rents 12–24 months out; constrained supply supports both.
Investment metrics
- 1% rule
- 1.21% ✓
- Cap rate
- 10.63%
- Cash-on-cash
- 15.47%
- DSCR
- 1.69
- GRM
- 6.9
CMA / ARV
No comps found within radius.
Projected returns pro-forma
-3.0% appreciation · 0.9% rent growth · sell at horizon
- IRR
- 4.0%
- Equity multiple
- 1.15×
- Total profit
- $5,728
- Equity at exit
- $20,129
- IRR
- 11.6%
- Equity multiple
- 1.83×
- Total profit
- $31,428
- Equity at exit
- $11,672
Cash invested: $37,800 (down + closing). Projections, not guarantees.
Landlord ↔ Tenant lean methodology
- Overall (STATE)
- 85 Strongly Landlord-Friendly
- State North Carolina
- 85 Strongly Landlord-Friendly · R+3
- County
- — inherits STATE
- City
- — inherits STATE
ZIP-level market 28306
- Home prices YoY
- -17.7%
- Rents YoY
- 0.9%
- Active inventory
- 401
- Price-to-rent
- 6.9×
Monthly cashflow live
- Estimated rent
- $1,635 medium interval (Pro) →
- Mortgage (P&I)
- −$708
- Tax from tax record
- −$40 /mo · $477/yr
- Insurance
- −$56
- HOA
- −$0
- Vacancy / Maint / Mgmt
- −$343
- Net cashflow
- $487
Break-even live
Sensitivity live
| Price | -10% $564 | -5% $526 | +0% $487 | +5% $449 | +10% $411 |
|---|---|---|---|---|---|
| Rent | -10% $358 | -5% $423 | +0% $487 | +5% $552 | +10% $617 |
| Rate | -1.0pp $555 | -0.5pp $522 | base $487 | +0.5pp $452 | +1.0pp $417 |
UW: 25.0% down · 7.5% · 30yr · 1.5% tax · 5.0% vac · 8.0% maint · 8.0% mgmt
Financing live
Cash to close
- Down payment
- $33,750
- Closing costs
- $4,050
- Reserves months
- —
- Total cash needed
- —
Loan-product check · same deal, 3 products live
Conventional
25% down · 7.5% · 30yr
- Down + closing
- —
- Monthly P&I
- —
- Monthly cashflow
- —
- DSCR
- —
- Eligible?
- —
Personal DTI + credit; lowest rate.
DSCR
20% down · 8.5% · 30yr
- Down + closing
- —
- Monthly P&I
- —
- Monthly cashflow
- —
- DSCR
- —
- Eligible?
- —
No personal income docs; deal must DSCR.
Hard money
10% down · 12.0% · 12mo
- Down + closing
- —
- Monthly P&I
- —
- Monthly cashflow
- —
- DSCR
- —
- Eligible?
- —
Short-term bridge; refi at stabilization.
Listing history 6 events
-
2026-06-18days on market $135,000 Active 6 DOM
-
2026-06-17days on market $135,000 Active 5 DOM
-
2026-06-16days on market $135,000 Active 4 DOM
-
2026-06-15days on market $135,000 Active 3 DOM
-
2026-06-14remarks 529-char remark
-
2026-06-14$135,000 Active 1 DOM
ⓘ Source: listings_history table (triggers on properties + properties_extension) + one-shot
backfill from property_details.listing_events for pre-trigger history.
Tax reassessment forecast NC · Resets to sale price
- Current annual tax
- $477 · $40/mo
- Projected year-2 tax
- $1,107 · $92/mo
- Expected delta
- +$630/yr (+$52/mo · 132.0%)
ⓘ Screening estimate from a state-policy table — verify with the county assessor before closing.
Climate risk First Street
- Flood 3/10 Moderate FEMA zone X (unshaded) · 10% chance over 30 yrs
- Wildfire 5/10 Major
- Heat 7/10 Severe 7 d/yr ≥107°F today · 16 d/yr by 30 yrs out
- Wind 8/10 Severe 80% chance of damaging wind over 30 yrs
- Air quality 1/10 Low 0 unhealthy d/yr today · 0 by 30 yrs out
Nearby sold comps map
Loading sold comps map…
Walkable amenities ~0.75 mi
Loading nearby amenities…
Taxation est. · year 1
- Rental income
- $19,616
- − Mortgage interest
- −$7,562
- − Property taxes
- −$477
- − Insurance
- −$675
- − Repairs & maintenance
- −$1,569
- − Management
- −$1,569
- − Depreciation
- −$3,927
- Taxable income
- $3,835
- Est. tax owed @ 24.0%
- −$921
- After-tax cash flow
- $4,928/yr
For passive investors: Depreciation is non-cash, so a rental often shows a tax loss while cash-flowing — sheltering income. Rental losses are passive: they offset passive income freely, and up to $25,000/yr can offset ordinary (W-2) income if you actively participate and your MAGI is under $100k (phasing out to $0 by $150k); unused losses carry forward. On sale, claimed depreciation is recaptured at up to 25%, and gains may owe capital-gains tax (a 1031 exchange can defer both). Figures are a year-1 estimate at your 24.0% rate — not tax advice; consult a CPA.
Schools (NCES district)
- District
- Bladen County Schools
- NCES district ID
- 3700390
- Math proficiency
- 20% ▼ -9.00%
- Reading proficiency
- 31% ▼ -2.00%
- Median HH income
- $30,769
- Composite
- 20.59/100
- National rank
- #8554
- State rank
- #161 of 178 in NC
Livability — St. Pauls
No livability data for this city. (Only ~50 U.S. cities are tracked.)
Census & demographics
- County
- Cumberland County · 265,314 people
- Metro
- Fayetteville, NC
- Population (ZIP)
- 43,042
- Household income
- $67,544
- Rent vs Own
- Severe rent burden
- 1386.0
Population outlook (Bladen County) Hauer SSP2
- Today (2025)
- 31,854 people
- By 2030
- 30,171 · -5.3%
- By 2040
- 26,444 · -17.0%
- By 2050
- 22,983 · -27.8%
- By 2075
- 16,165 · -49.3%
- By 2100
- 11,329 · -64.4%
Race, ethnicity, and origin ACS 2023
- Neighborhood character
- Diverse neighborhood (Simpson 0.68)
- Race & ethnicity
- White 44% Black 33% Hispanic / Latino 13% Two or more races 8% Asian 4% Native American 2%
- Hispanic origin (detail)
- Mexican 5% Puerto Rican 5%
- Common ancestry
- Italian 2% Slovak 1% Serbian 1%
- Foreign-born
- 8% · Canada, South Korea, Jamaica
- Languages at home
- 87% English-only · Spanish 9% Other Indo-European 1% French/Haitian/Cajun 1%
Political lean MEDSL · Bladen
- 2024 margin
- Strong R (+20.4) · D 39.5% · R 59.9%
- 2008→2024 swing
- -22.5pp toward R · 2008: 2.1pp · 2024: -20.4pp
- All cycles
- 2024: R+20.4 2020: R+13.7 2016: R+9.5 2012: D+2.0 2008: D+2.1
Not yet ingested
- Civics
- —
Market trends
- HPI YoY
- ▼ -51.69%
- Current HPI
- 239.7281
- Rent YoY
- ▲ 0.90%
- Metro
- Fayetteville, NC
- State GDP YoY
- ▲ 3.28%
- F500 in state
- 26
Industry mix (Fortune 500 HQ in NC)
| Industry | F500 HQs | Revenue |
|---|---|---|
| Financial Services | 2 | $213B |
|
||
| Retail | 2 | $95B |
|
||
| Industrial Conglomerate | 1 | $38B |
|
||
| Metals / Steel | 1 | $35B |
|
||
| Utilities | 1 | $30B |
|
||
| Industrial Machinery | 1 | $19B |
|
||
Price history
+22.7% since first listed8 events — show timeline
- 2026-06-08 Listed $135,000 LPRMLS
- 2025-01-27 Price Changed $214,000 LPRMLS
- 2024-12-14 Listed $224,000 LPRMLS
- 2023-02-21 Price Changed $209,000 LPRMLS
- 2022-11-09 Listed $219,000 LPRMLS
- 2022-06-17 Sold (Public Records) $110,000 Public Records
- 2022-06-17 Sold (MLS) $110,000 LPRMLS
- 2022-01-01 Listed $110,000 LPRMLS
Property tax history
+2.4%/yrLatest (2025): $477 · +0.0% YoY. Source: county tax records.
Cash-flow waterfall
monthlySold comps — $/sqft
last 12 mo · ≤1 miLoading sold comps…