1900 W Artesia Blvd #4 · Torrance, CA
Flood risk 4/10 · Minor
- FEMA flood zone
- X (unshaded)
- Chance of flooding over 30 yrs
- 0.22%
- Est. flood insurance / yr
- $507 – $1,088
Fire risk 1/10 · Minimal
- Est. fire insurance / yr
- $659 – $1,223
Heat risk 4/10 · Minor
- Hot days now (above 86°F)
- 6 days/yr
- Hot days in 30 yrs
- 16 days/yr
Wind risk 1/10 · Minimal
- Chance of severe wind over 30 yrs
- —
Air-quality risk 5/10 · Moderate
- Unhealthy air days now
- 7 days/yr
- Unhealthy air days in 30 yrs
- 7 days/yr
Risk factors via First Street. Map © Google.
Why this score? — see what drove the B grade
The composite is a weighted blend of 9 inputs, each scored 0–100. Each bar is that input's sub-score; the figure is the points it added to the 100-point composite (weight × sub-score).
- Cash flow +30.0/30.0
- 1% rule +10.0/10.0
- DSCR +10.0/10.0
- ARV discount +7.5/15.0
- Schools +5.9/10.0
- Condition / age +4.0/5.0
- Livability +3.8/5.0
- Rent growth +3.1/5.0
- Appreciation +0.0/10.0
$154,000
🖨 Deal sheet 📄 Offer letter ✓ Due diligence
Listing remarks MLS
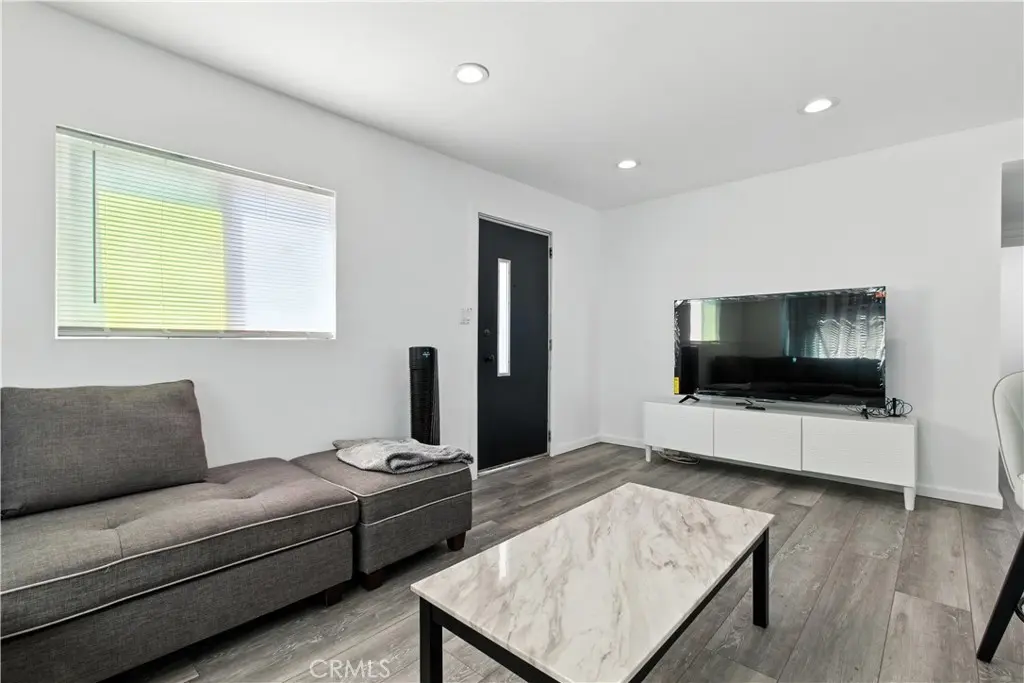
OPEN HOUSE SATURDAY 5/16 12:30 PM TO 3:30 PM. Fully furnished and meticulously maintained, this turnkey home includes all appliances for a seamless move-in. Suitable as a primary residence, vacation home, or investment property, it offers a rare opportunity to enjoy a fully prepared living space with no additional work required.
Key facts
- 2 garage spots
- Community pool
- Built 1972
Neighborhood map
What this means for you Summary
Snapshot
- This is a 2-bed/1.0-bath manufactured listed at $154k. Condition is rated good.
Deal economics
- At list price, monthly cash flow is $1k ($12k/yr) — positive.
- The deal already cash-flows at list — no discount required.
- Meets the 1% rule at list price ($3k rent vs $154k).
- Cap rate 14.1% vs local median 2.1% in Torrance — top-decile yield for the area; either an underpriced asset or a hidden risk that comps aren't pricing in. Stress-test before assuming the spread holds.
Location & tenants
- Location reads 76/100 on livability (#95 in CA, #3,501 nationally) — a middle-class / working-renter tenant base. Strengths: schools A+, amenities A+, commute A+; Watch: health & safety C-, crime D+, cost of living F.
- Torrance Unified (urban): math 62% / reading 67% proficiency, ranked #150 of 1,400 in CA (top 11%) — acceptable for families but not a draw, mixed tenant base, ~2y average lease; only 20% free/reduced lunch — higher-income household profile.
- Market conditions: Rents rising (+2.3%/yr); 33 active listings in the ZIP; 40 comparable units currently listed for rent nearby; rentals lingering (median 44d on market — plan ~5-8 weeks vacancy on turnover, expect pricing pressure); 52% of comp listings sitting > 30 days — soft ceiling on asking rent; solid renter incomes; 19,697 units permitted in Los Angeles County in 2024 (9,426 in 5+ unit buildings).
Forward outlook
- Local home prices are declining (-3.0%/yr); year-one equity from $1k of loan paydown is wiped out by about $5k of value loss. Plan a longer hold.
- Los Angeles County population projected at +9% by 2050 — modest demand growth; plan on rents tracking national, not racing it.
- At projected returns (-3.0% appreciation + 2.3% rent growth), your $43k cash investment doubles in ~5 years — after that, you're playing with house money.
Negotiation context
- Only 7 days on market — expect competitive offers; lowballing is unlikely to land.
- 4 sale attempts; this cycle's ask has dropped $11k (7%) from the opening price — seller is motivated, your offer sets the floor, not the list.
Questions for the listing agent
- Built in 1972 — when were the roof, HVAC, electrical panel, plumbing, and water heater last replaced?
- Is there a deadline driving the sale (1031 exchange, divorce, estate, relocation)? That informs how much negotiation room exists.
- Schools are A-rated — typically a magnet for longer-tenancy family renters. What's the average tenant stay here, and is there a school-zone premium baked into asking?
- Crime grade is D in this area — have there been break-ins, vandalism, or insurance claims at this property in the last 3 years? What carrier currently insures it and at what premium?
- What's the average days-on-market for RENTAL listings here right now (not sales)? A rising rental-DOM trend means longer vacancies and softer asking-rent achievability than the comps imply.
- What's the recent tenant-quality profile in this submarket — average credit score on applications, eviction rate, late-payment / NSF rate, and stable-employment percentage? A property-management company in the area should have these aggregated.
- How much new for-sale + rental construction is in the pipeline within 1–3 miles? Heavy new supply typically softens prices + rents 12–24 months out; constrained supply supports both.
Investment metrics
- 1% rule
- 1.70% ✓
- Cap rate
- 14.15%
- Cash-on-cash
- 28.04%
- DSCR
- 2.25
- GRM
- 4.9
CMA / ARV
- ARV (median comp)
- $88,854
- List price
- $154,000
- Delta
- 74.33%
- Verdict
- OVERPRICED
- Comps
- 17 within 1.0 mi
Show comp detail 4 sales within ~0.75 mi
| Address | Dist | Beds/Ba | Sqft | Sold | Price | $/sf | Match |
|---|---|---|---|---|---|---|---|
| 17100 Gramercy Pl #28 | 0.26mi | 2/2.0 | 788 (-2%) | 9mo | $165,000 | $209 | 74 |
| 16950 S Gramercy Pl Unit 23 A | 0.44mi | 2/1.0 | 768 (-4%) | 1mo | $85,000 | $111 | 72 |
| 17700 S WESTERN Ave #133 | 0.27mi | 2/1.0 | 800 (0%) | 23mo | $120,000 | $150 | 68 |
| 16949 S Western Ave #58 | 0.40mi | 2/1.0 | 704 (-12%) | 15mo | $169,000 | $240 | 49 |
Match score weights: distance 35% · size 25% · config 20% · recency 20%. Top-matched comps best support the ARV.
Projected returns pro-forma
-3.0% appreciation · 2.26% rent growth · sell at horizon
- IRR
- 21.4%
- Equity multiple
- 1.87×
- Total profit
- $37,327
- Equity at exit
- $22,962
- IRR
- 29.0%
- Equity multiple
- 3.49×
- Total profit
- $107,470
- Equity at exit
- $13,315
Cash invested: $43,120 (down + closing). Projections, not guarantees.
Landlord ↔ Tenant lean methodology
- Overall (STATE)
- 18 Strongly Tenant-Friendly
- State California
- 18 Strongly Tenant-Friendly · D+13
- County
- — inherits STATE
- City
- — inherits STATE
ZIP-level market 90504
- Rents YoY
- 2.3%
- Active inventory
- 33
- Price-to-rent
- 4.9×
Monthly cashflow live
- Estimated rent
- $2,623 high interval (Pro) →
- Mortgage (P&I)
- −$808
- Tax est. 1.5%
- −$192 /mo · $2,310/yr
- Insurance
- −$64
- HOA
- −$0
- Vacancy / Maint / Mgmt
- −$551
- Net cashflow
- $1,008
Break-even live
UW: 25.0% down · 7.5% · 30yr · 1.5% tax · 5.0% vac · 8.0% maint · 8.0% mgmt
Financing live
Cash to close
- Down payment
- $38,500
- Closing costs
- $4,620
- Reserves months
- —
- Total cash needed
- —
Loan-product check · same deal, 3 products live
Conventional
25% down · 7.5% · 30yr
- Down + closing
- —
- Monthly P&I
- —
- Monthly cashflow
- —
- DSCR
- —
- Eligible?
- —
Personal DTI + credit; lowest rate.
DSCR
20% down · 8.5% · 30yr
- Down + closing
- —
- Monthly P&I
- —
- Monthly cashflow
- —
- DSCR
- —
- Eligible?
- —
No personal income docs; deal must DSCR.
Hard money
10% down · 12.0% · 12mo
- Down + closing
- —
- Monthly P&I
- —
- Monthly cashflow
- —
- DSCR
- —
- Eligible?
- —
Short-term bridge; refi at stabilization.
Rent comps 40 comps
| Address | Beds | Baths | Sqft | Rent | $/sqft | DOM | Units | Dist |
|---|---|---|---|---|---|---|---|---|
| 17313 Denker Ave Unit 4 Gardena, CA | 2.0 | 1.0 | 985 | $2,300 | $2.34 | 43d | 1 | 0.37mi |
| 17405 Van Ness Ave Torrance, CA | 2.0 | 2.0 | 850 | $2,775 | $3.26 | 15d | 1 | 0.40mi |
| 16507 Saint Andrews Pl Unit C Gardena, CA | 2.0 | 1.0 | 850 | $2,650 | $3.12 | 43d | 1 | 0.60mi |
| 1443 W 179th St Unit 107 Gardena, CA | 2.0 | 1.0 | 800 | $2,450 | $3.06 | 24d | 1 | 0.65mi |
| 1443 W 179th St Apt 104 Gardena, CA | 2.0 | 2.0 | 850 | $2,500 | $2.94 | 43d | 1 | 0.65mi |
| 1439 W 179th St Unit 03 Gardena, CA | 2.0 | 1.0 | 650 | $2,250 | $3.46 | 43d | 1 | 0.67mi |
| 1616 W Gardena Blvd Gardena, CA | 2.0 | 1.0 | 882 | $2,800 | $3.17 | 3d | 1 | 0.76mi |
| 16326 Denker Ave Gardena, CA | 2.0 | 1.0 | 908 | $3,000 | $3.30 | 43d | 1 | 0.81mi |
| 17229 Atkinson Ave Torrance, CA | 3.0 | 1.0 | 967 | $3,600 | $3.72 | 43d | 1 | 0.85mi |
| 18424 S Normandie Ave Gardena, CA | 1.0 | 1.0 | 550 | $1,900 | $3.45 | 43d | 1 | 0.91mi |
| 16120 Van Ness Ave Unit 6 Torrance, CA | 2.0 | 1.0 | 690 | $2,026 | $2.94 | 18d | 1 | 0.92mi |
| 1243 Electric St Gardena, CA | 2.0 | 2.0 | 866 | $2,850 | $3.29 | 7d | 1 | 0.94mi |
| 17901 Crenshaw Blvd Unit 4 Torrance, CA | 1.0 | 1.0 | 615 | $2,495 | $4.06 | 24d | 1 | 0.95mi |
| 1328 W Gardena Blvd Apt 3 Gardena, CA | 2.0 | 2.0 | 1080 | $2,700 | $2.50 | 43d | 1 | 0.95mi |
| 16901 Crenshaw Blvd Unit 1 Torrance, CA | 2.0 | 1.0 | 800 | $2,500 | $3.12 | 24d | 1 | 0.97mi |
| 16020 Van Ness Ave Torrance, CA | 1.0 | 1.0 | 550 | $1,950 | $3.55 | 43d | 2 | 0.98mi |
| 1343 W 164th St Gardena, CA | 2.0 | 2.0 | 800 | $2,700 | $3.38 | 24d | 1 | 1.00mi |
| 16713 Crenshaw Blvd Torrance, CA | 3.0 | 1.0 | 850 | $2,450 | $2.88 | 43d | 1 | 1.02mi |
| 17309 Elgar Ave Torrance, CA | 2.0 | 1.0 | 838 | $3,400 | $4.06 | 12d | 1 | 1.03mi |
| 17309 Elgar Ave Torrance, CA | 2.0 | 1.0 | 838 | $3,400 | $4.06 | 7d | 1 | 1.03mi |
| 1321 W 186th St Gardena, CA | 1.0 | 1.0 | 600 | $1,800 | $3.00 | 43d | 1 | 1.03mi |
| 15825 Denker Ave Unit A Gardena, CA | 2.0 | 1.0 | 900 | $2,750 | $3.06 | 43d | 1 | 1.09mi |
| 2501 W Redondo Beach Blvd Unit 242 Gardena, CA | 1.0 | 1.0 | 550 | $1,800 | $3.27 | 43d | 1 | 1.09mi |
| 17513 Glenburn Ave Torrance, CA | 2.0 | 2.0 | 800 | $3,195 | $3.99 | 43d | 1 | 1.13mi |
| 3313 Artesia Blvd Torrance, CA | 1.0 | 1.0 | 750 | $1,895 | $2.53 | 43d | 1 | 1.15mi |
| 2125 W 157th St Unit 10 Gardena, CA | 1.0 | 1.0 | 700 | $2,050 | $2.93 | 4d | 1 | 1.16mi |
| 16935 S Vermont Ave Gardena, CA | 2.0 | 1.0 | 850 | $2,295 | $2.70 | 24d | 1 | 1.18mi |
| 16920 S Vermont Ave Unit D Gardena, CA | 2.0 | 1.5 | 1100 | $2,795 | $2.54 | 18d | 1 | 1.22mi |
| 16920 S Vermont Ave Gardena, CA | 2.0 | 1.5 | 1100 | $2,795 | $2.54 | 24d | 1 | 1.22mi |
| 15717 Brighton Ave Unit B Gardena, CA | 1.0 | 1.0 | 650 | $2,200 | $3.38 | 24d | 1 | 1.24mi |
| 860 W 165th Pl Unit 103 Gardena, CA | 1.0 | 1.0 | 589 | $1,775 | $3.01 | 43d | 1 | 1.29mi |
| 860 W 165th Pl Apt 201 Gardena, CA | 2.0 | 2.0 | 925 | $2,395 | $2.59 | 43d | 1 | 1.29mi |
| 15702 Brighton Ave Unit 4 Gardena, CA | 2.0 | 1.0 | 750 | $2,500 | $3.33 | 18d | 1 | 1.31mi |
| 17302 Yukon Ave Torrance, CA | 2.0 | 2.0 | 990 | $2,782 | $2.81 | 24d | 2 | 1.36mi |
| 844 W 164th St Unit 9402A Gardena, CA | 1.0 | 1.0 | 615 | $2,500 | $4.07 | 43d | 1 | 1.36mi |
| 3444 Redondo Beach Blvd Unit 3 Torrance, CA | 1.0 | 1.0 | 668 | $1,850 | $2.77 | 18d | 1 | 1.38mi |
| 17030 Yukon Ave Torrance, CA | 1.0 | 1.0 | 600 | $2,100 | $3.50 | 43d | 1 | 1.40mi |
| 17035 Yukon Ave Torrance, CA | 1.0 | 1.0 | 720 | $2,195 | $3.05 | 43d | 1 | 1.43mi |
| 16700 Yukon Ave #108 Torrance, CA | 2.0 | 2.0 | 859 | $3,200 | $3.73 | 43d | 1 | 1.44mi |
| 16724 Yukon Ave Torrance, CA | 1.0 | 1.0 | 705 | $2,595 | $3.68 | 24d | 1 | 1.45mi |
Listing history 23 events
-
2026-06-18days on market $154,000 Active 7 DOM
-
2026-06-17days on market $154,000 Active 6 DOM
-
2026-06-16days on market $154,000 Active 5 DOM
-
2026-06-15days on market $154,000 Active 4 DOM
-
2026-06-13days on market $154,000 Active 2 DOM
-
2026-06-13remarks 395-char remark
-
2026-06-13pricedays on market $154,000 Active 1 DOM
-
2026-06-08days on market $154,900 Active 125 DOM
-
2026-06-07days on market $154,900 Active 124 DOM
-
2026-06-04days on market $154,900 Active 122 DOM
-
2026-06-03days on market $154,900 Active 121 DOM
-
2026-06-02days on market $154,900 Active 120 DOM
-
2026-06-01days on market $154,900 Active 119 DOM
-
2026-05-31days on market $154,900 Active 118 DOM
-
2026-05-16price $154,900 330-char remark
Show marketing remark (330 chars)
OPEN HOUSE SATURDAY 5/16 12:30 PM TO 3:30 PM. Fully furnished and meticulously maintained, this turnkey home includes all appliances for a seamless move-in. Suitable as a primary residence, vacation home, or investment property, it offers a rare opportunity to enjoy a fully prepared living space with no additional work required.
-
2026-03-18price $159,900 330-char remark
Show marketing remark (330 chars)
OPEN HOUSE SATURDAY 5/16 12:30 PM TO 3:30 PM. Fully furnished and meticulously maintained, this turnkey home includes all appliances for a seamless move-in. Suitable as a primary residence, vacation home, or investment property, it offers a rare opportunity to enjoy a fully prepared living space with no additional work required.
-
2026-02-02$165,000 Active 330-char remark
Show marketing remark (330 chars)
OPEN HOUSE SATURDAY 5/16 12:30 PM TO 3:30 PM. Fully furnished and meticulously maintained, this turnkey home includes all appliances for a seamless move-in. Suitable as a primary residence, vacation home, or investment property, it offers a rare opportunity to enjoy a fully prepared living space with no additional work required.
-
2026-01-30historical
-
2025-12-01$165,000 Active
-
2025-12-01historical
-
2025-10-07$169,000 Active
-
2025-10-03historical
-
2025-08-08$169,900 Active
ⓘ Source: listings_history table (triggers on properties + properties_extension) + one-shot
backfill from property_details.listing_events for pre-trigger history.
Climate risk First Street
- Flood 4/10 Moderate FEMA zone X (unshaded) · 22% chance over 30 yrs
- Wildfire 1/10 Low
- Heat 4/10 Moderate 6 d/yr ≥86°F today · 16 d/yr by 30 yrs out
- Wind 1/10 Low
- Air quality 5/10 Major 7 unhealthy d/yr today · 7 by 30 yrs out
Nearby sold comps map
Loading sold comps map…
Walkable amenities ~0.75 mi
Loading nearby amenities…
Taxation est. · year 1
- Rental income
- $31,473
- − Mortgage interest
- −$8,626
- − Property taxes
- −$2,310
- − Insurance
- −$770
- − Repairs & maintenance
- −$2,518
- − Management
- −$2,518
- − Depreciation
- −$4,480
- Taxable income
- $10,251
- Est. tax owed @ 24.0%
- −$2,460
- After-tax cash flow
- $9,632/yr
For passive investors: Depreciation is non-cash, so a rental often shows a tax loss while cash-flowing — sheltering income. Rental losses are passive: they offset passive income freely, and up to $25,000/yr can offset ordinary (W-2) income if you actively participate and your MAGI is under $100k (phasing out to $0 by $150k); unused losses carry forward. On sale, claimed depreciation is recaptured at up to 25%, and gains may owe capital-gains tax (a 1031 exchange can defer both). Figures are a year-1 estimate at your 24.0% rate — not tax advice; consult a CPA.
Condition & rehab AI · 13 photos
This turnkey home is in good condition with modern updates, ready for immediate move-in. Consider landscaping and exterior paint for further value enhancement.
Value-add opportunities
- Both landscaping — improves curb appeal and adds value
- Both exterior paint — enhances curb appeal and adds value
Renovation cost estimate screening
Value-add ROI direction
- Both landscaping — improves curb appeal and adds value ↑
- Both exterior paint — enhances curb appeal and adds value ↑
ⓘ Cost ranges are severity-bucket heuristics (US national rule-of-thumb). Get contractor quotes + a written scope before underwriting a rehab budget.
Schools (NCES district)
- District
- Torrance Unified
- NCES district ID
- 0639420
- Math proficiency
- 62% ▲ 2.00%
- Reading proficiency
- 67% ▬ 0.00%
- Median HH income
- $78,640
- Composite
- 58.96/100
- National rank
- #1969
- State rank
- #150 of 1400 in CA
Livability — Torrance
- Score
- 76/100
- State rank
- #95
- US rank
- #3501
Category grades
Schools grade is shown separately in the Schools card above.
Census & demographics
- Census place
- Torrance, CA
- County
- Los Angeles County · 9,444,647 people
- City population
- 153,473
- Metro
- Los Angeles-Long Beach-Anaheim, CA
- Population (ZIP)
- 33,084
- Household income
- $107,552
- Rent vs Own
- Severe rent burden
- 1335.0
Population outlook (Los Angeles County) Hauer SSP2
- Today (2025)
- 10,940,515 people
- By 2030
- 11,256,481 · +2.9%
- By 2040
- 11,729,929 · +7.2%
- By 2050
- 11,948,407 · +9.2%
- By 2075
- 11,818,114 · +8.0%
- By 2100
- 10,842,928 · -0.9%
Race, ethnicity, and origin ACS 2023
- Neighborhood character
- Highly diverse neighborhood (Simpson 0.72)
- Race & ethnicity
- Asian 39% Hispanic / Latino 26% White 24% Two or more races 16% Black 4%
- Hispanic origin (detail)
- Mexican 18%
- Common ancestry
- Lithuanian 1% Slovak 1% Portuguese 1%
- Foreign-born
- 29% · Canada, South Korea, Vietnam
- Languages at home
- 57% English-only · Spanish 14% Other Asian/Pacific 6% Korean 5%
Political lean MEDSL · Los Angeles
- 2024 margin
- Solid D (+32.9) · D 64.8% · R 31.9% · Other 3.3%
- 2008→2024 swing
- -7.4pp toward R · 2008: 40.4pp · 2024: 32.9pp
- All cycles
- 2024: D+32.9 2020: D+44.2 2016: D+48.0 2012: D+40.0 2008: D+40.4
Not yet ingested
- Civics
- —
Market trends
- HPI YoY
- ▼ -940.72%
- Current HPI
- 387.9811
- Rent YoY
- ▲ 2.26%
- Metro
- Los Angeles-Long Beach-Anaheim, CA
- State GDP YoY
- ▲ 3.21%
- F500 in state
- 116
Industry mix (Fortune 500 HQ in CA)
| Industry | F500 HQs | Revenue |
|---|---|---|
| Technology | 27 | $1,492B |
|
||
| Financial Services | 3 | $174B |
|
||
| Retail | 3 | $44B |
|
||
| Insurance | 3 | $26B |
|
||
| Media / Entertainment | 2 | $115B |
|
||
| Pharmaceuticals / Biotech | 2 | $62B |
|
||
Price history
-8.8% since first listed9 events — show timeline
- 2026-05-16 Price Changed $154,900 CRMLS
- 2026-03-18 Price Changed $159,900 CRMLS
- 2026-02-02 Listed $165,000 CRMLS
- 2026-01-30 Listing Removed — CRMLS
- 2025-12-01 Listing Removed — CRMLS
- 2025-12-01 Listed $165,000 CRMLS
- 2025-10-07 Listed $169,000 CRMLS
- 2025-10-03 Listing Removed — CRMLS
- 2025-08-08 Listed $169,900 CRMLS
Cash-flow waterfall
monthlySold comps — $/sqft
last 12 mo · ≤1 miLoading sold comps…