3081 Lynn Ln · Abilene, TX
Flood risk No data
- FEMA flood zone
- —
- Chance of flooding over 30 yrs
- —
- Est. flood insurance / yr
- —
Fire risk No data
- Est. fire insurance / yr
- —
Heat risk No data
- Hot days now (above threshold)
- —
- Hot days in 30 yrs
- —
Wind risk No data
- Chance of severe wind over 30 yrs
- —
Air-quality risk No data
- Unhealthy air days now
- —
- Unhealthy air days in 30 yrs
- —
Risk factors via First Street. Map © Google.
Why this score? — see what drove the D+ grade
The composite is a weighted blend of 9 inputs, each scored 0–100. Each bar is that input's sub-score; the figure is the points it added to the 100-point composite (weight × sub-score).
- Cash flow +16.3/30.0
- ARV discount +7.4/15.0
- DSCR +5.1/10.0
- Rent growth +5.0/5.0
- 1% rule +4.4/10.0
- Livability +3.8/5.0
- Schools +2.8/10.0
- Condition / age +2.5/5.0
- Appreciation +0.0/10.0
$272,490
🖨 Deal sheet 📄 Offer letter ✓ Due diligence
Listing remarks
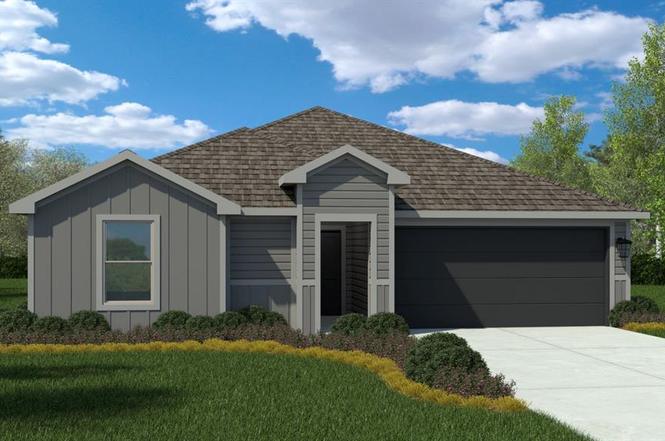
D. R. HORTON AMERICA'S BUILDER is EXCITED TO SERVE AS YOUR HOME BUILDER in the FABULOUS COMMUNITY of HAMPTON HILLS in ABILENE! Great open concept single Story home! Optimizing indoor and outdoor entertainment space with an open Living, Dining and large Chef's Kitchen complete with Island, Stainless Steel Appliances, Gas Range, Granite Countertops, 4 inch backsplash, Cabinet Hardware, SS undermount Sink and walk-in pantry. Large primary and big walk-in Closet. Wood look tile floors with plush carpet only in the Bedrooms, Gas Tankless Water Heater, double pane-low E Windows plus Home is Connected Smart Home Technology Pkg. Covered front porch, wide covered back Patio, 6 ft wood privacy fenced
Key facts
- Open concept
- Granite countertops
- Chef's kitchen
Tags
Neighborhood map
What this means for you Summary
Snapshot
- This is a 3-bed/2.0-bath single-family listed at $272k.
Deal economics
- At list price, monthly cash flow is $151 ($2k/yr) — positive.
- The deal already cash-flows at list — no discount required.
- To meet the 1% rule (rent ≥ 1% of price), the offer needs to be $257k (5.5% below list).
- Recommended offer: $257k (5.5% below list) — sets the bar for 1% rule.
Location & tenants
- Location reads 75/100 on livability (#142 in TX, #4,037 nationally) — a middle-class / working-renter tenant base. Strengths: cost of living A+, housing A+, health & safety A+; Watch: crime D, commute F.
- Abilene ISD (urban): math 32% / reading 34% proficiency, ranked #575 of 826 in TX (top 70%) — families likely to look elsewhere, expect single-tenant / working-renter base with shorter leases.
- Zoned schools: Dyess El (math 48% / reading 53%, grade D+, #833 of 4,322 statewide, top 20%, 617 students, 69% FRL).
- Zoned-school proficiency averages 50% at this address vs 33% district-wide (+18 pts) — the actual schools serving this property are materially stronger than the Abilene ISD average implies; a family-tenant draw the district grade alone would hide.
- Market conditions: Rents rising fast (+40.7%/yr); 288 active listings in the ZIP; 9 comparable units currently listed for rent nearby; rentals leasing fast (median 13d on market — plan ~1-2 weeks tenant-placement turnaround); solid renter incomes; 508 units permitted in Taylor County in 2024 (0 in 5+ unit buildings).
- This rent runs 39% of the median local income ($79k/yr) — at the standard rent-burdened threshold; future hikes will face affordability resistance.
Forward outlook
- Local home prices are declining (-3.0%/yr); year-one equity from $2k of loan paydown is wiped out by about $8k of value loss. Plan a longer hold.
- Taylor County population projected at +16% by 2050 — long-run rental-demand tailwind backs the buy-and-hold thesis.
- At projected returns (-3.0% appreciation + 8.0% rent growth), your $76k cash investment doubles in ~10 years — after that, you're playing with house money.
Negotiation context
- Only 14 days on market — expect competitive offers; lowballing is unlikely to land.
Questions for the listing agent
- Is there a deadline driving the sale (1031 exchange, divorce, estate, relocation)? That informs how much negotiation room exists.
- Schools are D-rated, which usually means shorter tenancies and higher turnover. Who's the typical renter profile here, and what's been the actual vacancy rate?
- Crime grade is D in this area — have there been break-ins, vandalism, or insurance claims at this property in the last 3 years? What carrier currently insures it and at what premium?
- The area grade is low — what's the realistic commute time and amenity access for the typical tenant pool here? Any planned neighborhood developments (good or bad) we should know about?
- What's the average days-on-market for RENTAL listings here right now (not sales)? A rising rental-DOM trend means longer vacancies and softer asking-rent achievability than the comps imply.
- What's the recent tenant-quality profile in this submarket — average credit score on applications, eviction rate, late-payment / NSF rate, and stable-employment percentage? A property-management company in the area should have these aggregated.
- How much new for-sale + rental construction is in the pipeline within 1–3 miles? Heavy new supply typically softens prices + rents 12–24 months out; constrained supply supports both.
Investment metrics
- 1% rule
- 0.94% ✗
- Cap rate
- 6.96%
- Cash-on-cash
- 2.37%
- DSCR
- 1.11
- GRM
- 8.8
CMA / ARV
- ARV (on-the-fly)
- $272,118
- Comps found
- 12
Show comp detail 12 sales within ~0.75 mi
| Address | Dist | Beds/Ba | Sqft | Sold | Price | $/sf | Match |
|---|---|---|---|---|---|---|---|
| 3081 Lynn Ln | 0.00mi | 3/2.0 | 1,254 (0%) | 0mo | $272,490 | $217 | 100 |
| 3088 Lynn Ln | 0.01mi | 3/2.0 | 1,254 (0%) | 1mo | $276,490 | $220 | 99 |
| 3033 Lynn Ln | 0.07mi | 3/2.0 | 1,254 (0%) | 6mo | $272,490 | $217 | 92 |
| 3024 Lynn Ln | 0.08mi | 3/2.0 | 1,254 (0%) | 6mo | $272,490 | $217 | 91 |
| 3048 Lynn Ln | 0.14mi | 3/2.0 | 1,254 (0%) | 3mo | $272,490 | $217 | 91 |
| 2847 Lynn Ln | 0.21mi | 3/2.0 | 1,254 (0%) | 2mo | $272,490 | $217 | 89 |
| 3065 Lynn Ln | 0.21mi | 3/2.0 | 1,254 (0%) | 3mo | $272,490 | $217 | 88 |
| 2854 Lynn Ln | 0.26mi | 3/2.0 | 1,254 (0%) | 3mo | $273,015 | $218 | 85 |
| 3417 Seymour Ct | 0.64mi | 3/2.0 | 1,288 (+3%) | 1mo | $287,900 | $224 | 65 |
| 3032 Lynn Ln | 0.07mi | 2/2.0 (-1) | 1,082 (-14%) | 5mo | $260,490 | $241 | 65 |
| 3017 Lynn Ln | 0.09mi | 2/2.0 (-1) | 1,082 (-14%) | 6mo | $260,490 | $241 | 63 |
| 2726 Bishop Rd | 0.51mi | 3/2.0 | 1,376 (+10%) | 5mo | $215,000 | $156 | 56 |
Match score weights: distance 35% · size 25% · config 20% · recency 20%. Top-matched comps best support the ARV.
Projected returns pro-forma
-3.0% appreciation · 8.0% rent growth · sell at horizon
- IRR
- -7.1%
- Equity multiple
- 0.73×
- Total profit
- $-20,919
- Equity at exit
- $40,629
- IRR
- 7.9%
- Equity multiple
- 1.74×
- Total profit
- $56,215
- Equity at exit
- $23,560
Cash invested: $76,297 (down + closing). Projections, not guarantees.
Landlord ↔ Tenant lean methodology
- Overall (STATE)
- 87 Strongly Landlord-Friendly
- State Texas
- 87 Strongly Landlord-Friendly · R+5
- County
- — inherits STATE
- City
- — inherits STATE
ZIP-level market 79606
- Rents YoY
- 40.7%
- Active inventory
- 288
- Price-to-rent
- 8.8×
Monthly cashflow live
- Estimated rent
- $2,574 high interval (Pro) →
- Mortgage (P&I)
- −$1,429
- Tax est. 1.5%
- −$341 /mo · $4,087/yr
- Insurance
- −$114
- HOA
- −$0
- Vacancy / Maint / Mgmt
- −$541
- Net cashflow
- $151
Break-even live
UW: 25.0% down · 7.5% · 30yr · 1.5% tax · 5.0% vac · 8.0% maint · 8.0% mgmt
Financing live
Cash to close
- Down payment
- $68,122
- Closing costs
- $8,175
- Reserves months
- —
- Total cash needed
- —
Loan-product check · same deal, 3 products live
Conventional
25% down · 7.5% · 30yr
- Down + closing
- —
- Monthly P&I
- —
- Monthly cashflow
- —
- DSCR
- —
- Eligible?
- —
Personal DTI + credit; lowest rate.
DSCR
20% down · 8.5% · 30yr
- Down + closing
- —
- Monthly P&I
- —
- Monthly cashflow
- —
- DSCR
- —
- Eligible?
- —
No personal income docs; deal must DSCR.
Hard money
10% down · 12.0% · 12mo
- Down + closing
- —
- Monthly P&I
- —
- Monthly cashflow
- —
- DSCR
- —
- Eligible?
- —
Short-term bridge; refi at stabilization.
Rent comps 9 comps
| Address | Beds | Baths | Sqft | Rent | $/sqft | DOM | Units | Dist |
|---|---|---|---|---|---|---|---|---|
| 3035 Glennster St Abilene, TX | 3.0 | 2.0 | 1457 | $2,550 | $1.75 | 13d | 1 | 0.05mi |
| 2870 Glennster St Abilene, TX | 3.0 | 2.0 | 1209 | $2,299 | $1.90 | 13d | 1 | 0.22mi |
| 2726 Roman Ln Abilene, TX | 3.0 | 2.0 | 1100 | $2,399 | $2.18 | 5d | 1 | 0.33mi |
| 2620 Roman Ln Abilene, TX | 3.0 | 2.0 | 1314 | $2,399 | $1.83 | 7d | 1 | 0.43mi |
| 2943 Journey Ln Abilene, TX | 3.0 | 2.0 | 1531 | $2,850 | $1.86 | 43d | 1 | 0.45mi |
| 5765 Abbey Rd Abilene, TX | 3.0 | 2.0 | 1546 | $2,800 | $1.81 | 43d | 1 | 0.68mi |
| 5749 Foxfire Dr Abilene, TX | 3.0 | 2.0 | 1268 | $2,995 | $2.36 | 13d | 1 | 0.78mi |
| 3302 Shelby Rd Abilene, TX | 3.0 | 2.0 | 1582 | $3,195 | $2.02 | 43d | 1 | 0.78mi |
| 3712 Kala Dr Abilene, TX | 3.0 | 2.0 | 1500 | $2,500 | $1.67 | 13d | 1 | 0.88mi |
Listing history 2 events
-
2026-02-03status Pending
-
2026-01-20$272,490 Active
ⓘ Source: listings_history table (triggers on properties + properties_extension) + one-shot
backfill from property_details.listing_events for pre-trigger history.
Nearby sold comps map
Loading sold comps map…
Walkable amenities ~0.75 mi
Loading nearby amenities…
Taxation est. · year 1
- Rental income
- $30,892
- − Mortgage interest
- −$15,264
- − Property taxes
- −$4,087
- − Insurance
- −$1,362
- − Repairs & maintenance
- −$2,471
- − Management
- −$2,471
- − Depreciation
- −$7,927
- Taxable loss
- −$2,691
- Est. tax savings @ 24.0%
- +$646
- After-tax cash flow
- $2,453/yr
For passive investors: Depreciation is non-cash, so a rental often shows a tax loss while cash-flowing — sheltering income. Rental losses are passive: they offset passive income freely, and up to $25,000/yr can offset ordinary (W-2) income if you actively participate and your MAGI is under $100k (phasing out to $0 by $150k); unused losses carry forward. On sale, claimed depreciation is recaptured at up to 25%, and gains may owe capital-gains tax (a 1031 exchange can defer both). Figures are a year-1 estimate at your 24.0% rate — not tax advice; consult a CPA.
Schools (NCES district)
- District
- Abilene ISD
- NCES district ID
- 4807440
- Math proficiency
- 32% ▼ -11.00%
- Reading proficiency
- 34% ▼ -5.00%
- Median HH income
- $39,782
- Composite
- 27.71/100
- National rank
- #6909
- State rank
- #575 of 826 in TX
Livability — Abilene
- Score
- 75/100
- State rank
- #142
- US rank
- #4037
Category grades
Schools grade is shown separately in the Schools card above.
Census & demographics
- Census place
- Abilene, TX
- County
- Taylor County · 136,672 people
- City population
- 136,672
- Metro
- Abilene, TX
- Population (ZIP)
- 29,182
- Household income
- $79,196
- Rent vs Own
- Severe rent burden
- 1181.0
Population outlook (Taylor County) Hauer SSP2
- Today (2025)
- 145,270 people
- By 2030
- 150,050 · +3.3%
- By 2040
- 159,417 · +9.7%
- By 2050
- 168,883 · +16.3%
- By 2075
- 194,436 · +33.8%
- By 2100
- 203,163 · +39.9%
Race, ethnicity, and origin ACS 2023
- Neighborhood character
- Predominantly White (69%)
- Race & ethnicity
- White 69% Hispanic / Latino 19% Two or more races 11% Black 6% Asian 4%
- Hispanic origin (detail)
- Mexican 14%
- Common ancestry
- Italian 4% Slovak 2% Serbian 1%
- Foreign-born
- 7% · Canada, Vietnam
- Languages at home
- 86% English-only · Spanish 10% Tagalog/Filipino 1% Other Indo-European 1%
Political lean MEDSL · Taylor
- 2024 margin
- Solid R (+49.8) · D 24.6% · R 74.4% · Other 1.0%
- 2008→2024 swing
- -4.2pp toward R · 2008: -45.6pp · 2024: -49.8pp
- All cycles
- 2024: R+49.8 2020: R+45.3 2016: R+51.1 2012: R+53.6 2008: R+45.6
Not yet ingested
- Civics
- —
Market trends
- HPI YoY
- ▼ -167.33%
- Current HPI
- 179.2555
- Rent YoY
- ▲ 40.73%
- Metro
- Abilene, TX
- State GDP YoY
- ▲ 3.95%
- F500 in state
- 110
Industry mix (Fortune 500 HQ in TX)
| Industry | F500 HQs | Revenue |
|---|---|---|
| Energy | 16 | $1,198B |
|
||
| Technology | 5 | $198B |
|
||
| Engineering / Construction | 4 | $72B |
|
||
| Energy Services | 3 | $60B |
|
||
| Utilities | 3 | $41B |
|
||
| Healthcare | 2 | $330B |
|
||
Price history
2 events — show timeline
- 2026-02-03 Pending — NTREIS
- 2026-01-20 Listed $272,490 NTREIS
Cash-flow waterfall
monthlySold comps — $/sqft
last 12 mo · ≤1 miLoading sold comps…