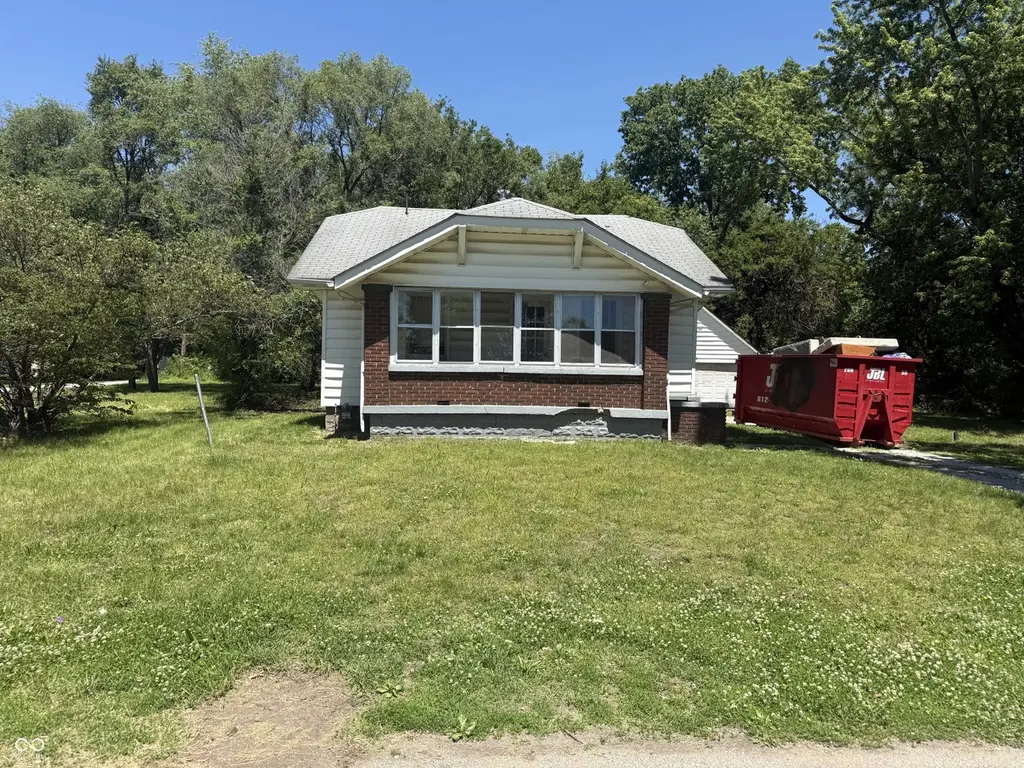
2004 E Wheeler Ave · Terre Haute, IN
Flood risk 1/10 · Minimal
- FEMA flood zone
- X (unshaded)
- Chance of flooding over 30 yrs
- 0.0%
- Est. flood insurance / yr
- $473 – $860
Fire risk 2/10 · Minimal
- Est. fire insurance / yr
- $717 – $1,331
Heat risk 4/10 · Minor
- Hot days now (above 104°F)
- 7 days/yr
- Hot days in 30 yrs
- 18 days/yr
Wind risk 2/10 · Minimal
- Chance of severe wind over 30 yrs
- 1.0%
Air-quality risk 3/10 · Minor
- Unhealthy air days now
- 2 days/yr
- Unhealthy air days in 30 yrs
- 4 days/yr
Risk factors via First Street. Map © Google.
Why this score? — see what drove the C- grade
The composite is a weighted blend of 9 inputs, each scored 0–100. Each bar is that input's sub-score; the figure is the points it added to the 100-point composite (weight × sub-score).
- Cash flow +20.5/30.0
- ARV discount +7.5/15.0
- 1% rule +6.5/10.0
- DSCR +6.5/10.0
- Livability +3.8/5.0
- Schools +2.9/10.0
- Rent growth +2.8/5.0
- Condition / age +2.5/5.0
- Appreciation +0.0/10.0
$84,999
🖨 Deal sheet 📄 Offer letter ✓ Due diligence
Key facts
- 0.64 acre lot
- 2 garage spots
- Built 1910
Property features AI
Exterior
- Parking: Detached 2-car garage (approximately 418 sq ft)
- Security: Smoke detectors
- Utilities: Public water; Municipal sewer connected
- Home design: Single-family residence; One level
- Construction: Brick and vinyl siding exterior; Block foundation
- Exterior features: Half- to one-acre lot (about 0.64 acre); Has a view
Interior
- Kitchen: Water heater (appliance listed)
- Bedrooms: 3 bedrooms on the main level
- Bathrooms: 1 full bathroom on the main level
- Heating & cooling: Forced air heating; Central air conditioning
- Interior features: Attic access; Interior-entry basement; Has basement
Neighborhood map
What this means for you Summary
Snapshot
- This is a 3-bed/1.0-bath single-family listed at $85k.
Deal economics
- At list price, monthly cash flow is $112 ($1k/yr) — positive.
- The deal already cash-flows at list — no discount required.
- Meets the 1% rule at list price ($979 rent vs $85k).
- Cap rate 7.9% vs local median 4.7% in Terre Haute — top-decile yield for the area; either an underpriced asset or a hidden risk that comps aren't pricing in. Stress-test before assuming the spread holds.
Location & tenants
- Location reads 75/100 on livability (#63 in IN, #4,186 nationally) — a middle-class / working-renter tenant base. Strengths: cost of living A+, housing A+, health & safety A+; Watch: schools D-, crime F, employment F.
- Vigo County School Corporation (urban): math 32% / reading 37% proficiency, ranked #202 of 301 in IN (top 67%) — families likely to look elsewhere, expect single-tenant / working-renter base with shorter leases.
- Market conditions: Rents rising (+1.2%/yr); 187 active listings in the ZIP; 4 comparable units currently listed for rent nearby; rentals lingering (median 44d on market — plan ~5-8 weeks vacancy on turnover, expect pricing pressure); 100% of comp listings sitting > 30 days — soft ceiling on asking rent; 60 units permitted in Vigo County in 2024 (0 in 5+ unit buildings).
Forward outlook
- Local home prices are declining (-3.0%/yr); year-one equity from $587 of loan paydown is wiped out by about $3k of value loss. Plan a longer hold.
- Vigo County population projected to shrink 5% by 2050 — rents likely to lag national; underwrite the cash flow, not the appreciation.
Negotiation context
- Only 14 days on market — expect competitive offers; lowballing is unlikely to land.
Risks & watch-outs
- Watch-outs: property tax is 2.5% of price; built in 1910 — expect roof / HVAC / electrical / plumbing capex.
Questions for the listing agent
- Built in 1910 — when were the roof, HVAC, electrical panel, plumbing, and water heater last replaced?
- Property tax is high relative to price — has the assessment been appealed recently, and will the sale trigger a re-assessment?
- Is there a deadline driving the sale (1031 exchange, divorce, estate, relocation)? That informs how much negotiation room exists.
- Schools are D-rated, which usually means shorter tenancies and higher turnover. Who's the typical renter profile here, and what's been the actual vacancy rate?
- Crime grade is F in this area — have there been break-ins, vandalism, or insurance claims at this property in the last 3 years? What carrier currently insures it and at what premium?
- What's the average days-on-market for RENTAL listings here right now (not sales)? A rising rental-DOM trend means longer vacancies and softer asking-rent achievability than the comps imply.
- What's the recent tenant-quality profile in this submarket — average credit score on applications, eviction rate, late-payment / NSF rate, and stable-employment percentage? A property-management company in the area should have these aggregated.
- How much new for-sale + rental construction is in the pipeline within 1–3 miles? Heavy new supply typically softens prices + rents 12–24 months out; constrained supply supports both.
Investment metrics
- 1% rule
- 1.15% ✓
- Cap rate
- 7.87%
- Cash-on-cash
- 5.65%
- DSCR
- 1.25
- GRM
- 7.2
CMA / ARV
- ARV (on-the-fly)
- $187,110
- Comps found
- 12
Show comp detail 12 sales within ~0.75 mi
| Address | Dist | Beds/Ba | Sqft | Sold | Price | $/sf | Match |
|---|---|---|---|---|---|---|---|
| 2510 Kings Ct | 0.13mi | 3/2.0 | 1,158 (+2%) | 4mo | $194,622 | $168 | 83 |
| 2447 Kings Ct | 0.18mi | 3/2.0 | 1,168 (+3%) | 0mo | $203,000 | $174 | 82 |
| 2391 Kings Ct | 0.23mi | 3/2.0 | 1,168 (+3%) | 9mo | $200,000 | $171 | 73 |
| 2939 S 13th St | 0.60mi | 2/1.0 (-1) | 1,144 (+1%) | 2mo | $109,900 | $96 | 64 |
| 3123 S 21st St | 0.29mi | 3/1.0 | 1,000 (-12%) | 6mo | $195,000 | $195 | 62 |
| 1903 Grant St | 0.53mi | 3/1.0 | 1,120 (-1%) | 14mo | $105,000 | $94 | 62 |
| 2020 Morton St | 0.44mi | 3/1.5 | 1,230 (+8%) | 3mo | $162,500 | $132 | 61 |
| 2259 Morton St | 0.43mi | 2/2.0 (-1) | 1,216 (+7%) | 0mo | $206,400 | $170 | 58 |
| 1158 Helen Ave | 0.65mi | 2/1.0 (-1) | 1,200 (+6%) | 1mo | $23,500 | $20 | 54 |
| 1941 S 21st St | 0.64mi | 3/1.0 | 1,208 (+6%) | 7mo | $153,000 | $127 | 54 |
| 2716 S 26th St | 0.51mi | 2/1.0 (-1) | 1,103 (-3%) | 18mo | $60,000 | $54 | 51 |
| 1908 S 23rd St | 0.73mi | 2/2.0 (-1) | 1,072 (-6%) | 0mo | $176,852 | $165 | 48 |
Match score weights: distance 35% · size 25% · config 20% · recency 20%. Top-matched comps best support the ARV.
Projected returns pro-forma
-3.0% appreciation · 1.23% rent growth · sell at horizon
- IRR
- -9.7%
- Equity multiple
- 0.65×
- Total profit
- $-8,295
- Equity at exit
- $12,674
- IRR
- -3.1%
- Equity multiple
- 0.81×
- Total profit
- $-4,581
- Equity at exit
- $7,349
Cash invested: $23,800 (down + closing). Projections, not guarantees.
Landlord ↔ Tenant lean methodology
- Overall (STATE)
- 90 Strongly Landlord-Friendly
- State Indiana
- 90 Strongly Landlord-Friendly · R+11
- County
- — inherits STATE
- City
- — inherits STATE
ZIP-level market 47802
- Home prices YoY
- -26.8%
- Rents YoY
- 1.2%
- Active inventory
- 187
- Price-to-rent
- 7.2×
Monthly cashflow live
- Estimated rent
- $979 medium interval (Pro) →
- Mortgage (P&I)
- −$446
- Tax from tax record
- −$180 /mo · $2,162/yr
- Insurance
- −$35
- HOA
- −$0
- Vacancy / Maint / Mgmt
- −$206
- Net cashflow
- $112
Break-even live
UW: 25.0% down · 7.5% · 30yr · 1.5% tax · 5.0% vac · 8.0% maint · 8.0% mgmt
Financing live
Cash to close
- Down payment
- $21,250
- Closing costs
- $2,550
- Reserves months
- —
- Total cash needed
- —
Loan-product check · same deal, 3 products live
Conventional
25% down · 7.5% · 30yr
- Down + closing
- —
- Monthly P&I
- —
- Monthly cashflow
- —
- DSCR
- —
- Eligible?
- —
Personal DTI + credit; lowest rate.
DSCR
20% down · 8.5% · 30yr
- Down + closing
- —
- Monthly P&I
- —
- Monthly cashflow
- —
- DSCR
- —
- Eligible?
- —
No personal income docs; deal must DSCR.
Hard money
10% down · 12.0% · 12mo
- Down + closing
- —
- Monthly P&I
- —
- Monthly cashflow
- —
- DSCR
- —
- Eligible?
- —
Short-term bridge; refi at stabilization.
Rent comps 4 comps
| Address | Beds | Baths | Sqft | Rent | $/sqft | DOM | Units | Dist |
|---|---|---|---|---|---|---|---|---|
| 2440 S 11th St Terre Haute, IN | 2.0 | 1.0 | 800 | $1,000 | $1.25 | 43d | 1 | 0.82mi |
| 1320 S 19th St Terre Haute, IN | 2.0 | 1.0 | 830 | $700 | $0.84 | 43d | 1 | 1.18mi |
| 1611 S 7th St Apt 4 Terre Haute, IN | 2.0 | 1.0 | 1022 | $795 | $0.78 | 43d | 1 | 1.40mi |
| 4258 S Kian St Terre Haute, IN | 2.0 | 1.0 | 850 | $795 | $0.94 | 43d | 1 | 1.44mi |
Listing history 6 events
-
2026-06-05statusdays on market $84,999 Pending 14 DOM
-
2026-06-02days on market $84,999 Active 13 DOM
-
2026-06-01days on market $84,999 Active 12 DOM
-
2026-05-31days on market $84,999 Active 11 DOM
-
2026-05-30days on market $84,999 Active 10 DOM
-
2026-05-20$89,999 Active
ⓘ Source: listings_history table (triggers on properties + properties_extension) + one-shot
backfill from property_details.listing_events for pre-trigger history.
Tax reassessment forecast IN · Partial reset (capped growth)
- Current annual tax
- $2,162 · $180/mo
- Projected year-2 tax
- $2,162 · $180/mo
- Expected delta
- $0/yr ($0/mo · 0.0%)
ⓘ Screening estimate from a state-policy table — verify with the county assessor before closing.
Climate risk First Street
- Flood 1/10 Low FEMA zone X (unshaded) · 0% chance over 30 yrs
- Wildfire 2/10 Low
- Heat 4/10 Moderate 7 d/yr ≥104°F today · 18 d/yr by 30 yrs out
- Wind 2/10 Low 100% chance of damaging wind over 30 yrs
- Air quality 3/10 Moderate 2 unhealthy d/yr today · 4 by 30 yrs out
Nearby sold comps map
Loading sold comps map…
Walkable amenities ~0.75 mi
Loading nearby amenities…
Taxation est. · year 1
- Rental income
- $11,746
- − Mortgage interest
- −$4,761
- − Property taxes
- −$2,162
- − Insurance
- −$425
- − Repairs & maintenance
- −$940
- − Management
- −$940
- − Depreciation
- −$2,473
- Taxable income
- $46
- Est. tax owed @ 24.0%
- −$11
- After-tax cash flow
- $1,333/yr
For passive investors: Depreciation is non-cash, so a rental often shows a tax loss while cash-flowing — sheltering income. Rental losses are passive: they offset passive income freely, and up to $25,000/yr can offset ordinary (W-2) income if you actively participate and your MAGI is under $100k (phasing out to $0 by $150k); unused losses carry forward. On sale, claimed depreciation is recaptured at up to 25%, and gains may owe capital-gains tax (a 1031 exchange can defer both). Figures are a year-1 estimate at your 24.0% rate — not tax advice; consult a CPA.
Schools (NCES district)
- District
- Vigo County School Corporation
- NCES district ID
- 1812090
- Math proficiency
- 32% ▼ -10.00%
- Reading proficiency
- 37% ▼ -8.00%
- Median HH income
- $40,100
- Composite
- 28.97/100
- National rank
- #6625
- State rank
- #202 of 301 in IN
Livability — Terre Haute
- Score
- 75/100
- State rank
- #63
- US rank
- #4186
Category grades
Schools grade is shown separately in the Schools card above.
Census & demographics
- Census place
- Terre Haute, IN
- County
- Vigo County · 91,193 people
- City population
- 91,193
- Metro
- Terre Haute, IN
- Population (ZIP)
- 33,135
- Household income
- $57,395
- Rent vs Own
- Severe rent burden
- 1102.0
Population outlook (Vigo County) Hauer SSP2
- Today (2025)
- 106,366 people
- By 2030
- 105,674 · -0.7%
- By 2040
- 103,731 · -2.5%
- By 2050
- 101,200 · -4.9%
- By 2075
- 95,674 · -10.1%
- By 2100
- 85,910 · -19.2%
Race, ethnicity, and origin ACS 2023
- Neighborhood character
- Predominantly White (82%)
- Race & ethnicity
- White 82% Black 8% Two or more races 5% Hispanic / Latino 3% Asian 3%
- Common ancestry
- Lithuanian 3% Slovak 2% Serbian 2%
- Foreign-born
- 3% · China, Canada
- Languages at home
- 96% English-only · Spanish 1% Other Indo-European 1% Chinese 1%
Political lean MEDSL · Vigo
- 2024 margin
- R (+18.1) · D 40.0% · R 58.1% · Other 2.0%
- 2008→2024 swing
- -33.9pp toward R · 2008: 15.8pp · 2024: -18.1pp
- All cycles
- 2024: R+18.1 2020: R+14.7 2016: R+15.2 2012: D+0.8 2008: D+15.8
Not yet ingested
- Civics
- —
Market trends
- HPI YoY
- ▼ -67.05%
- Current HPI
- 183.0194
- Rent YoY
- ▲ 1.23%
- Metro
- Terre Haute, IN
- State GDP YoY
- ▲ 2.90%
- F500 in state
- 18
Industry mix (Fortune 500 HQ in IN)
| Industry | F500 HQs | Revenue |
|---|---|---|
| Industrial Machinery | 2 | $37B |
|
||
| Healthcare | 1 | $177B |
|
||
| Pharmaceuticals | 1 | $45B |
|
||
| Metals / Steel | 1 | $18B |
|
||
| Agriculture | 1 | $17B |
|
||
| Packaging | 1 | $12B |
|
||
Price history
1 event — show timeline
- 2026-05-20 Listed $89,999 MIBOR as Distributed by MLS Grid
Property tax history
+6.0%/yrLatest (2024): $2,162 · +3.3% YoY. Source: county tax records.
Cash-flow waterfall
monthlySold comps — $/sqft
last 12 mo · ≤1 miLoading sold comps…