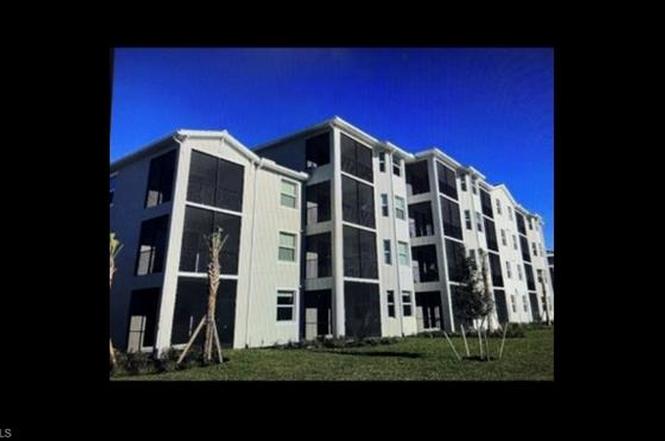
6034 National Blvd · Ave Maria, FL
Flood risk 3/10 · Minor
- FEMA flood zone
- AH
- Chance of flooding over 30 yrs
- 0.2%
- Est. flood insurance / yr
- $1,142 – $2,507
Fire risk 5/10 · Moderate
- Est. fire insurance / yr
- $947 – $1,759
Heat risk 9/10 · Severe
- Hot days now (above 112°F)
- 6 days/yr
- Hot days in 30 yrs
- 23 days/yr
Wind risk 10/10 · Severe
- Chance of severe wind over 30 yrs
- 99.0%
Air-quality risk 2/10 · Minimal
- Unhealthy air days now
- 0 days/yr
- Unhealthy air days in 30 yrs
- 1 days/yr
Risk factors via First Street. Map © Google.
Why this score? — see what drove the C+ grade
The composite is a weighted blend of 9 inputs, each scored 0–100. Each bar is that input's sub-score; the figure is the points it added to the 100-point composite (weight × sub-score).
- Cash flow +25.9/30.0
- DSCR +8.7/10.0
- 1% rule +6.8/10.0
- ARV discount +5.3/15.0
- Schools +5.0/10.0
- Appreciation +4.5/10.0
- Rent growth +3.2/5.0
- Livability +2.5/5.0
- Condition / age +2.5/5.0
$320,000
🖨 Deal sheet 📄 Offer letter ✓ Due diligence
Listing remarks
THE NATIONAL BLVD APARTMENT FOR SALE PIKLEBALL COURT, SPA, GOLF COURSE, GYM, POOL, AND SO MANY MORE AMENITIES. YOU DON'T WANT TO MISS OUT ON THIS BEAUTIFUL APARTEMENT, EVERYTHING IS IN GREAT CONDITION.
Key facts
- Pikleball court
- Spa
- Gym
Tags
Property features AI
Finance
- Other: No RV allowed (restrictions); Possession at closing
- Financial info: Unit is one of 61 in the complex and 25 in the building; single-floor unit; Taxes and other assessed financial details not included
- HOA & community: Mandatory condo association (Condo management); HOA maintenance includes cable, golf course, internet/Wi‑Fi, lawn/land maintenance, manager, repairs, and water; Community amenities: beauty salon, bike and jog paths, community park, community pool, attended fitness center, full service spa, golf course (golf-bundled), pickleball, play area, private membership, restaurant, sauna, shopping, sidewalks, and tennis courts; Community type: Condo/Hotel, gated, golf course community
Exterior
- Parking: Detached garage (1 car); Detached carport (1 car)
- Security: Gated community with guard at gate and patrolled security
- Utilities: Filtered water; Sewer assessment paid; Natural gas available; Cable available; Electric service for pool/spa
- Home design: Residential low-rise (1–3 stories); Built in 2022; Concrete block construction; Rear exposure faces west; Located in the Ave Maria development
- Construction: Concrete block construction; Tile roof; Brick exterior; Built in 2022; Foundation details not specified
- Exterior features: Courtyard; Patio; Impact-resistant windows; Impact storm protection; Brick exterior finish; Heated indoor private spa (electric); Below-ground private pool; Golf course frontage; Lake frontage; Landscaped views; Central irrigation
Interior
- Kitchen: Island; Electric cooktop; Freezer; Microwave; Refrigerator
- Bedrooms: 2 bedrooms (one on the first floor; split-bedroom floor plan)
- Flooring: Tile
- Bathrooms: 2 full bathrooms; Master bathroom with shower only
- Heating & cooling: Natural gas heating; Central electric air conditioning; Ceiling fans
- Interior features: Built-in cabinets; High-speed internet available; Island kitchen layout; Dining area adjacent to family and living spaces; Family room; Common elevator access; Furnished; 3 ceiling fans
- Laundry & utility: Washer/dryer hookup
Neighborhood map
What this means for you Summary
Snapshot
- This is a 2-bed/2.0-bath townhouse listed at $320k.
Deal economics
- At list price, monthly cash flow is $631 ($8k/yr) — positive.
- The deal already cash-flows at list — no discount required.
- Meets the 1% rule at list price ($4k rent vs $320k).
- Recommended offer: $282k (12.0% below list) — sets the bar for market timing.
Location & tenants
- Location reads: area grade C — affects rentability + tenant quality, not the cash-flow math above.
- Collier (suburban): math 60% / reading 56% proficiency, ranked #16 of 73 in FL (top 22%) — acceptable for families but not a draw, mixed tenant base, ~2y average lease.
- Market conditions: Rents rising (+3.0%/yr); 449 active listings in the ZIP; 40 comparable units currently listed for rent nearby; rentals at typical pace (median 23d on market — plan ~3-4 weeks tenant-placement turnaround); 3,520 units permitted in Collier County in 2024 (959 in 5+ unit buildings).
- At $3,791/mo this rent would consume 73% of the median local household income ($62k/yr) (locally 1093% of renters already pay >50% of income on rent) — very limited rent-growth headroom before tenants either downsize or default.
Forward outlook
- Local home prices are declining (-1.1%/yr); year-one equity from $2k of loan paydown is wiped out by about $3k of value loss. Plan a longer hold.
- Collier County population projected at +30% by 2050 — long-run rental-demand tailwind backs the buy-and-hold thesis.
- At projected returns (-1.1% appreciation + 3.0% rent growth), your $90k cash investment doubles in ~9 years — after that, you're playing with house money.
Negotiation context
- It's been on market 288 days — a 12% lower offer ($282k) is reasonable based on typical stale-listing flexibility.
- 13 sale attempts since 3y ago; this cycle's ask is 10584% above the opening price — seller raised mid-cycle; expect resistance to lowballs.
Risks & watch-outs
- Watch-outs: flood insurance adds $152/mo.
- Climate carrying-cost: in FEMA flood zone AH (mandatory federal flood insurance); severe wind risk, 99% chance of damaging wind over 30y; moderate wildfire risk; extreme-heat days projected 6→23/yr by 2055 (HVAC capex compounding) — expect insurance premiums to compound above CPI over the hold.
Questions for the listing agent
- It's been on market 288 days. Have you received any prior offers? Is the seller open to a 12% concession, seller financing, or rate buy-down credit?
- What's the actual annual flood-insurance premium (NFIP or private), and is the property in a SFHA with mandatory coverage?
- Why hasn't it sold? Are there any deal-killer items the seller is aware of (foundation, flood, title, zoning, code violations)?
- Is there a deadline driving the sale (1031 exchange, divorce, estate, relocation)? That informs how much negotiation room exists.
- What's the average days-on-market for RENTAL listings here right now (not sales)? A rising rental-DOM trend means longer vacancies and softer asking-rent achievability than the comps imply.
- What's the recent tenant-quality profile in this submarket — average credit score on applications, eviction rate, late-payment / NSF rate, and stable-employment percentage? A property-management company in the area should have these aggregated.
- How much new for-sale + rental construction is in the pipeline within 1–3 miles? Heavy new supply typically softens prices + rents 12–24 months out; constrained supply supports both.
Investment metrics
- 1% rule
- 1.18% ✓
- Cap rate
- 9.23%
- Cash-on-cash
- 10.49%
- DSCR
- 1.47
- GRM
- 7.0
CMA / ARV
- ARV (on-the-fly)
- $305,080
- Comps found
- 1
Show comp detail 1 sale within ~0.75 mi
| Address | Dist | Beds/Ba | Sqft | Sold | Price | $/sf | Match |
|---|---|---|---|---|---|---|---|
| 5555 Double Eagle Cir #3935 | 0.58mi | 2/2.0 | 1,120 (-3%) | 1mo | $295,000 | $263 | 66 |
Match score weights: distance 35% · size 25% · config 20% · recency 20%. Top-matched comps best support the ARV.
Projected returns pro-forma
-1.05% appreciation · 2.95% rent growth · sell at horizon
- IRR
- 3.9%
- Equity multiple
- 1.17×
- Total profit
- $15,382
- Equity at exit
- $76,504
- IRR
- 10.4%
- Equity multiple
- 2.01×
- Total profit
- $90,354
- Equity at exit
- $79,706
Cash invested: $89,600 (down + closing). Projections, not guarantees.
Landlord ↔ Tenant lean methodology
- Overall (STATE)
- 87 Strongly Landlord-Friendly
- State Florida
- 87 Strongly Landlord-Friendly · R+3
- County
- — inherits STATE
- City
- — inherits STATE
ZIP-level market 34142
- Home prices YoY
- -0.5%
- Rents YoY
- 3.0%
- Active inventory
- 449
- Price-to-rent
- 7.0×
Monthly cashflow live
- Estimated rent
- $3,791 high interval (Pro) →
- Mortgage (P&I)
- −$1,678
- Tax est. 1.5%
- −$400 /mo · $4,800/yr
- Insurance
- −$133
- Flood insurance flood zone
- −$152 /mo · $1,824/yr
- HOA
- −$0
- Vacancy / Maint / Mgmt
- −$796
- Net cashflow
- $631
Break-even live
UW: 25.0% down · 7.5% · 30yr · 1.5% tax · 5.0% vac · 8.0% maint · 8.0% mgmt
Financing live
Cash to close
- Down payment
- $80,000
- Closing costs
- $9,600
- Reserves months
- —
- Total cash needed
- —
Loan-product check · same deal, 3 products live
Conventional
25% down · 7.5% · 30yr
- Down + closing
- —
- Monthly P&I
- —
- Monthly cashflow
- —
- DSCR
- —
- Eligible?
- —
Personal DTI + credit; lowest rate.
DSCR
20% down · 8.5% · 30yr
- Down + closing
- —
- Monthly P&I
- —
- Monthly cashflow
- —
- DSCR
- —
- Eligible?
- —
No personal income docs; deal must DSCR.
Hard money
10% down · 12.0% · 12mo
- Down + closing
- —
- Monthly P&I
- —
- Monthly cashflow
- —
- DSCR
- —
- Eligible?
- —
Short-term bridge; refi at stabilization.
Rent comps 40 comps
| Address | Beds | Baths | Sqft | Rent | $/sqft | DOM | Units | Dist |
|---|---|---|---|---|---|---|---|---|
| 6034 National Blvd Ave Maria, FL | 2.0 | 2.0 | 1137 | $4,046 | $3.56 | 13d | 3 | 0.03mi |
| 6046 National Blvd Ave Maria, FL | 2.0 | 2.0 | 1154 | $4,395 | $3.81 | 23d | 2 | 0.03mi |
| 6058 National Blvd #343 Ave Maria, FL | 2.0 | 2.0 | 1194 | $4,000 | $3.35 | 23d | 1 | 0.07mi |
| 6058 National Blvd #335 Ave Maria, FL | 2.0 | 2.0 | 1120 | $5,795 | $5.17 | 13d | 1 | 0.08mi |
| 6058 National Blvd Ave Maria, FL | 2.0–3.0 | 2.0 | 1210 | $2,995 | $2.47 | 23d | 2 | 0.08mi |
| 6082 National Blvd Ave Maria, FL | 2.0 | 2.0 | 1366 | $4,145 | $3.03 | 23d | 2 | 0.18mi |
| 5410 Double Eagle Cir #2222 Ave Maria, FL | 2.0 | 2.0 | 1355 | $2,395 | $1.77 | 23d | 1 | 0.25mi |
| 5807 Double Eagle Cir #4631 Ave Maria, FL | 3.0 | 2.0 | 1301 | $5,695 | $4.38 | 23d | 1 | 0.26mi |
| 5835 Double Eagle Cir Unit 4742 Ave Maria, FL | 2.0 | 2.0 | 1154 | $5,795 | $5.02 | 23d | 1 | 0.26mi |
| 5428 Double Eagle Cir #2517 Ave Maria, FL | 2.0 | 2.0 | 1355 | $2,695 | $1.99 | 23d | 1 | 0.27mi |
| 6047 Ellerston Way Unit 1 Ave Maria, FL | 2.0 | 2.0 | 1366 | $2,500 | $1.83 | 23d | 1 | 0.29mi |
| 5835 Double Eagle CIR #4714 Ave Maria, FL | 2.0 | 2.0 | 1120 | $1,895 | $1.69 | 23d | 1 | 0.31mi |
| 5629 Double Eagle Cir #4217 Ave Maria, FL | 2.0 | 2.0 | 1154 | $5,795 | $5.02 | 23d | 1 | 0.31mi |
| 6039 Ellerston WAY #2017 Ave Maria, FL | 2.0 | 2.0 | 1355 | $6,295 | $4.65 | 23d | 1 | 0.31mi |
| 5651 Double Eagle Cir #4316 Ave Maria, FL | 2.0 | 2.0 | 1154 | $5,495 | $4.76 | 23d | 1 | 0.31mi |
| 5629 Double Eagle Cir #4218 Ave Maria, FL | 3.0 | 2.0 | 1301 | $6,295 | $4.84 | 23d | 1 | 0.31mi |
| 5651 Double Eagle Cir #4338 Ave Maria, FL | 2.0 | 2.0 | 1301 | $6,295 | $4.84 | 23d | 1 | 0.31mi |
| 5835 Double Eagle Cir #4726 Ave Maria, FL | 2.0 | 2.0 | 1154 | $2,095 | $1.82 | 13d | 1 | 0.31mi |
| 5629 Double Eagle Cir #4223 Ave Maria, FL | 2.0 | 2.0 | 1154 | $2,395 | $2.08 | 23d | 1 | 0.31mi |
| 5715 Double Eagle Cir #4416 Ave Maria, FL | 2.0 | 2.0 | 1154 | $2,100 | $1.82 | 23d | 1 | 0.31mi |
| 5427 Double Eagle Cir Ave Maria, FL | 2.0 | 2.0 | 1355 | $2,995 | $2.21 | 23d | 1 | 0.32mi |
| 5427 Double Eagle Cir #2812 Ave Maria, FL | 2.0 | 2.0 | 1355 | $2,395 | $1.77 | 13d | 1 | 0.32mi |
| 5433 Double Eagle Cir #2915 Ave Maria, FL | 2.0 | 2.0 | 1366 | $6,295 | $4.61 | 21d | 1 | 0.35mi |
| 5433 Double Eagle Cir Ave Maria, FL | 2.0 | 2.0 | 1366 | $3,295 | $2.41 | 23d | 1 | 0.36mi |
| 5835 Double Eagle Cir Ave Maria, FL | 2.0 | 2.0 | 1154 | $5,495 | $4.76 | 23d | 1 | 0.38mi |
| 5478 Double Eagle Cir #3515 Ave Maria, FL | 2.0 | 2.0 | 1355 | $2,395 | $1.77 | 23d | 1 | 0.39mi |
| 5807 Double Eagle Cir #4635 Ave Maria, FL | 2.0 | 2.0 | 1120 | $5,195 | $4.64 | 23d | 1 | 0.42mi |
| 5807 Double Eagle Cir Ave Maria, FL | 3.0 | 2.0 | 1301 | $2,995 | $2.30 | 23d | 1 | 0.43mi |
| 5807 Double Eagle Cir #4621 Ave Maria, FL | 3.0 | 2.0 | 1301 | $6,295 | $4.84 | 23d | 1 | 0.43mi |
| 5466 Double Eagle Cir #3425 Ave Maria, FL | 2.0 | 2.0 | 1355 | $5,995 | $4.42 | 23d | 1 | 0.44mi |
| 5749 Double Eagle Cir #4528 Ave Maria, FL | 3.0 | 2.0 | 1301 | $6,295 | $4.84 | 21d | 1 | 0.47mi |
| 5749 Double Eagle Cir #4515 Ave Maria, FL | 2.0 | 2.0 | 1120 | $1,995 | $1.78 | 21d | 1 | 0.47mi |
| 5749 Double Eagle Cir #4537 Ave Maria, FL | 2.0 | 2.0 | 1154 | $2,100 | $1.82 | 21d | 1 | 0.47mi |
| 5749 Double Eagle Cir Ave Maria, FL | 3.0 | 2.0 | 1301 | $2,995 | $2.30 | 23d | 1 | 0.47mi |
| 5715 Double Eagle Cir #4432 Ave Maria, FL | 2.0 | 2.0 | 1154 | $5,795 | $5.02 | 21d | 1 | 0.48mi |
| 5715 Double Eagle Cir #4413 Ave Maria, FL | 2.0 | 2.0 | 1154 | $5,495 | $4.76 | 21d | 1 | 0.48mi |
| 5715 Double Eagle Cir Ave Maria, FL | 2.0 | 2.0 | 1120 | $3,295 | $2.94 | 23d | 1 | 0.50mi |
| 5454 Double Eagle Cir #3325 Ave Maria, FL | 2.0 | 2.0 | 1355 | $2,495 | $1.84 | 23d | 1 | 0.50mi |
| 5479 Double Eagle Cir #3626 Ave Maria, FL | 2.0 | 2.0 | 1154 | $2,200 | $1.91 | 13d | 1 | 0.51mi |
| 5491 Double Eagle Cir #3728 Ave Maria, FL | 3.0 | 2.0 | 1301 | $2,195 | $1.69 | 13d | 1 | 0.53mi |
Listing history 10 events
-
2026-06-18days on market $320,000 Active 288 DOM
-
2026-06-17days on market $320,000 Active 287 DOM
-
2026-06-16days on market $320,000 Active 286 DOM
-
2026-06-15days on market $320,000 Active 285 DOM
-
2026-06-10days on market $320,000 Active 280 DOM
-
2026-06-09days on market $320,000 Active 279 DOM
-
2026-06-08days on market $320,000 Active 278 DOM
-
2026-06-07days on market $320,000 Active 277 DOM
-
2026-06-03remarks 201-char remark
-
2026-06-03$320,000 Active 272 DOM
ⓘ Source: listings_history table (triggers on properties + properties_extension) + one-shot
backfill from property_details.listing_events for pre-trigger history.
Climate risk First Street
- Flood 3/10 Moderate FEMA zone AH · 20% chance over 30 yrs
- Wildfire 5/10 Major
- Heat 9/10 Extreme 6 d/yr ≥112°F today · 23 d/yr by 30 yrs out
- Wind 10/10 Extreme 99% chance of damaging wind over 30 yrs
- Air quality 2/10 Low 0 unhealthy d/yr today · 1 by 30 yrs out
Nearby sold comps map
Loading sold comps map…
Walkable amenities ~0.75 mi
Loading nearby amenities…
Taxation est. · year 1
- Rental income
- $45,492
- − Mortgage interest
- −$17,925
- − Property taxes
- −$4,800
- − Insurance
- −$3,424
- − Repairs & maintenance
- −$3,639
- − Management
- −$3,639
- − Depreciation
- −$9,309
- Taxable income
- $2,754
- Est. tax owed @ 24.0%
- −$661
- After-tax cash flow
- $6,915/yr
For passive investors: Depreciation is non-cash, so a rental often shows a tax loss while cash-flowing — sheltering income. Rental losses are passive: they offset passive income freely, and up to $25,000/yr can offset ordinary (W-2) income if you actively participate and your MAGI is under $100k (phasing out to $0 by $150k); unused losses carry forward. On sale, claimed depreciation is recaptured at up to 25%, and gains may owe capital-gains tax (a 1031 exchange can defer both). Figures are a year-1 estimate at your 24.0% rate — not tax advice; consult a CPA.
Schools (NCES district)
- District
- Collier
- NCES district ID
- 1200330
- Math proficiency
- 60% ▼ -4.00%
- Reading proficiency
- 56% ▼ -2.00%
- Median HH income
- $58,275
- Composite
- 50.23/100
- National rank
- #1892
- State rank
- #16 of 73 in FL
Livability — Ave Maria
No livability data for this city. (Only ~50 U.S. cities are tracked.)
Census & demographics
- Census place
- Ave Maria, FL
- County
- Collier County · 396,295 people
- Metro
- Naples-Marco Island, FL
- Population (ZIP)
- 35,149
- Household income
- $62,333
- Rent vs Own
- Severe rent burden
- 1093.0
Population outlook (Collier County) Hauer SSP2
- Today (2025)
- 420,858 people
- By 2030
- 450,054 · +6.9%
- By 2040
- 502,232 · +19.3%
- By 2050
- 544,932 · +29.5%
- By 2075
- 627,203 · +49.0%
- By 2100
- 659,015 · +56.6%
Race, ethnicity, and origin ACS 2023
- Neighborhood character
- Majority Hispanic (63%)
- Race & ethnicity
- Hispanic / Latino 63% Two or more races 39% Black 19% White 16% Native American 7%
- Hispanic origin (detail)
- Mexican 43% Puerto Rican 3% Cuban 2% Dominican 1%
- Common ancestry
- Hispanic 8% Slovak 1% Serbian 1%
- Foreign-born
- 32% · Canada, Jamaica
- Languages at home
- 34% English-only · Spanish 53% French/Haitian/Cajun 12%
Political lean MEDSL · Collier
- 2024 margin
- Solid R (+33.1) · D 33.1% · R 66.2%
- 2008→2024 swing
- -10.6pp toward R · 2008: -22.5pp · 2024: -33.1pp
- All cycles
- 2024: R+33.1 2020: R+24.7 2016: R+26.0 2012: R+30.1 2008: R+22.5
Not yet ingested
- Civics
- —
Market trends
- HPI YoY
- ▼ -1.05%
- Current HPI
- 226.9105
- Rent YoY
- ▲ 2.95%
- Metro
- Naples-Marco Island, FL
- State GDP YoY
- ▲ 3.28%
- F500 in state
- 36
Industry mix (Fortune 500 HQ in FL)
| Industry | F500 HQs | Revenue |
|---|---|---|
| Industrial Technology | 2 | $29B |
|
||
| Insurance | 2 | $17B |
|
||
| Retail | 1 | $60B |
|
||
| Technology Distribution | 1 | $58B |
|
||
| Homebuilding | 1 | $35B |
|
||
| Technology Manufacturing | 1 | $35B |
|
||
Price history
+0.0% since first listed23 events — show timeline
- 2025-10-05 Listed for Rent $2,995 BUILDIUM
- 2025-09-03 Listed $320,000 NAPLESMLS
- 2025-07-30 Listed for Rent $2,995 BUILDIUM
- 2025-03-13 Rental Removed $2,995 BUILDIUM
- 2025-03-13 Listed for Rent $2,995 BUILDIUM
- 2025-03-03 Rental Removed $2,995 BUILDIUM
- 2025-03-02 Listed for Rent $2,995 BUILDIUM
- 2024-08-24 Rental Removed $2,995 BUILDIUM
- 2024-08-24 Rental Removed $2,995 BUILDIUM
- 2024-08-24 Listed for Rent $2,995 BUILDIUM
- 2024-08-24 Listed for Rent $2,995 BUILDIUM
- 2024-08-01 Rental Removed $2,995 BUILDIUM
- 2024-08-01 Listed for Rent $2,995 BUILDIUM
- 2024-07-18 Rental Removed $2,995 BUILDIUM
- 2024-07-18 Rental Removed $2,995 BUILDIUM
- 2024-07-18 Listed for Rent $2,995 BUILDIUM
- 2024-07-18 Listed for Rent $2,995 BUILDIUM
- 2024-05-09 Rental Removed $2,995 BUILDIUM
- 2024-04-28 Listed for Rent $2,995 BUILDIUM
- 2023-08-30 Rental Removed — BUILDIUM
- 2023-08-29 Listed for Rent — BUILDIUM
- 2023-07-17 Rental Removed — BUILDIUM
- 2023-07-16 Listed for Rent — BUILDIUM
Cash-flow waterfall
monthlySold comps — $/sqft
last 12 mo · ≤1 miLoading sold comps…