129 Birch Ln · Millerton, NY
Flood risk 1/10 · Minimal
- FEMA flood zone
- X
- Chance of flooding over 30 yrs
- 0.0%
- Est. flood insurance / yr
- $507 – $1,088
Fire risk 4/10 · Minor
- Est. fire insurance / yr
- $691 – $1,283
Heat risk 2/10 · Minimal
- Hot days now (above 93°F)
- 7 days/yr
- Hot days in 30 yrs
- 15 days/yr
Wind risk 4/10 · Minor
- Chance of severe wind over 30 yrs
- 11.0%
Air-quality risk 2/10 · Minimal
- Unhealthy air days now
- 1 days/yr
- Unhealthy air days in 30 yrs
- 2 days/yr
Risk factors via First Street. Map © Google.
Why this score? — see what drove the C grade
The composite is a weighted blend of 9 inputs, each scored 0–100. Each bar is that input's sub-score; the figure is the points it added to the 100-point composite (weight × sub-score).
- Cash flow +18.2/30.0
- Appreciation +10.0/10.0
- ARV discount +7.5/15.0
- DSCR +5.7/10.0
- 1% rule +4.2/10.0
- Schools +3.9/10.0
- Livability +3.4/5.0
- Rent growth +2.5/5.0
- Condition / age +2.5/5.0
$239,000
🖨 Deal sheet (PDF) 📄 Offer letter ✓ Due diligence
Listing remarks MLS
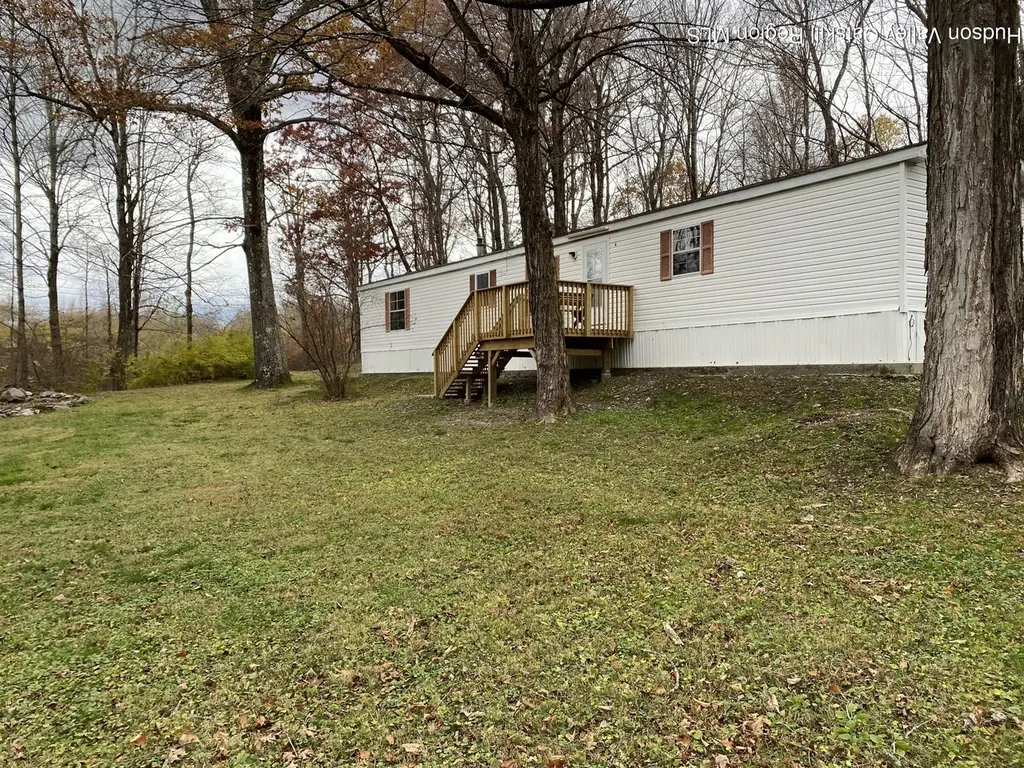
Situated high on a hillside in the Ancram countryside is where you will find this freshly updated 1997 manufactured home. Recent updates and improvements include new stainless-steel appliances. new flooring throughout, fresh paint, new lighting and a new front entrance porch. Inside there are two bedrooms and a third office or hobby room, two full bathrooms and an open kitchen-living room. The parcel is a generous 4-acres in size and features a pond in the front yard and a large deck in the rear for entertaining. New to the market and priced to move.
Key facts
- New lighting
- Large deck
- Front entrance porch
Tags
Neighborhood map
What this means for you Summary
Snapshot
- This is a 3-bed/2.0-bath manufactured listed at $239k.
Deal economics
- At list price, monthly cash flow is $214 ($3k/yr) — positive.
- The deal already cash-flows at list — no discount required.
- To meet the 1% rule (rent ≥ 1% of price), the offer needs to be $220k (7.9% below list).
- Recommended offer: $210k (12.0% below list) — sets the bar for market timing.
Location & tenants
- Location reads 67/100 on livability (#594 in NY) — a middle-class / working-renter tenant base. Strengths: housing A+, health & safety A+, employment A-; Watch: crime D, schools F, amenities F.
- Northeast Central School District (rural): math 47% / reading 37% proficiency, ranked #592 of 755 in NY (top 78%) — families likely to look elsewhere, expect single-tenant / working-renter base with shorter leases.
- Market conditions: 41 active listings in the ZIP; 136 units permitted in Columbia County in 2024 (0 in 5+ unit buildings).
Forward outlook
- In year one you build about $26k of equity ($2k loan paydown + $24k appreciation (10.0% local appreciation)).
- Columbia County population projected at -22% by 2050 — secular population decline; favor cash flow + early exit over multi-decade hold.
- At projected returns (10.0% appreciation + 3.0% rent growth), your $67k cash investment doubles in ~3 years — after that, you're playing with house money.
- By year 2, paydown + projected appreciation supports a ~$41k cash-out refi (75% LTV) — recoverable capital for the next deal without selling this one.
Negotiation context
- It's been on market 228 days — a 12% lower offer ($210k) is reasonable based on typical stale-listing flexibility.
Questions for the listing agent
- It's been on market 228 days. Have you received any prior offers? Is the seller open to a 12% concession, seller financing, or rate buy-down credit?
- Why hasn't it sold? Are there any deal-killer items the seller is aware of (foundation, flood, title, zoning, code violations)?
- Is there a deadline driving the sale (1031 exchange, divorce, estate, relocation)? That informs how much negotiation room exists.
- Schools are F-rated, which usually means shorter tenancies and higher turnover. Who's the typical renter profile here, and what's been the actual vacancy rate?
- Crime grade is D in this area — have there been break-ins, vandalism, or insurance claims at this property in the last 3 years? What carrier currently insures it and at what premium?
- What's the average days-on-market for RENTAL listings here right now (not sales)? A rising rental-DOM trend means longer vacancies and softer asking-rent achievability than the comps imply.
- What's the recent tenant-quality profile in this submarket — average credit score on applications, eviction rate, late-payment / NSF rate, and stable-employment percentage? A property-management company in the area should have these aggregated.
- How much new for-sale + rental construction is in the pipeline within 1–3 miles? Heavy new supply typically softens prices + rents 12–24 months out; constrained supply supports both.
Investment metrics
- 1% rule
- 0.92% ✗
- Cap rate
- 7.37%
- Cash-on-cash
- 3.84%
- DSCR
- 1.17
- GRM
- 9.1
CMA / ARV
- ARV (median comp)
- $102,513
- List price
- $239,000
- Delta
- 133.14%
- Verdict
- OVERPRICED
- Comps
- 1 within 2.0 mi
Projected returns pro-forma
10.0% appreciation · 3.0% rent growth · sell at horizon
- IRR
- 27.0%
- Equity multiple
- 3.15×
- Total profit
- $143,750
- Equity at exit
- $215,310
- IRR
- 23.6%
- Equity multiple
- 7.16×
- Total profit
- $412,512
- Equity at exit
- $464,324
Cash invested: $66,920 (down + closing). Projections, not guarantees.
Landlord ↔ Tenant lean methodology
- Overall (STATE)
- 15 Strongly Tenant-Friendly
- State New York
- 15 Strongly Tenant-Friendly · D+10
- County
- — inherits STATE
- City
- — inherits STATE
ZIP-level market 12546
- Home prices YoY
- 27.9%
- Active inventory
- 41
- Price-to-rent
- 9.1×
Monthly cashflow live
- Estimated rent
- $2,200 medium interval (Pro) →
- Mortgage (P&I)
- −$1,253
- Tax from tax record
- −$171 /mo · $2,053/yr
- Insurance
- −$100
- HOA
- −$0
- Vacancy / Maint / Mgmt
- −$462
- Net cashflow
- $214
Break-even live
Sensitivity live
| Price | -10% $349 | -5% $282 | +0% $214 | +5% $146 | +10% $79 |
|---|---|---|---|---|---|
| Rent | -10% $40 | -5% $127 | +0% $214 | +5% $301 | +10% $388 |
| Rate | -1.0pp $334 | -0.5pp $275 | base $214 | +0.5pp $152 | +1.0pp $89 |
UW: 25.0% down · 7.5% · 30yr · 1.5% tax · 5.0% vac · 8.0% maint · 8.0% mgmt
Financing live
Cash to close
- Down payment
- $59,750
- Closing costs
- $7,170
- Reserves months
- —
- Total cash needed
- —
Loan-product check · same deal, 3 products live
Conventional
25% down · 7.5% · 30yr
- Down + closing
- —
- Monthly P&I
- —
- Monthly cashflow
- —
- DSCR
- —
- Eligible?
- —
Personal DTI + credit; lowest rate.
DSCR
20% down · 8.5% · 30yr
- Down + closing
- —
- Monthly P&I
- —
- Monthly cashflow
- —
- DSCR
- —
- Eligible?
- —
No personal income docs; deal must DSCR.
Hard money
10% down · 12.0% · 12mo
- Down + closing
- —
- Monthly P&I
- —
- Monthly cashflow
- —
- DSCR
- —
- Eligible?
- —
Short-term bridge; refi at stabilization.
Listing history 17 events
-
2026-06-21days on market $239,000 Active 228 DOM
-
2026-06-18days on market $239,000 Active 226 DOM
-
2026-06-17days on market $239,000 Active 225 DOM
-
2026-06-16days on market $239,000 Active 224 DOM
-
2026-06-15days on market $239,000 Active 223 DOM
-
2026-06-13days on market $239,000 Active 221 DOM
-
2026-06-12days on market $239,000 Active 220 DOM
-
2026-06-09days on market $239,000 Active 217 DOM
-
2026-06-08days on market $239,000 Active 216 DOM
-
2026-06-07days on market $239,000 Active 215 DOM
-
2026-06-07days on market $239,000 Active 214 DOM
-
2026-06-04days on market $239,000 Active 211 DOM
-
2026-06-02days on market $239,000 Active 210 DOM
-
2026-06-01days on market $239,000 Active 209 DOM
-
2026-05-31days on market $239,000 Active 208 DOM
-
2026-05-02price $239,000 556-char remark
Show marketing remark (556 chars)
Situated high on a hillside in the Ancram countryside is where you will find this freshly updated 1997 manufactured home. Recent updates and improvements include new stainless-steel appliances. new flooring throughout, fresh paint, new lighting and a new front entrance porch. Inside there are two bedrooms and a third office or hobby room, two full bathrooms and an open kitchen-living room. The parcel is a generous 4-acres in size and features a pond in the front yard and a large deck in the rear for entertaining. New to the market and priced to move.
-
2025-11-05$265,000 Active 556-char remark
Show marketing remark (556 chars)
Situated high on a hillside in the Ancram countryside is where you will find this freshly updated 1997 manufactured home. Recent updates and improvements include new stainless-steel appliances. new flooring throughout, fresh paint, new lighting and a new front entrance porch. Inside there are two bedrooms and a third office or hobby room, two full bathrooms and an open kitchen-living room. The parcel is a generous 4-acres in size and features a pond in the front yard and a large deck in the rear for entertaining. New to the market and priced to move.
ⓘ Source: listings_history table (triggers on properties + properties_extension) + one-shot
backfill from property_details.listing_events for pre-trigger history.
Tax reassessment forecast NY · Partial reset (capped growth)
- Current annual tax
- $2,053 · $171/mo
- Projected year-2 tax
- $3,046 · $254/mo
- Expected delta
- +$993/yr (+$83/mo · 48.4%)
ⓘ Screening estimate from a state-policy table — verify with the county assessor before closing.
Climate risk First Street
- Flood 1/10 Low FEMA zone X · 0% chance over 30 yrs
- Wildfire 4/10 Moderate
- Heat 2/10 Low 7 d/yr ≥93°F today · 15 d/yr by 30 yrs out
- Wind 4/10 Moderate 11% chance of damaging wind over 30 yrs
- Air quality 2/10 Low 1 unhealthy d/yr today · 2 by 30 yrs out
Nearby sold comps map
Loading sold comps map…
Walkable amenities ~0.75 mi
Loading nearby amenities…
Taxation est. · year 1
- Rental income
- $26,400
- − Mortgage interest
- −$13,388
- − Property taxes
- −$2,053
- − Insurance
- −$1,195
- − Repairs & maintenance
- −$2,112
- − Management
- −$2,112
- − Depreciation
- −$6,953
- Taxable loss
- −$1,412
- Est. tax savings @ 24.0%
- +$339
- After-tax cash flow
- $2,907/yr
For passive investors: Depreciation is non-cash, so a rental often shows a tax loss while cash-flowing — sheltering income. Rental losses are passive: they offset passive income freely, and up to $25,000/yr can offset ordinary (W-2) income if you actively participate and your MAGI is under $100k (phasing out to $0 by $150k); unused losses carry forward. On sale, claimed depreciation is recaptured at up to 25%, and gains may owe capital-gains tax (a 1031 exchange can defer both). Figures are a year-1 estimate at your 24.0% rate — not tax advice; consult a CPA.
Schools (NCES district)
- District
- Northeast Central School District
- NCES district ID
- 3630390
- Math proficiency
- 47% ▼ -1.00%
- Reading proficiency
- 37% ▲ 1.00%
- Median HH income
- $58,965
- Composite
- 39.37/100
- National rank
- #8150
- State rank
- #592 of 755 in NY
Livability — Millerton
- Score
- 67/100
- State rank
- #594
- US rank
- #10777
Category grades
Schools grade is shown separately in the Schools card above.
Census & demographics
- Population (ZIP)
- 2,710
Population outlook (Columbia County) Hauer SSP2
- Today (2025)
- 58,662 people
- By 2030
- 56,557 · -3.6%
- By 2040
- 51,324 · -12.5%
- By 2050
- 45,790 · -21.9%
- By 2075
- 35,232 · -39.9%
- By 2100
- 25,846 · -55.9%
Race, ethnicity, and origin ACS 2023
- Neighborhood character
- Predominantly White (70%)
- Race & ethnicity
- White 70% Hispanic / Latino 18% Two or more races 6% Black 4% Native American 4% Asian 3%
- Hispanic origin (detail)
- Common ancestry
- Lithuanian 5% Romanian 4% Slovak 3%
- Foreign-born
- 16% · Canada, Jamaica, South Korea
- Languages at home
- 77% English-only · Spanish 17% French/Haitian/Cajun 4% Other Indo-European 1%
Political lean MEDSL · Columbia
- 2024 margin
- D (+14.7) · D 57.4% · R 42.6%
- 2008→2024 swing
- +1.3pp toward D · 2008: 13.4pp · 2024: 14.7pp
- All cycles
- 2024: D+14.7 2020: D+16.7 2016: D+1.4 2012: D+11.7 2008: D+13.4
Not yet ingested
- Civics
- —
Market trends
- HPI YoY
- ▲ 88.31%
- Current HPI
- 405.1321
- Rent YoY
- —
- Metro
- —
- State GDP YoY
- ▲ 2.60%
- F500 in state
- 92
Industry mix (Fortune 500 HQ in NY)
| Industry | F500 HQs | Revenue |
|---|---|---|
| Financial Services | 10 | $950B |
|
||
| Consumer Goods | 9 | $162B |
|
||
| Insurance | 4 | $225B |
|
||
| Telecommunications | 2 | $144B |
|
||
| Pharmaceuticals | 2 | $112B |
|
||
| Media / Entertainment | 2 | $69B |
|
||
Price history
-9.8% since first listed2 events — show timeline
- 2026-05-02 Price Changed $239,000 HVCRMLS
- 2025-11-05 Listed $265,000 HVCRMLS
Property tax history
+7.2%/yrLatest (2025): $2,053 · +1.7% YoY. Source: county tax records.
Cash-flow waterfall
monthlySold comps — $/sqft
last 12 mo · ≤1 miLoading sold comps…