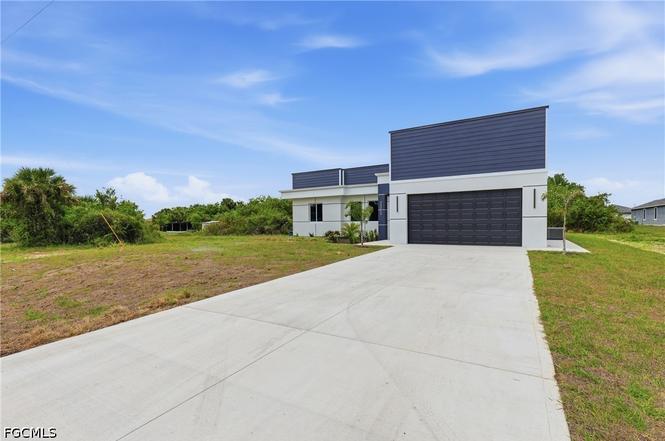
3004 Iris Cir · Port LaBelle, FL
Flood risk 1/10 · Minimal
- FEMA flood zone
- X (unshaded)
- Chance of flooding over 30 yrs
- 0.0%
- Est. flood insurance / yr
- $507 – $1,088
Fire risk 3/10 · Minor
- Est. fire insurance / yr
- $947 – $1,759
Heat risk 9/10 · Severe
- Hot days now (above 108°F)
- 7 days/yr
- Hot days in 30 yrs
- 25 days/yr
Wind risk 10/10 · Severe
- Chance of severe wind over 30 yrs
- 99.0%
Air-quality risk 2/10 · Minimal
- Unhealthy air days now
- 0 days/yr
- Unhealthy air days in 30 yrs
- 1 days/yr
Risk factors via First Street. Map © Google.
Why this score? — see what drove the D- grade
The composite is a weighted blend of 9 inputs, each scored 0–100. Each bar is that input's sub-score; the figure is the points it added to the 100-point composite (weight × sub-score).
- Appreciation +10.0/10.0
- ARV discount +7.5/15.0
- Cash flow +6.7/30.0
- Schools +3.1/10.0
- Livability +3.1/5.0
- Rent growth +2.5/5.0
- Condition / age +2.5/5.0
- 1% rule +1.7/10.0
- DSCR +1.0/10.0
$339,000
🖨 Deal sheet (PDF) 📄 Offer letter ✓ Due diligence
Listing remarks MLS
Seize the opportunity to build your dream home on this prime vacant lot in the growing area of Port LaBelle, Florida. Surrounded by new constructions, this lot is perfectly situated close to schools, and local stores. Don’t miss out !
Key facts
- Sleek tile flooring
- High end finishes
- 0.28 acre lot
Tags
Property features AI
Finance
- Financial info: Pets allowed
- HOA & community: No association fee
Exterior
- Parking: Attached 2-car garage
- Security: Smoke detector(s)
- Utilities: Public water; Septic tank sewer; Cable not available
- Home design: Single-story; New construction; Faces East; Entry at ground level
- Construction: Block, concrete, and stucco construction; Built-up and flat roof
- Exterior features: Open patio; Patio; Porch; Room for pool; Rectangular lot; West exposure
Interior
- Kitchen: Dishwasher; Freezer; Microwave; Refrigerator
- Flooring: Tile
- Bathrooms: 2 full bathrooms
- Heating & cooling: Central electric heating; Central electric air conditioning
- Interior features: Impact glass windows; Dual sinks; Family/dining room; Living/dining room; Separate shower; Shower only; Walk-in closet(s); Unfurnished
- Laundry & utility: Washer hookup; Dryer hookup
Neighborhood map
What this means for you Summary
Snapshot
- This is a 3-bed/2.0-bath land listed at $339k.
Deal economics
- At list price, monthly cash flow is $-541 ($-6k/yr) — negative.
- To cash-flow at today's rent, offer at most $261k (23.1% below list).
- To meet the 1% rule (rent ≥ 1% of price), the offer needs to be $228k (32.7% below list).
- Recommended offer: $228k (32.7% below list) — sets the bar for 1% rule.
Location & tenants
- Location reads 62/100 on livability (#750 in FL) — a middle-class / working-renter tenant base. Strengths: cost of living A+, housing A+; Watch: amenities F, commute F, employment F.
- Hendry (town): math 35% / reading 40% proficiency, ranked #65 of 73 in FL (top 89%) — families likely to look elsewhere, expect single-tenant / working-renter base with shorter leases; 75% free/reduced lunch — lower-income household profile, screen leases tightly.
- Zoned schools: Country Oaks Elementary School (math 48% / reading 45%, grade D-, #1,223 of 2,144 statewide, top 57%, 893 students, 75% FRL); Labelle Middle School (math 37% / reading 38%, grade F, #395 of 571 statewide, top 70%, 817 students, 72% FRL); Labelle High School (math 42% / reading 41%, grade F, #284 of 667 statewide, top 43%, 1,451 students, 62% FRL).
- Market conditions: 951 active listings in the ZIP; 5 comparable units currently listed for rent nearby; rentals at typical pace (median 26d on market — plan ~3-4 weeks tenant-placement turnaround); 557 units permitted in Hendry County in 2024 (45 in 5+ unit buildings).
- At $2,281/mo this rent would consume 48% of the median local household income ($57k/yr) (locally 498% of renters already pay >50% of income on rent) — very limited rent-growth headroom before tenants either downsize or default.
Forward outlook
- In year one you build about $36k of equity ($2k loan paydown + $34k appreciation (10.0% local appreciation)).
- Hendry County population projected to shrink 7% by 2050 — rents likely to lag national; underwrite the cash flow, not the appreciation.
- By year 2, paydown + projected appreciation supports a ~$58k cash-out refi (75% LTV) — recoverable capital for the next deal without selling this one.
Negotiation context
- It's been on market 103 days — a 9% lower offer ($308k) is reasonable based on typical stale-listing flexibility.
- 2 sale attempts since 2y ago with the ask held roughly flat each time — persistent listings suggest the price (not the market) is what's stuck; bring a comps-based counter.
- Current owner paid $24k; list at $339k implies a 1284% gain — meaningful room to come down on a strong offer.
Risks & watch-outs
- Climate carrying-cost: severe wind risk, 99% chance of damaging wind over 30y; extreme-heat days projected 7→25/yr by 2055 (HVAC capex compounding) — expect insurance premiums to compound above CPI over the hold.
Questions for the listing agent
- What do current leases actually rent for vs. the listed asking? Can we see a recent rent roll and the last 12 months of T-12 income?
- It's been on market 103 days. Have you received any prior offers? Is the seller open to a 33% concession, seller financing, or rate buy-down credit?
- Why hasn't it sold? Are there any deal-killer items the seller is aware of (foundation, flood, title, zoning, code violations)?
- Is there a deadline driving the sale (1031 exchange, divorce, estate, relocation)? That informs how much negotiation room exists.
- Schools are F-rated, which usually means shorter tenancies and higher turnover. Who's the typical renter profile here, and what's been the actual vacancy rate?
- The area grade is low — what's the realistic commute time and amenity access for the typical tenant pool here? Any planned neighborhood developments (good or bad) we should know about?
- What's the average days-on-market for RENTAL listings here right now (not sales)? A rising rental-DOM trend means longer vacancies and softer asking-rent achievability than the comps imply.
- What's the recent tenant-quality profile in this submarket — average credit score on applications, eviction rate, late-payment / NSF rate, and stable-employment percentage? A property-management company in the area should have these aggregated.
- How much new for-sale + rental construction is in the pipeline within 1–3 miles? Heavy new supply typically softens prices + rents 12–24 months out; constrained supply supports both.
Investment metrics
- 1% rule
- 0.67% ✗
- Cap rate
- 4.38%
- Cash-on-cash
- -6.84%
- DSCR
- 0.70
- GRM
- 12.4
CMA / ARV
No comps found within radius.
Projected returns pro-forma
10.0% appreciation · 3.0% rent growth · sell at horizon
- IRR
- 19.4%
- Equity multiple
- 2.58×
- Total profit
- $150,198
- Equity at exit
- $305,398
- IRR
- 17.9%
- Equity multiple
- 5.95×
- Total profit
- $469,479
- Equity at exit
- $658,602
Cash invested: $94,920 (down + closing). Projections, not guarantees.
Landlord ↔ Tenant lean methodology
- Overall (STATE)
- 87 Strongly Landlord-Friendly
- State Florida
- 87 Strongly Landlord-Friendly · R+3
- County
- — inherits STATE
- City
- — inherits STATE
ZIP-level market 33935
- Home prices YoY
- 16.3%
- Active inventory
- 951
- Price-to-rent
- 12.4×
Monthly cashflow live
- Estimated rent
- $2,281 high interval (Pro) →
- Mortgage (P&I)
- −$1,778
- Tax est. 1.5%
- −$424 /mo · $5,085/yr
- Insurance
- −$141
- HOA
- −$0
- Lot rent
- −$0
- Vacancy / Maint / Mgmt
- −$479
- Net cashflow
- $-541
Break-even live
Sensitivity live
| Price | -10% $-307 | -5% $-424 | +0% $-541 | +5% $-658 | +10% $-775 |
|---|---|---|---|---|---|
| Rent | -10% $-721 | -5% $-631 | +0% $-541 | +5% $-451 | +10% $-361 |
| Rate | -1.0pp $-370 | -0.5pp $-455 | base $-541 | +0.5pp $-629 | +1.0pp $-718 |
UW: 25.0% down · 7.5% · 30yr · 1.5% tax · 5.0% vac · 8.0% maint · 8.0% mgmt
Financing live
Cash to close
- Down payment
- $84,750
- Closing costs
- $10,170
- Reserves months
- —
- Total cash needed
- —
Loan-product check · same deal, 3 products live
Conventional
25% down · 7.5% · 30yr
- Down + closing
- —
- Monthly P&I
- —
- Monthly cashflow
- —
- DSCR
- —
- Eligible?
- —
Personal DTI + credit; lowest rate.
DSCR
20% down · 8.5% · 30yr
- Down + closing
- —
- Monthly P&I
- —
- Monthly cashflow
- —
- DSCR
- —
- Eligible?
- —
No personal income docs; deal must DSCR.
Hard money
10% down · 12.0% · 12mo
- Down + closing
- —
- Monthly P&I
- —
- Monthly cashflow
- —
- DSCR
- —
- Eligible?
- —
Short-term bridge; refi at stabilization.
Rent comps 5 comps
| Address | Beds | Baths | Sqft | Rent | $/sqft | DOM | Units | Dist |
|---|---|---|---|---|---|---|---|---|
| 3020 N Lakewood Rd Labelle, FL | 4.0 | 2.0 | 1499 | $1,950 | $1.30 | 26d | 1 | 0.46mi |
| 3051 NW Beechwood Cir Labelle, FL | 4.0 | 2.0 | 1499 | $2,200 | $1.47 | 26d | 1 | 0.60mi |
| 5012 Gunn Pl Labelle, FL | 3.0 | 2.5 | 1783 | $2,500 | $1.40 | 5d | 1 | 0.95mi |
| 5029 W Hummingbird Dr Labelle, FL | 3.0 | 2.0 | 1212 | $2,450 | $2.02 | 5d | 1 | 1.04mi |
| 5029 S Rosebud Cir Labelle, FL | 3.0 | 2.0 | 1389 | $1,780 | $1.28 | 26d | 1 | 1.15mi |
Listing history 24 events
-
2026-06-22days on market $339,000 Active 103 DOM
-
2026-06-22days on market $339,000 Active 102 DOM
-
2026-06-18days on market $339,000 Active 99 DOM
-
2026-06-17days on market $339,000 Active 98 DOM
-
2026-06-16days on market $339,000 Active 97 DOM
-
2026-06-15days on market $339,000 Active 96 DOM
-
2026-06-13days on market $339,000 Active 94 DOM
-
2026-06-13days on market $339,000 Active 93 DOM
-
2026-06-10days on market $339,000 Active 91 DOM
-
2026-06-09days on market $339,000 Active 90 DOM
-
2026-06-08days on market $339,000 Active 89 DOM
-
2026-06-07days on market $339,000 Active 88 DOM
-
2026-06-03days on market $339,000 Active 84 DOM
-
2026-06-02days on market $339,000 Active 83 DOM
-
2026-06-01days on market $339,000 Active 82 DOM
-
2026-05-31days on market $339,000 Active 81 DOM
-
2026-03-11$339,000 Active
-
2024-09-24soldstatus $24,500 Closed 241-char remark
Show marketing remark (241 chars)
Seize the opportunity to build your dream home on this prime vacant lot in the growing area of Port LaBelle, Florida. Surrounded by new constructions, this lot is perfectly situated close to schools, and local stores. Don’t miss out !
-
2024-06-05$26,000 Active 241-char remark
Show marketing remark (241 chars)
Seize the opportunity to build your dream home on this prime vacant lot in the growing area of Port LaBelle, Florida. Surrounded by new constructions, this lot is perfectly situated close to schools, and local stores. Don’t miss out !
-
2004-11-08soldstatus $18,000
-
2004-11-01soldstatus $18,000 25-char remark
Show marketing remark (25 chars)
Partially Treed homesite.
-
2004-11-01price $19,000
Show marketing remark (25 chars)
Partially Treed homesite.
-
2004-11-01soldstatus $18,000
Show marketing remark (25 chars)
Partially Treed homesite.
-
2004-10-05price $19,000 25-char remark
Show marketing remark (25 chars)
Partially Treed homesite.
ⓘ Source: listings_history table (triggers on properties + properties_extension) + one-shot
backfill from property_details.listing_events for pre-trigger history.
Climate risk First Street
- Flood 1/10 Low FEMA zone X (unshaded) · 0% chance over 30 yrs
- Wildfire 3/10 Moderate
- Heat 9/10 Extreme 7 d/yr ≥108°F today · 25 d/yr by 30 yrs out
- Wind 10/10 Extreme 99% chance of damaging wind over 30 yrs
- Air quality 2/10 Low 0 unhealthy d/yr today · 1 by 30 yrs out
Nearby sold comps map
Loading sold comps map…
Walkable amenities ~0.75 mi
Loading nearby amenities…
Taxation est. · year 1
- Rental income
- $27,366
- − Mortgage interest
- −$18,989
- − Property taxes
- −$5,085
- − Insurance
- −$1,695
- − Repairs & maintenance
- −$2,189
- − Management
- −$2,189
- − Depreciation
- −$9,862
- Taxable loss
- −$12,643
- Est. tax savings @ 24.0%
- +$3,034
- After-tax cash flow
- $-3,459/yr
For passive investors: Depreciation is non-cash, so a rental often shows a tax loss while cash-flowing — sheltering income. Rental losses are passive: they offset passive income freely, and up to $25,000/yr can offset ordinary (W-2) income if you actively participate and your MAGI is under $100k (phasing out to $0 by $150k); unused losses carry forward. On sale, claimed depreciation is recaptured at up to 25%, and gains may owe capital-gains tax (a 1031 exchange can defer both). Figures are a year-1 estimate at your 24.0% rate — not tax advice; consult a CPA.
Schools (NCES district)
- District
- Hendry
- NCES district ID
- 1200780
- Math proficiency
- 35% ▼ -11.00%
- Reading proficiency
- 40% ▼ -4.00%
- Median HH income
- $37,043
- Composite
- 31.16/100
- National rank
- #6054
- State rank
- #65 of 73 in FL
Livability — Port LaBelle
- Score
- 62/100
- State rank
- #750
- US rank
- #16264
Category grades
Schools grade is shown separately in the Schools card above.
Census & demographics
- Census place
- Port LaBelle, FL
- County
- Hendry County · 23,186 people
- Metro
- Clewiston, FL
- Population (ZIP)
- 23,186
- Household income
- $57,009
- Rent vs Own
- Severe rent burden
- 498.0
Population outlook (Hendry County) Hauer SSP2
- Today (2025)
- 38,866 people
- By 2030
- 38,558 · -0.8%
- By 2040
- 37,743 · -2.9%
- By 2050
- 36,117 · -7.1%
- By 2075
- 30,070 · -22.6%
- By 2100
- 21,966 · -43.5%
Race, ethnicity, and origin ACS 2023
- Neighborhood character
- Majority Hispanic (56%)
- Race & ethnicity
- Hispanic / Latino 56% White 39% Two or more races 21% Black 2% Native American 2%
- Hispanic origin (detail)
- Mexican 40% Puerto Rican 3% Cuban 5%
- Common ancestry
- Lithuanian 2% Serbian 2% Slovak 1%
- Foreign-born
- 27% · Canada, Jamaica
- Languages at home
- 50% English-only · Spanish 50%
Political lean MEDSL · Hendry
- 2024 margin
- Solid R (+38.3) · D 30.4% · R 68.7%
- 2008→2024 swing
- -31.1pp toward R · 2008: -7.2pp · 2024: -38.3pp
- All cycles
- 2024: R+38.3 2020: R+23.0 2016: R+14.2 2012: R+5.9 2008: R+7.2
Not yet ingested
- Civics
- —
Market trends
- HPI YoY
- ▲ 75.20%
- Current HPI
- 537.4928
- Rent YoY
- —
- Metro
- Clewiston, FL
- State GDP YoY
- ▲ 3.28%
- F500 in state
- 36
Industry mix (Fortune 500 HQ in FL)
| Industry | F500 HQs | Revenue |
|---|---|---|
| Industrial Technology | 2 | $29B |
|
||
| Insurance | 2 | $17B |
|
||
| Retail | 1 | $60B |
|
||
| Technology Distribution | 1 | $58B |
|
||
| Homebuilding | 1 | $35B |
|
||
| Technology Manufacturing | 1 | $35B |
|
||
Price history
+1684.2% since first listed8 events — show timeline
- 2026-03-11 Listed $339,000 FORTMLS
- 2024-09-24 Sold (MLS) $24,500 FORTMLS
- 2024-06-05 Listed $26,000 FORTMLS
- 2004-11-08 Sold (Public Records) $18,000 Public Records
- 2004-11-01 Sold (MLS) $18,000 FORTMLS
- 2004-11-01 Price Changed $19,000 FORTMLS
- 2004-11-01 Sold (MLS) $18,000 FORTMLS
- 2004-10-05 Price Changed $19,000 FORTMLS
Property tax history
+12.7%/yrLatest (2025): $536 · +65.6% YoY. Source: county tax records.
Cash-flow waterfall
monthlySold comps — $/sqft
last 12 mo · ≤1 miLoading sold comps…