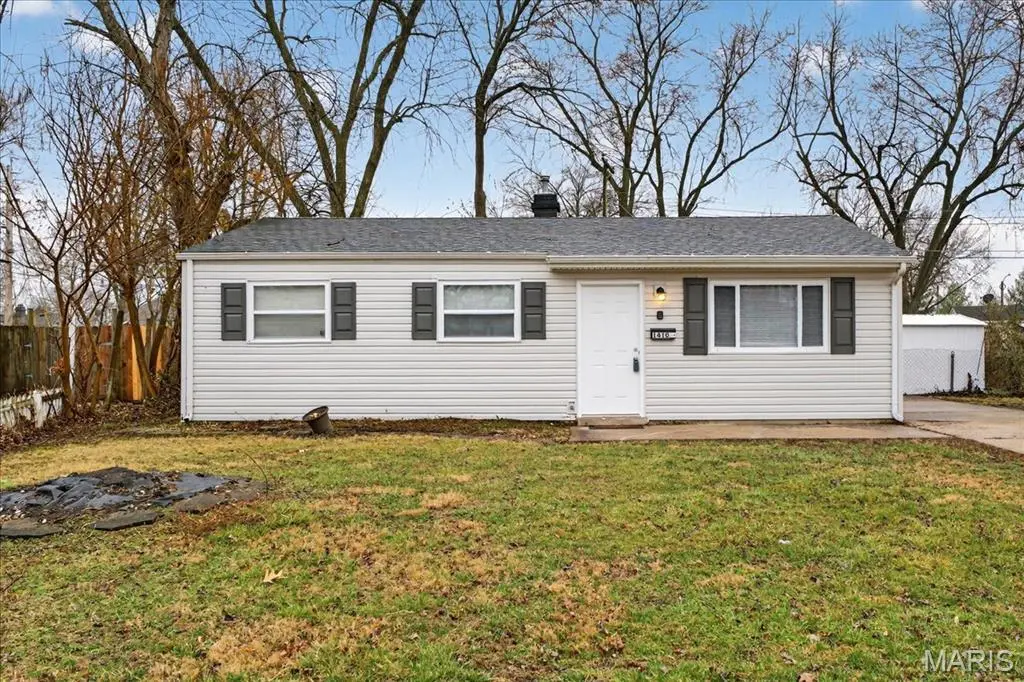
1410 Vero Dr · Wentzville, MO
Flood risk 1/10 · Minimal
- FEMA flood zone
- X (unshaded)
- Chance of flooding over 30 yrs
- 0.0%
- Est. flood insurance / yr
- $507 – $1,088
Fire risk 1/10 · Minimal
- Est. fire insurance / yr
- $1,054 – $1,958
Heat risk 4/10 · Minor
- Hot days now (above 107°F)
- 7 days/yr
- Hot days in 30 yrs
- 19 days/yr
Wind risk 2/10 · Minimal
- Chance of severe wind over 30 yrs
- 1.0%
Air-quality risk 1/10 · Minimal
- Unhealthy air days now
- 0 days/yr
- Unhealthy air days in 30 yrs
- 0 days/yr
Risk factors via First Street. Map © Google.
Why this score? — see what drove the D+ grade
The composite is a weighted blend of 9 inputs, each scored 0–100. Each bar is that input's sub-score; the figure is the points it added to the 100-point composite (weight × sub-score).
- Cash flow +15.2/30.0
- ARV discount +9.1/15.0
- DSCR +4.7/10.0
- Schools +4.3/10.0
- Livability +4.0/5.0
- Rent growth +3.5/5.0
- 1% rule +3.3/10.0
- Condition / age +2.5/5.0
- Appreciation +0.0/10.0
$199,900
🖨 Deal sheet (PDF) 📄 Offer letter ✓ Due diligence
Listing remarks MLS
Great starter home or investment property! This 3 bedroom, 1 bath home has new carpet & fresh paint throughout. The living room features a giant picture window with laminate flooring and an updated ceiling fan. With a private driveway and a large fenced yard this home is a MUST SEE! * MOTIVATED SELLER *
Key facts
- Large picture window
- Single level living
- Granite countertops
Tags
Neighborhood map
What this means for you Summary
Snapshot
- This is a 3-bed/1.0-bath single-family listed at $200k.
Deal economics
- At list price, monthly cash flow is $69 ($829/yr) — positive.
- The deal already cash-flows at list — no discount required.
- To meet the 1% rule (rent ≥ 1% of price), the offer needs to be $166k (17.0% below list).
- Recommended offer: $166k (17.0% below list) — sets the bar for 1% rule.
- Cap rate 6.7% vs local median 3.4% in Wentzville — top-decile yield for the area; either an underpriced asset or a hidden risk that comps aren't pricing in. Stress-test before assuming the spread holds.
Location & tenants
- Location reads 81/100 on livability (#14 in MO, #1,402 nationally) — a professional / high-income tenant draw. Strengths: crime A+, employment A+, housing A+; Watch: commute F.
- Wentzville R-IV (suburban): math 44% / reading 52% proficiency, ranked #32 of 324 in MO (top 10%) — families likely to look elsewhere, expect single-tenant / working-renter base with shorter leases; only 18% free/reduced lunch — higher-income household profile.
- Zoned schools: Stone Creek Elementary (math 42% / reading 49%, grade D-, #405 of 1,115 statewide, top 37%, 581 students, 20% FRL); Wentzville South Middle (math 49% / reading 51%, grade C, #68 of 391 statewide, top 18%, 1,131 students, 14% FRL); Timberland High (math 36% / reading 63%, grade D, #124 of 521 statewide, top 28%, 1,676 students, 13% FRL) — zoned schools at 16% FRL track the district average.
- Market conditions: Rents rising (+4.0%/yr); 700 active listings in the ZIP; 3 comparable units currently listed for rent nearby; rentals at typical pace (median 16d on market — plan ~3-4 weeks tenant-placement turnaround); high-income renter base; 2,021 units permitted in St. Charles County in 2024 (568 in 5+ unit buildings).
- This rent is only 18% of the median local income ($112k/yr) — well below the 30% rent-burden line; pricing power to push rent on renewal without tenant pushback.
Forward outlook
- Local home prices are declining (-3.0%/yr); year-one equity from $1k of loan paydown is wiped out by about $6k of value loss. Plan a longer hold.
- St. Charles County population projected at +22% by 2050 — long-run rental-demand tailwind backs the buy-and-hold thesis.
Negotiation context
- It's been on market 23 days — a 2% lower offer ($197k) is reasonable based on typical stale-listing flexibility.
- 2 sale attempts since 12y ago with the ask held roughly flat each time — persistent listings suggest the price (not the market) is what's stuck; bring a comps-based counter.
- Current owner paid $63k; list at $200k implies a 217% gain — meaningful room to come down on a strong offer.
Risks & watch-outs
- Watch-outs: built in 1958 — expect roof / HVAC / electrical / plumbing capex.
Questions for the listing agent
- Built in 1958 — when were the roof, HVAC, electrical panel, plumbing, and water heater last replaced?
- Is there a deadline driving the sale (1031 exchange, divorce, estate, relocation)? That informs how much negotiation room exists.
- Schools are B-rated — typically a magnet for longer-tenancy family renters. What's the average tenant stay here, and is there a school-zone premium baked into asking?
- The area grade is low — what's the realistic commute time and amenity access for the typical tenant pool here? Any planned neighborhood developments (good or bad) we should know about?
- What's the average days-on-market for RENTAL listings here right now (not sales)? A rising rental-DOM trend means longer vacancies and softer asking-rent achievability than the comps imply.
- What's the recent tenant-quality profile in this submarket — average credit score on applications, eviction rate, late-payment / NSF rate, and stable-employment percentage? A property-management company in the area should have these aggregated.
- How much new for-sale + rental construction is in the pipeline within 1–3 miles? Heavy new supply typically softens prices + rents 12–24 months out; constrained supply supports both.
Investment metrics
- 1% rule
- 0.83% ✗
- Cap rate
- 6.71%
- Cash-on-cash
- 1.48%
- DSCR
- 1.07
- GRM
- 10.0
CMA / ARV
- ARV (on-the-fly)
- $207,360
- Comps found
- 12
Show comp detail 12 sales within ~0.75 mi
| Address | Dist | Beds/Ba | Sqft | Sold | Price | $/sf | Match |
|---|---|---|---|---|---|---|---|
| 1443 Vero Dr | 0.20mi | 3/1.0 | 864 (0%) | 9mo | $219,900 | $255 | 83 |
| 1434 Plaza Pl | 0.16mi | 3/1.0 | 864 (0%) | 15mo | $209,900 | $243 | 80 |
| 606 Ball St | 0.70mi | 2/1.0 (-1) | 864 (0%) | 4mo | $135,000 | $156 | 59 |
| 1446 Kathleen Dr | 0.23mi | 3/2.0 | 988 (+14%) | 6mo | $220,000 | $223 | 56 |
| 1448 Kathleen Dr | 0.24mi | 3/2.0 | 988 (+14%) | 11mo | $210,000 | $213 | 52 |
| 1449 Kathleen Dr | 0.23mi | 3/1.0 | 988 (+14%) | 17mo | $205,000 | $207 | 51 |
| 616 Ball St | 0.67mi | 2/1.0 (-1) | 936 (+8%) | 7mo | $230,000 | $246 | 44 |
| 131 Green Gables Dr | 0.64mi | 2/1.0 (-1) | 978 (+13%) | 1mo | $235,000 | $240 | 42 |
| 122 Green Gables Dr | 0.67mi | 2/1.0 (-1) | 962 (+11%) | 3mo | $225,000 | $234 | 42 |
| 125 Green Gables Dr | 0.66mi | 2/1.0 (-1) | 962 (+11%) | 12mo | $234,900 | $244 | 35 |
| 706 Parr St | 0.74mi | 3/1.0 | 988 (+14%) | 14mo | $215,000 | $218 | 29 |
| 805 Parr St | 0.72mi | 3/2.0 | 960 (+11%) | 18mo | $239,900 | $250 | 29 |
Match score weights: distance 35% · size 25% · config 20% · recency 20%. Top-matched comps best support the ARV.
Projected returns pro-forma
-3.0% appreciation · 3.96% rent growth · sell at horizon
- IRR
- -13.0%
- Equity multiple
- 0.53×
- Total profit
- $-26,437
- Equity at exit
- $29,806
- IRR
- -2.8%
- Equity multiple
- 0.81×
- Total profit
- $-10,835
- Equity at exit
- $17,284
Cash invested: $55,972 (down + closing). Projections, not guarantees.
Landlord ↔ Tenant lean methodology
- Overall (STATE)
- 81 Strongly Landlord-Friendly
- State Missouri
- 81 Strongly Landlord-Friendly · R+10
- County
- — inherits STATE
- City
- — inherits STATE
ZIP-level market 63385
- Home prices YoY
- -31.2%
- Rents YoY
- 4.0%
- Active inventory
- 700
- Price-to-rent
- 10.0×
Monthly cashflow live
- Estimated rent
- $1,659 medium interval (Pro) →
- Mortgage (P&I)
- −$1,048
- Tax from tax record
- −$110 /mo · $1,323/yr
- Insurance
- −$83
- HOA
- −$0
- Vacancy / Maint / Mgmt
- −$348
- Net cashflow
- $69
Break-even live
Sensitivity live
| Price | -10% $182 | -5% $126 | +0% $69 | +5% $12 | +10% $-44 |
|---|---|---|---|---|---|
| Rent | -10% $-62 | -5% $4 | +0% $69 | +5% $135 | +10% $200 |
| Rate | -1.0pp $170 | -0.5pp $120 | base $69 | +0.5pp $17 | +1.0pp $-35 |
UW: 25.0% down · 7.5% · 30yr · 1.5% tax · 5.0% vac · 8.0% maint · 8.0% mgmt
Financing live
Cash to close
- Down payment
- $49,975
- Closing costs
- $5,997
- Reserves months
- —
- Total cash needed
- —
Loan-product check · same deal, 3 products live
Conventional
25% down · 7.5% · 30yr
- Down + closing
- —
- Monthly P&I
- —
- Monthly cashflow
- —
- DSCR
- —
- Eligible?
- —
Personal DTI + credit; lowest rate.
DSCR
20% down · 8.5% · 30yr
- Down + closing
- —
- Monthly P&I
- —
- Monthly cashflow
- —
- DSCR
- —
- Eligible?
- —
No personal income docs; deal must DSCR.
Hard money
10% down · 12.0% · 12mo
- Down + closing
- —
- Monthly P&I
- —
- Monthly cashflow
- —
- DSCR
- —
- Eligible?
- —
Short-term bridge; refi at stabilization.
Rent comps 3 comps
| Address | Beds | Baths | Sqft | Rent | $/sqft | DOM | Units | Dist |
|---|---|---|---|---|---|---|---|---|
| 1414 E Pitman Ave Wentzville, MO | 3.0 | 1.0 | 864 | $1,425 | $1.65 | 0d | 1 | 0.11mi |
| 1414 E Pitman Ave Wentzville, MO | 3.0 | 1.0 | 864 | $1,425 | $1.65 | 25d | 1 | 0.11mi |
| 17 Warsen Ave Wentzville, MO | 3.0 | 1.0 | 864 | $1,875 | $2.17 | 16d | 1 | 1.01mi |
Listing history 15 events
-
2026-04-06status Pending
-
2026-03-14$199,900 Active
-
2021-12-10soldstatus $63,000
-
2014-08-11soldstatus $52,500
-
2014-08-05soldstatus 311-char remark
Show marketing remark (311 chars)
Great starter home or investment property! This 3 bedroom, 1 bath home has new carpet & fresh paint throughout. The living room features a giant picture window with laminate flooring and an updated ceiling fan. With a private driveway and a large fenced yard this home is a MUST SEE! * MOTIVATED SELLER *
-
2014-02-14$54,600 311-char remark
Show marketing remark (311 chars)
Great starter home or investment property! This 3 bedroom, 1 bath home has new carpet & fresh paint throughout. The living room features a giant picture window with laminate flooring and an updated ceiling fan. With a private driveway and a large fenced yard this home is a MUST SEE! * MOTIVATED SELLER *
-
2009-05-20soldstatus $53,000
-
2007-07-05soldstatus $80,500
-
2005-05-17soldstatus $70,900
-
2005-03-28soldstatus $64,250
-
1993-08-01soldstatus $24,333
-
1985-07-01soldstatus
-
1985-07-01soldstatus $35,500
-
1982-12-01soldstatus
-
1981-10-01soldstatus
ⓘ Source: listings_history table (triggers on properties + properties_extension) + one-shot
backfill from property_details.listing_events for pre-trigger history.
Tax reassessment forecast MO · Resets to sale price
- Current annual tax
- $1,323 · $110/mo
- Projected year-2 tax
- $1,939 · $162/mo
- Expected delta
- +$616/yr (+$51/mo · 46.6%)
ⓘ Screening estimate from a state-policy table — verify with the county assessor before closing.
Climate risk First Street
- Flood 1/10 Low FEMA zone X (unshaded) · 0% chance over 30 yrs
- Wildfire 1/10 Low
- Heat 4/10 Moderate 7 d/yr ≥107°F today · 19 d/yr by 30 yrs out
- Wind 2/10 Low 100% chance of damaging wind over 30 yrs
- Air quality 1/10 Low 0 unhealthy d/yr today · 0 by 30 yrs out
Nearby sold comps map
Loading sold comps map…
Walkable amenities ~0.75 mi
Loading nearby amenities…
Taxation est. · year 1
- Rental income
- $19,912
- − Mortgage interest
- −$11,198
- − Property taxes
- −$1,323
- − Insurance
- −$1,000
- − Repairs & maintenance
- −$1,593
- − Management
- −$1,593
- − Depreciation
- −$5,815
- Taxable loss
- −$2,609
- Est. tax savings @ 24.0%
- +$626
- After-tax cash flow
- $1,455/yr
For passive investors: Depreciation is non-cash, so a rental often shows a tax loss while cash-flowing — sheltering income. Rental losses are passive: they offset passive income freely, and up to $25,000/yr can offset ordinary (W-2) income if you actively participate and your MAGI is under $100k (phasing out to $0 by $150k); unused losses carry forward. On sale, claimed depreciation is recaptured at up to 25%, and gains may owe capital-gains tax (a 1031 exchange can defer both). Figures are a year-1 estimate at your 24.0% rate — not tax advice; consult a CPA.
Schools (NCES district)
- District
- Wentzville R-IV
- NCES district ID
- 2931650
- Math proficiency
- 44% ▼ -9.00%
- Reading proficiency
- 52% ▼ -7.00%
- Median HH income
- $74,961
- Composite
- 43.49/100
- National rank
- #2994
- State rank
- #32 of 324 in MO
Livability — Wentzville
- Score
- 81/100
- State rank
- #14
- US rank
- #1402
Category grades
Schools grade is shown separately in the Schools card above.
Census & demographics
- Census place
- Wentzville, MO
- County
- Saint Charles County · 399,703 people
- City population
- 51,330
- Metro
- St. Louis, MO-IL
- Population (ZIP)
- 51,330
- Household income
- $112,199
- Rent vs Own
- Severe rent burden
- 662.0
Population outlook (St. Charles County) Hauer SSP2
- Today (2025)
- 437,857 people
- By 2030
- 461,707 · +5.4%
- By 2040
- 503,222 · +14.9%
- By 2050
- 534,684 · +22.1%
- By 2075
- 597,047 · +36.4%
- By 2100
- 609,682 · +39.2%
Race, ethnicity, and origin ACS 2023
- Neighborhood character
- Predominantly White (86%)
- Race & ethnicity
- White 86% Black 5% Two or more races 5% Hispanic / Latino 3% Asian 2%
- Common ancestry
- Lithuanian 3% Romanian 3% Italian 2%
- Foreign-born
- 2% · Canada, China
- Languages at home
- 97% English-only · Spanish 2%
Political lean MEDSL · St. Charles
- 2024 margin
- R (+17.0) · D 40.8% · R 57.8% · Other 1.4%
- 2008→2024 swing
- -7.2pp toward R · 2008: -9.7pp · 2024: -17.0pp
- All cycles
- 2024: R+17.0 2020: R+17.5 2016: R+26.4 2012: R+21.0 2008: R+9.7
Not yet ingested
- Civics
- —
Market trends
- HPI YoY
- ▼ -97.98%
- Current HPI
- 216.4917
- Rent YoY
- ▲ 3.96%
- Metro
- St. Louis, MO-IL
- State GDP YoY
- ▲ 1.84%
- F500 in state
- 20
Industry mix (Fortune 500 HQ in MO)
| Industry | F500 HQs | Revenue |
|---|---|---|
| Healthcare | 1 | $163B |
|
||
| Insurance | 1 | $21B |
|
||
| Industrial Technology | 1 | $17B |
|
||
| Retail | 1 | $16B |
|
||
| Industrial Distribution | 1 | $10B |
|
||
| Utilities | 1 | $9B |
|
||
Price history
+463.1% since first listed15 events — show timeline
- 2026-04-06 Pending — MARIS as Distributed by MLS Grid
- 2026-03-14 Listed $199,900 MARIS as Distributed by MLS Grid
- 2021-12-10 Sold (Public Records) $63,000 Public Records
- 2014-08-11 Sold (Public Records) $52,500 Public Records
- 2014-08-05 Sold (MLS) — MARIS as Distributed by MLS Grid
- 2014-02-14 Listed $54,600 MARIS as Distributed by MLS Grid
- 2009-05-20 Sold (Public Records) $53,000 Public Records
- 2007-07-05 Sold (Public Records) $80,500 Public Records
- 2005-05-17 Sold (Public Records) $70,900 Public Records
- 2005-03-28 Sold (Public Records) $64,250 Public Records
- 1993-08-01 Sold (Public Records) $24,333 Public Records
- 1985-07-01 Sold (Public Records) $35,500 Public Records
- 1985-07-01 Sold (Public Records) — Public Records
- 1982-12-01 Sold (Public Records) — Public Records
- 1981-10-01 Sold (Public Records) — Public Records
Property tax history
+4.6%/yrLatest (2025): $1,323 · +5.9% YoY. Source: county tax records.
Cash-flow waterfall
monthlySold comps — $/sqft
last 12 mo · ≤1 miLoading sold comps…