149 Commanche Dr Lot 5522 · Gold Key Lake, PA
Flood risk 1/10 · Minimal
- FEMA flood zone
- X (unshaded)
- Chance of flooding over 30 yrs
- 0.0%
- Est. flood insurance / yr
- $507 – $1,088
Fire risk 6/10 · Moderate
- Est. fire insurance / yr
- $511 – $949
Heat risk 2/10 · Minimal
- Hot days now (above 91°F)
- 7 days/yr
- Hot days in 30 yrs
- 15 days/yr
Wind risk 3/10 · Minor
- Chance of severe wind over 30 yrs
- 6.0%
Air-quality risk 2/10 · Minimal
- Unhealthy air days now
- 1 days/yr
- Unhealthy air days in 30 yrs
- 2 days/yr
Risk factors via First Street. Map © Google.
Why this score? — see what drove the A- grade
The composite is a weighted blend of 9 inputs, each scored 0–100. Each bar is that input's sub-score; the figure is the points it added to the 100-point composite (weight × sub-score).
- Cash flow +30.0/30.0
- 1% rule +10.0/10.0
- DSCR +10.0/10.0
- Appreciation +10.0/10.0
- ARV discount +7.5/15.0
- Schools +4.7/10.0
- Condition / age +4.0/5.0
- Livability +3.5/5.0
- Rent growth +2.5/5.0
$87,000
🖨 Deal sheet 📄 Offer letter ✓ Due diligence
Listing remarks MLS
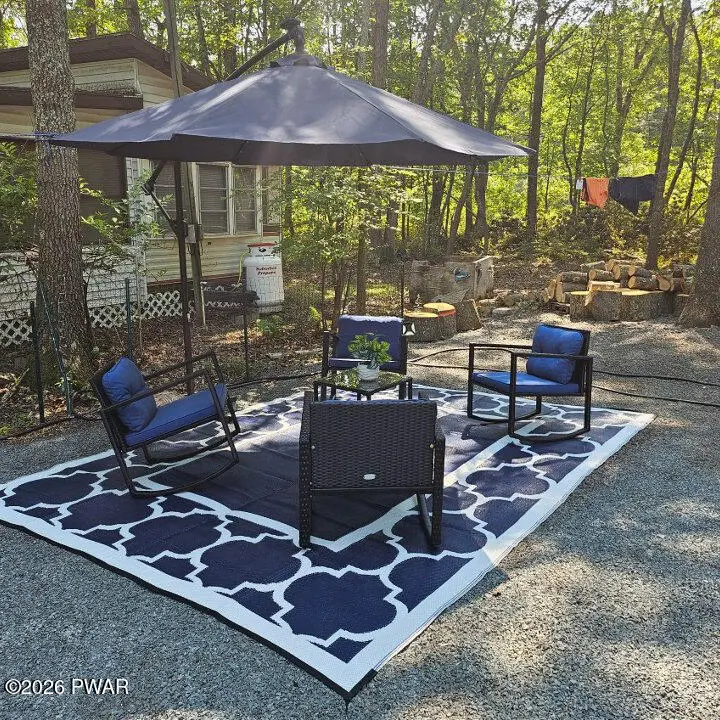
Perfect spot to enjoy nature and the amenities in Trails End!!! This spotless, completely remodeled vacation trailer features new kitchen, 2 FULL bedrooms, beautiful bathroom, fully enclosed porch, graveled lot, shed and gazebo!! You couldn't ask for more. Impeccably kept, with NOTHING left for you to do!! Make your appointment today!!
Key facts
- New kitchen
- Shed
- Gazebo
Tags
Neighborhood map
What this means for you Summary
Snapshot
- This is a 2-bed/1.0-bath manufactured listed at $87k. Condition is rated good.
Deal economics
- At list price, monthly cash flow is $450 ($5k/yr) — positive.
- The deal already cash-flows at list — no discount required.
- Meets the 1% rule at list price ($2k rent vs $87k).
- Recommended offer: $79k (9.0% below list) — sets the bar for market timing.
- Cap rate 12.5% vs local median 5.9% in Gold Key Lake — top-decile yield for the area; either an underpriced asset or a hidden risk that comps aren't pricing in. Stress-test before assuming the spread holds.
Location & tenants
- Location reads 70/100 on livability (#789 in PA) — a middle-class / working-renter tenant base. Strengths: crime A+, employment A+, housing A+; Watch: schools D, health & safety D, amenities F.
- Delaware Valley SD (rural): math 41% / reading 66% proficiency, ranked #121 of 539 in PA (top 22%) — acceptable for families but not a draw, mixed tenant base, ~2y average lease.
- Market conditions: 112 active listings in the ZIP; 213 units permitted in Pike County in 2024 (0 in 5+ unit buildings).
Forward outlook
- In year one you build about $9k of equity ($601 loan paydown + $9k appreciation (10.0% local appreciation)).
- Pike County population projected at -25% by 2050 — secular population decline; favor cash flow + early exit over multi-decade hold.
- At projected returns (10.0% appreciation + 3.0% rent growth), your $24k cash investment doubles in ~2 years — after that, you're playing with house money.
- By year 4, paydown + projected appreciation supports a ~$33k cash-out refi (75% LTV) — recoverable capital for the next deal without selling this one.
Negotiation context
- It's been on market 105 days — a 9% lower offer ($79k) is reasonable based on typical stale-listing flexibility.
Risks & watch-outs
- Climate carrying-cost: major wildfire risk — expect insurance premiums to compound above CPI over the hold.
Questions for the listing agent
- It's been on market 105 days. Have you received any prior offers? Is the seller open to a 9% concession, seller financing, or rate buy-down credit?
- What does the HOA fee cover, when was the last increase, and are there any pending special assessments or reserve-fund shortfalls?
- Why hasn't it sold? Are there any deal-killer items the seller is aware of (foundation, flood, title, zoning, code violations)?
- Is there a deadline driving the sale (1031 exchange, divorce, estate, relocation)? That informs how much negotiation room exists.
- Schools are D-rated, which usually means shorter tenancies and higher turnover. Who's the typical renter profile here, and what's been the actual vacancy rate?
- What's the average days-on-market for RENTAL listings here right now (not sales)? A rising rental-DOM trend means longer vacancies and softer asking-rent achievability than the comps imply.
- What's the recent tenant-quality profile in this submarket — average credit score on applications, eviction rate, late-payment / NSF rate, and stable-employment percentage? A property-management company in the area should have these aggregated.
- How much new for-sale + rental construction is in the pipeline within 1–3 miles? Heavy new supply typically softens prices + rents 12–24 months out; constrained supply supports both.
Investment metrics
- 1% rule
- 1.77% ✓
- Cap rate
- 12.49%
- Cash-on-cash
- 22.15%
- DSCR
- 1.99
- GRM
- 4.7
CMA / ARV
- ARV (median comp)
- $41,482
- List price
- $87,000
- Delta
- 109.73%
- Verdict
- OVERPRICED
- Comps
- 7 within 1.0 mi
Show comp detail 12 sales within ~0.75 mi
| Address | Dist | Beds/Ba | Sqft | Sold | Price | $/sf | Match |
|---|---|---|---|---|---|---|---|
| 142 Commanche Dr Lot 5613 | 0.05mi | 2/1.0 | 700 (0%) | 14mo | $40,000 | $57 | 86 |
| 133 Crow Ln | 0.07mi | 2/1.0 | 700 (0%) | 17mo | $52,000 | $74 | 83 |
| Lot 4918 Mohican Dr | 0.15mi | 1/1.0 (-1) | 700 (0%) | 9mo | $45,000 | $64 | 81 |
| 165 Tribes Dr | 0.32mi | 2/1.0 | 700 (0%) | 12mo | $48,000 | $69 | 75 |
| 125 Tribes Dr Lot 5302 | 0.32mi | 1/1.0 (-1) | 700 (0%) | 10mo | $34,000 | $49 | 72 |
| 226 Shohola Parkway Pkwy Lot 954 | 0.42mi | 2/1.0 | 700 (0%) | 12mo | $80,000 | $114 | 70 |
| 5133 Mohican Ln Lot 5133 | 0.16mi | 1/1.0 (-1) | 700 (0%) | 22mo | $25,000 | $36 | 69 |
| 3431 Dakota Ln | 0.40mi | 1/1.0 (-1) | 700 (0%) | 12mo | $39,750 | $57 | 67 |
| 128 Navajo Ln | 0.57mi | 2/1.0 | 700 (0%) | 15mo | $22,000 | $31 | 61 |
| 105 Owego Ln | 0.42mi | 1/1.0 (-1) | 700 (0%) | 23mo | $38,000 | $54 | 56 |
| 237 Shohola Pkwy N | 0.36mi | 2/1.0 | 600 (-14%) | 17mo | $35,000 | $58 | 45 |
| 1944 Cardinal Ln Lot 1944 | 0.45mi | 2/1.0 | 600 (-14%) | 21mo | $38,000 | $63 | 38 |
Match score weights: distance 35% · size 25% · config 20% · recency 20%. Top-matched comps best support the ARV.
Projected returns pro-forma
10.0% appreciation · 3.0% rent growth · sell at horizon
- IRR
- 40.9%
- Equity multiple
- 4.13×
- Total profit
- $76,138
- Equity at exit
- $78,376
- IRR
- 35.3%
- Equity multiple
- 9.29×
- Total profit
- $201,944
- Equity at exit
- $169,022
Cash invested: $24,360 (down + closing). Projections, not guarantees.
Landlord ↔ Tenant lean methodology
- Overall (STATE)
- 62 Landlord-Friendly
- State Pennsylvania
- 62 Landlord-Friendly · EVEN
- County
- — inherits STATE
- City
- — inherits STATE
ZIP-level market 18458
- Home prices YoY
- 13.2%
- Active inventory
- 112
- Price-to-rent
- 4.7×
Monthly cashflow live
- Estimated rent
- $1,536 medium interval (Pro) →
- Mortgage (P&I)
- −$456
- Tax est. 1.5%
- −$109 /mo · $1,305/yr
- Insurance
- −$36
- HOA
- −$163
- Vacancy / Maint / Mgmt
- −$323
- Net cashflow
- $450
Break-even live
UW: 25.0% down · 7.5% · 30yr · 1.5% tax · 5.0% vac · 8.0% maint · 8.0% mgmt
Financing live
Cash to close
- Down payment
- $21,750
- Closing costs
- $2,610
- Reserves months
- —
- Total cash needed
- —
Loan-product check · same deal, 3 products live
Conventional
25% down · 7.5% · 30yr
- Down + closing
- —
- Monthly P&I
- —
- Monthly cashflow
- —
- DSCR
- —
- Eligible?
- —
Personal DTI + credit; lowest rate.
DSCR
20% down · 8.5% · 30yr
- Down + closing
- —
- Monthly P&I
- —
- Monthly cashflow
- —
- DSCR
- —
- Eligible?
- —
No personal income docs; deal must DSCR.
Hard money
10% down · 12.0% · 12mo
- Down + closing
- —
- Monthly P&I
- —
- Monthly cashflow
- —
- DSCR
- —
- Eligible?
- —
Short-term bridge; refi at stabilization.
HOA detail
- Monthly dues
- $163 · $1,956/yr
Listing history 15 events
-
2026-06-18days on market $87,000 Active 105 DOM
-
2026-06-17days on market $87,000 Active 104 DOM
-
2026-06-16days on market $87,000 Active 103 DOM
-
2026-06-15days on market $87,000 Active 102 DOM
-
2026-06-13days on market $87,000 Active 100 DOM
-
2026-06-13days on market $87,000 Active 99 DOM
-
2026-06-09days on market $87,000 Active 96 DOM
-
2026-06-08days on market $87,000 Active 95 DOM
-
2026-06-07days on market $87,000 Active 94 DOM
-
2026-06-04days on market $87,000 Active 91 DOM
-
2026-06-03days on market $87,000 Active 90 DOM
-
2026-06-02days on market $87,000 Active 89 DOM
-
2026-06-01days on market $87,000 Active 88 DOM
-
2026-05-31days on market $87,000 Active 87 DOM
-
2026-03-05$87,000 Active 337-char remark
Show marketing remark (337 chars)
Perfect spot to enjoy nature and the amenities in Trails End!!! This spotless, completely remodeled vacation trailer features new kitchen, 2 FULL bedrooms, beautiful bathroom, fully enclosed porch, graveled lot, shed and gazebo!! You couldn't ask for more. Impeccably kept, with NOTHING left for you to do!! Make your appointment today!!
ⓘ Source: listings_history table (triggers on properties + properties_extension) + one-shot
backfill from property_details.listing_events for pre-trigger history.
Climate risk First Street
- Flood 1/10 Low FEMA zone X (unshaded) · 0% chance over 30 yrs
- Wildfire 6/10 Major
- Heat 2/10 Low 7 d/yr ≥91°F today · 15 d/yr by 30 yrs out
- Wind 3/10 Moderate 6% chance of damaging wind over 30 yrs
- Air quality 2/10 Low 1 unhealthy d/yr today · 2 by 30 yrs out
Nearby sold comps map
Loading sold comps map…
Walkable amenities ~0.75 mi
Loading nearby amenities…
Taxation est. · year 1
- Rental income
- $18,437
- − Mortgage interest
- −$4,873
- − Property taxes
- −$1,305
- − Insurance
- −$435
- − Repairs & maintenance
- −$1,475
- − Management
- −$1,475
- − HOA
- −$1,956
- − Depreciation
- −$2,531
- Taxable income
- $4,387
- Est. tax owed @ 24.0%
- −$1,053
- After-tax cash flow
- $4,342/yr
For passive investors: Depreciation is non-cash, so a rental often shows a tax loss while cash-flowing — sheltering income. Rental losses are passive: they offset passive income freely, and up to $25,000/yr can offset ordinary (W-2) income if you actively participate and your MAGI is under $100k (phasing out to $0 by $150k); unused losses carry forward. On sale, claimed depreciation is recaptured at up to 25%, and gains may owe capital-gains tax (a 1031 exchange can defer both). Figures are a year-1 estimate at your 24.0% rate — not tax advice; consult a CPA.
Condition & rehab AI · 13 photos
This completely remodeled vacation trailer is in good condition with new kitchen and flooring, and a well-maintained exterior. It's ready for immediate occupancy and would benefit from a fresh coat of paint and some landscaping to further enhance its curb appeal.
Value-add opportunities
- Resale Paint exterior — Enhances curb appeal and property value
- Resale Clean windows — Improves natural light and property value
- Both Landscaping — Enhances curb appeal and property value
- Rental Replace outdoor furniture — Improves rental appeal and comfort
Renovation cost estimate screening
Value-add ROI direction
- Resale Paint exterior — Enhances curb appeal and property value ↑
- Resale Clean windows — Improves natural light and property value ↑
- Both Landscaping — Enhances curb appeal and property value ↑
- Rental Replace outdoor furniture — Improves rental appeal and comfort ↑
ⓘ Cost ranges are severity-bucket heuristics (US national rule-of-thumb). Get contractor quotes + a written scope before underwriting a rehab budget.
Schools (NCES district)
- District
- Delaware Valley SD
- NCES district ID
- 4207530
- Math proficiency
- 41% ▼ -12.00%
- Reading proficiency
- 66% ▼ -9.00%
- Median HH income
- $64,202
- Composite
- 46.95/100
- National rank
- #2359
- State rank
- #121 of 539 in PA
Livability — Gold Key Lake
- Score
- 70/100
- State rank
- #789
- US rank
- #7969
Category grades
Schools grade is shown separately in the Schools card above.
Census & demographics
- Population (ZIP)
- 3,576
Population outlook (Pike County) Hauer SSP2
- Today (2025)
- 53,548 people
- By 2030
- 51,622 · -3.6%
- By 2040
- 46,490 · -13.2%
- By 2050
- 40,372 · -24.6%
- By 2075
- 31,951 · -40.3%
- By 2100
- 26,821 · -49.9%
Race, ethnicity, and origin ACS 2023
- Neighborhood character
- Predominantly White (93%)
- Race & ethnicity
- White 93% Two or more races 4% Hispanic / Latino 3% Asian 1%
- Common ancestry
- Romanian 7% Lithuanian 2% Serbian 1%
- Foreign-born
- 3% · Canada
- Languages at home
- 95% English-only · German/W. Germanic 2% Spanish 2% Other Indo-European 1%
Political lean MEDSL · Pike
- 2024 margin
- Strong R (+24.1) · D 37.6% · R 61.6%
- 2008→2024 swing
- -19.8pp toward R · 2008: -4.2pp · 2024: -24.1pp
- All cycles
- 2024: R+24.1 2020: R+19.0 2016: R+26.0 2012: R+11.0 2008: R+4.2
Not yet ingested
- Civics
- —
Market trends
- HPI YoY
- ▲ 31.80%
- Current HPI
- 272.6294
- Rent YoY
- —
- Metro
- —
- State GDP YoY
- ▲ 1.68%
- F500 in state
- 34
Industry mix (Fortune 500 HQ in PA)
| Industry | F500 HQs | Revenue |
|---|---|---|
| Healthcare | 2 | $309B |
|
||
| Insurance | 2 | $27B |
|
||
| Telecommunications / Media | 1 | $124B |
|
||
| Industrial Distribution | 1 | $22B |
|
||
| Financial Services | 1 | $20B |
|
||
| Chemicals / Materials | 1 | $18B |
|
||
Price history
1 event — show timeline
- 2026-03-05 Listed $87,000 PWMLS
Cash-flow waterfall
monthlySold comps — $/sqft
last 12 mo · ≤1 miLoading sold comps…