 Triplex
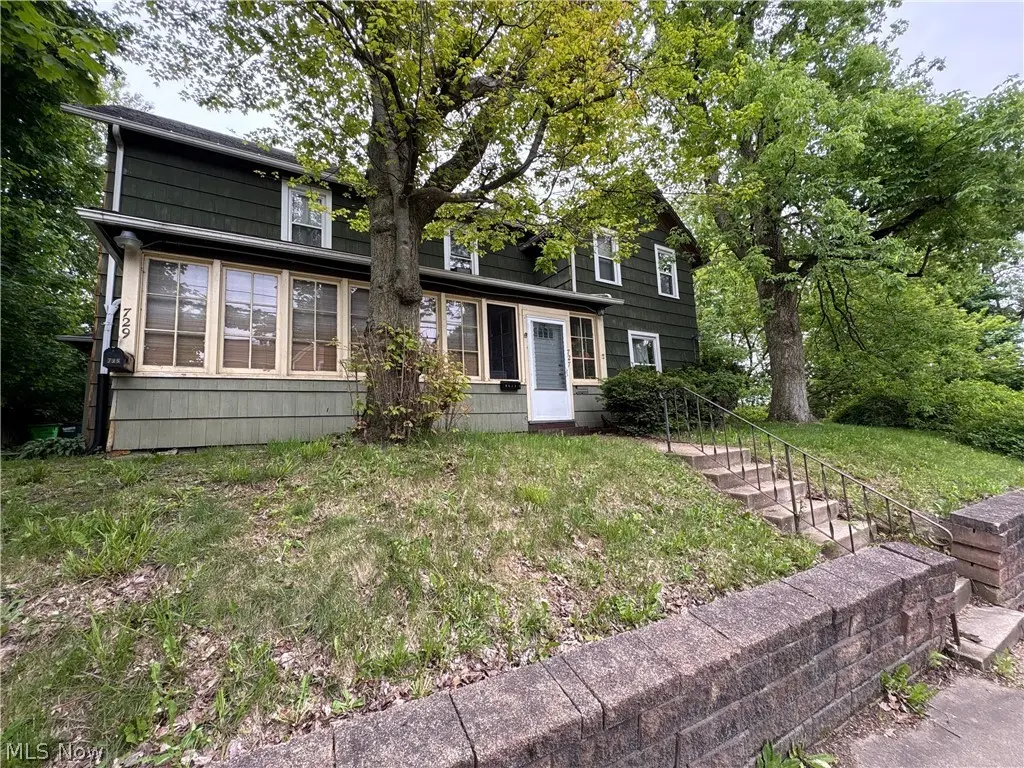
727 Wooster Rd N · Barberton, OH
Flood risk 1/10 · Minimal
- FEMA flood zone
- X (unshaded)
- Chance of flooding over 30 yrs
- 0.0%
- Est. flood insurance / yr
- $473 – $860
Fire risk 1/10 · Minimal
- Est. fire insurance / yr
- $713 – $1,323
Heat risk 3/10 · Minor
- Hot days now (above 97°F)
- 7 days/yr
- Hot days in 30 yrs
- 17 days/yr
Wind risk 1/10 · Minimal
- Chance of severe wind over 30 yrs
- —
Air-quality risk 2/10 · Minimal
- Unhealthy air days now
- 0 days/yr
- Unhealthy air days in 30 yrs
- 1 days/yr
Risk factors via First Street. Map © Google.
Why this score? — see what drove the B+ grade
The composite is a weighted blend of 9 inputs, each scored 0–100. Each bar is that input's sub-score; the figure is the points it added to the 100-point composite (weight × sub-score).
- Cash flow +30.0/30.0
- ARV discount +15.0/15.0
- 1% rule +10.0/10.0
- DSCR +10.0/10.0
- Schools +4.1/10.0
- Rent growth +4.0/5.0
- Livability +3.6/5.0
- Condition / age +2.5/5.0
- Appreciation +0.0/10.0
$169,900
🖨 Deal sheet 📄 Offer letter ✓ Due diligence
Multi-family units
County records classify this as Multi-Family (2-4 Unit). Listing-text estimate: 3 units. confirmed
Listing remarks MLS
Owners lived in main house for over 60 years and rented out one unit. 1952 addition was added - second parcel is on Coventry Rd. 729 Small unit- 1 bedroom, dining room, kitchen and 1 bath. Entrance on side of house.
Key facts
- Newer furnace
- 0.45 acre lot
- Built 1913
Tags
Property features AI
Exterior
- Parking: Private gravel parking
- Utilities: Public water; Public sewer
- Home design: 2-story property
- Construction: Asphalt shingle roof; Built according to public records
- Exterior features: Gravel private parking area
Interior
- Bedrooms: Total of 11 rooms (includes bedrooms and living spaces)
- Bathrooms: 3 full bathrooms
- Heating & cooling: Central air conditioning; Forced air heating (gas)
- Interior features: Updated/remodeled condition; Full unfinished walk-up basement
Neighborhood map
What this means for you Summary
Snapshot
- This is a 1×4bd/2.0ba + 1×1bd/1.0ba + 1×?bd/1.0ba units multifamily listed at $170k.
Deal economics
- At list price, monthly cash flow is $2k ($21k/yr) — positive. Per door: $572/mo.
- The deal already cash-flows at list — no discount required.
- Meets the 1% rule at list price ($3k rent vs $170k).
- Recommended offer: $167k (1.5% below list) — sets the bar for market timing.
- Cap rate 18.4% vs local median 6.2% in Barberton — top-decile yield for the area; either an underpriced asset or a hidden risk that comps aren't pricing in. Stress-test before assuming the spread holds.
Location & tenants
- Location reads 71/100 on livability (#428 in OH) — a middle-class / working-renter tenant base. Strengths: cost of living A+, housing A+, health & safety A+; Watch: crime C-, amenities F, commute F.
- Barberton City (suburban): math 47% / reading 51% proficiency, ranked #466 of 656 in OH (top 71%) — families likely to look elsewhere, expect single-tenant / working-renter base with shorter leases; 62% free/reduced lunch — lower-income household profile, screen leases tightly.
- Market conditions: Rents rising fast (+5.9%/yr); 219 active listings in the ZIP; 1,114 units permitted in Summit County in 2024 (397 in 5+ unit buildings).
- At $3,495/mo this rent would consume 66% of the median local household income ($64k/yr) (locally 805% of renters already pay >50% of income on rent) — very limited rent-growth headroom before tenants either downsize or default.
Forward outlook
- Local home prices are declining (-3.0%/yr); year-one equity from $1k of loan paydown is wiped out by about $5k of value loss. Plan a longer hold.
- Summit County population projected to shrink 6% by 2050 — rents likely to lag national; underwrite the cash flow, not the appreciation.
- At projected returns (-3.0% appreciation + 5.9% rent growth), your $48k cash investment doubles in ~3 years — after that, you're playing with house money.
Negotiation context
- It's been on market 24 days — a 2% lower offer ($167k) is reasonable based on typical stale-listing flexibility.
- 3 sale attempts since 35y ago with the ask held roughly flat each time — persistent listings suggest the price (not the market) is what's stuck; bring a comps-based counter.
- Current owner paid $100k; list at $170k implies a 70% gain — meaningful room to come down on a strong offer.
Risks & watch-outs
- Watch-outs: built in 1913 — expect roof / HVAC / electrical / plumbing capex.
Questions for the listing agent
- Can we see the unit-by-unit rent roll, current vacancy, and any below-market leases? What's the average tenancy length?
- What capital expenditures (roof, boiler, parking lot, exteriors) have been made in the last 5 years, and what's planned in the next 2?
- Built in 1913 — when were the roof, HVAC, electrical panel, plumbing, and water heater last replaced?
- Is there a deadline driving the sale (1031 exchange, divorce, estate, relocation)? That informs how much negotiation room exists.
- What's the average days-on-market for RENTAL listings here right now (not sales)? A rising rental-DOM trend means longer vacancies and softer asking-rent achievability than the comps imply.
- What's the recent tenant-quality profile in this submarket — average credit score on applications, eviction rate, late-payment / NSF rate, and stable-employment percentage? A property-management company in the area should have these aggregated.
- How much new apartment / multifamily construction is in the pipeline within 1–3 miles? Heavy new supply (>2% of stock underway) typically softens rents 12–24 months out; light construction supports rent growth.
Investment metrics
- 1% rule
- 2.06% ✓
- Cap rate
- 18.42%
- Cash-on-cash
- 43.31%
- DSCR
- 2.93
- GRM
- 4.1
CMA / ARV
- ARV (on-the-fly)
- $252,056
- Comps found
- 1
Show comp detail 1 sale within ~0.75 mi
| Address | Dist | Beds/Ba | Sqft | Sold | Price | $/sf | Match |
|---|---|---|---|---|---|---|---|
| 720-722 Newton St | 0.37mi | 5/3.0 | 2,352 (-9%) | 0mo | $230,000 | $98 | 68 |
Match score weights: distance 35% · size 25% · config 20% · recency 20%. Top-matched comps best support the ARV.
Projected returns pro-forma
-3.0% appreciation · 5.86% rent growth · sell at horizon
- IRR
- 43.2%
- Equity multiple
- 2.94×
- Total profit
- $92,144
- Equity at exit
- $25,333
- IRR
- 50.5%
- Equity multiple
- 6.59×
- Total profit
- $265,960
- Equity at exit
- $14,690
Cash invested: $47,572 (down + closing). Projections, not guarantees.
Landlord ↔ Tenant lean methodology
- Overall (STATE)
- 73 Landlord-Friendly
- State Ohio
- 73 Landlord-Friendly · R+6
- County
- — inherits STATE
- City
- — inherits STATE
ZIP-level market 44203
- Rents YoY
- 5.9%
- Active inventory
- 219
- Price-to-rent
- 9.0×
Monthly cashflow live
- Estimated rent
- $3,495 medium interval (Pro) →
- Mortgage (P&I)
- −$891
- Tax from tax record
- −$82 /mo · $987/yr
- Insurance
- −$71
- HOA
- −$0
- Vacancy / Maint / Mgmt
- −$734
- Net cashflow
- $1,717
Break-even live
3-unit breakdown (identical units grouped — click to expand)
| Units | Beds | Baths | Est. rent |
|---|---|---|---|
| 1× unit | 4 | 2 | $1,568 |
| 1× unit | 1 | 1 | $944 |
| 1× unit | 0 | 1 | $983 |
| Total (3 units) | $3,495 | ||
UW: 25.0% down · 7.5% · 30yr · 1.5% tax · 5.0% vac · 8.0% maint · 8.0% mgmt
Financing live
Cash to close
- Down payment
- $42,475
- Closing costs
- $5,097
- Reserves months
- —
- Total cash needed
- —
Loan-product check · same deal, 3 products live
Conventional
25% down · 7.5% · 30yr
- Down + closing
- —
- Monthly P&I
- —
- Monthly cashflow
- —
- DSCR
- —
- Eligible?
- —
Personal DTI + credit; lowest rate.
DSCR
20% down · 8.5% · 30yr
- Down + closing
- —
- Monthly P&I
- —
- Monthly cashflow
- —
- DSCR
- —
- Eligible?
- —
No personal income docs; deal must DSCR.
Hard money
10% down · 12.0% · 12mo
- Down + closing
- —
- Monthly P&I
- —
- Monthly cashflow
- —
- DSCR
- —
- Eligible?
- —
Short-term bridge; refi at stabilization.
Listing history 20 events
-
2026-06-15status $169,900 Pending 24 DOM
-
2026-06-15days on market $169,900 Active 24 DOM
-
2026-06-14days on market $169,900 Active 22 DOM
-
2026-06-10days on market $169,900 Active 19 DOM
-
2026-06-09days on market $169,900 Active 18 DOM
-
2026-06-08days on market $169,900 Active 17 DOM
-
2026-06-07days on market $169,900 Active 16 DOM
-
2026-06-03days on market $169,900 Active 12 DOM
-
2026-06-02days on market $169,900 Active 11 DOM
-
2026-06-01days on market $169,900 Active 10 DOM
-
2026-05-31days on market $169,900 Active 9 DOM
-
2026-05-31days on market $169,900 Active 8 DOM
-
2026-05-22$169,900 Active
-
2024-12-16soldstatus $100,000
-
2017-10-11soldstatus $20,000 Sold 215-char remark
Show marketing remark (215 chars)
Owners lived in main house for over 60 years and rented out one unit. 1952 addition was added - second parcel is on Coventry Rd. 729 Small unit- 1 bedroom, dining room, kitchen and 1 bath. Entrance on side of house.
-
2017-10-11soldstatus $20,000
Show marketing remark (215 chars)
Owners lived in main house for over 60 years and rented out one unit. 1952 addition was added - second parcel is on Coventry Rd. 729 Small unit- 1 bedroom, dining room, kitchen and 1 bath. Entrance on side of house.
-
2017-10-05status Pending 215-char remark
Show marketing remark (215 chars)
Owners lived in main house for over 60 years and rented out one unit. 1952 addition was added - second parcel is on Coventry Rd. 729 Small unit- 1 bedroom, dining room, kitchen and 1 bath. Entrance on side of house.
-
2017-08-21$39,900 Active 215-char remark
Show marketing remark (215 chars)
Owners lived in main house for over 60 years and rented out one unit. 1952 addition was added - second parcel is on Coventry Rd. 729 Small unit- 1 bedroom, dining room, kitchen and 1 bath. Entrance on side of house.
-
1992-05-30historical
-
1991-12-03$59,500
ⓘ Source: listings_history table (triggers on properties + properties_extension) + one-shot
backfill from property_details.listing_events for pre-trigger history.
Tax reassessment forecast OH · Partial reset (capped growth)
- Current annual tax
- $987 · $82/mo
- Projected year-2 tax
- $1,819 · $152/mo
- Expected delta
- +$832/yr (+$69/mo · 84.2%)
ⓘ Screening estimate from a state-policy table — verify with the county assessor before closing.
Climate risk First Street
- Flood 1/10 Low FEMA zone X (unshaded) · 0% chance over 30 yrs
- Wildfire 1/10 Low
- Heat 3/10 Moderate 7 d/yr ≥97°F today · 17 d/yr by 30 yrs out
- Wind 1/10 Low
- Air quality 2/10 Low 0 unhealthy d/yr today · 1 by 30 yrs out
Nearby sold comps map
Loading sold comps map…
Walkable amenities ~0.75 mi
Loading nearby amenities…
Taxation est. · year 1
- Rental income
- $41,940
- − Mortgage interest
- −$9,517
- − Property taxes
- −$987
- − Insurance
- −$850
- − Repairs & maintenance
- −$3,355
- − Management
- −$3,355
- − Depreciation
- −$4,943
- Taxable income
- $18,933
- Est. tax owed @ 24.0%
- −$4,544
- After-tax cash flow
- $16,060/yr
For passive investors: Depreciation is non-cash, so a rental often shows a tax loss while cash-flowing — sheltering income. Rental losses are passive: they offset passive income freely, and up to $25,000/yr can offset ordinary (W-2) income if you actively participate and your MAGI is under $100k (phasing out to $0 by $150k); unused losses carry forward. On sale, claimed depreciation is recaptured at up to 25%, and gains may owe capital-gains tax (a 1031 exchange can defer both). Figures are a year-1 estimate at your 24.0% rate — not tax advice; consult a CPA.
Schools (NCES district)
- District
- Barberton City
- NCES district ID
- 3904353
- Math proficiency
- 47% ▼ -9.00%
- Reading proficiency
- 51% ▼ -9.00%
- Median HH income
- $37,660
- Composite
- 40.77/100
- National rank
- #3646
- State rank
- #466 of 656 in OH
Livability — Barberton
- Score
- 71/100
- State rank
- #428
- US rank
- #7016
Category grades
Schools grade is shown separately in the Schools card above.
Census & demographics
- Census place
- Barberton, OH
- County
- Summit County · 440,783 people
- City population
- 38,701
- Metro
- Akron, OH
- Population (ZIP)
- 38,701
- Household income
- $63,759
- Rent vs Own
- Severe rent burden
- 805.0
Population outlook (Summit County) Hauer SSP2
- Today (2025)
- 546,583 people
- By 2030
- 544,028 · -0.5%
- By 2040
- 531,363 · -2.8%
- By 2050
- 514,923 · -5.8%
- By 2075
- 481,765 · -11.9%
- By 2100
- 432,265 · -20.9%
Race, ethnicity, and origin ACS 2023
- Neighborhood character
- Predominantly White (86%)
- Race & ethnicity
- White 86% Black 7% Two or more races 5% Hispanic / Latino 1%
- Common ancestry
- Romanian 3% Slovak 2% Italian 1%
- Foreign-born
- 2% · Canada
- Languages at home
- 97% English-only · Russian/Polish/Slavic 1% Spanish 1%
Political lean MEDSL · Summit
- 2024 margin
- Lean D (+7.0) · D 53.0% · R 46.0%
- 2008→2024 swing
- -9.6pp toward R · 2008: 16.6pp · 2024: 7.0pp
- All cycles
- 2024: D+7.0 2020: D+9.6 2016: D+8.2 2012: D+14.8 2008: D+16.6
Not yet ingested
- Civics
- —
Market trends
- HPI YoY
- ▼ -224.82%
- Current HPI
- 199.8143
- Rent YoY
- ▲ 5.86%
- Metro
- Akron, OH
- State GDP YoY
- ▲ 1.98%
- F500 in state
- 48
Industry mix (Fortune 500 HQ in OH)
| Industry | F500 HQs | Revenue |
|---|---|---|
| Insurance | 3 | $145B |
|
||
| Industrial Machinery | 3 | $49B |
|
||
| Financial Services | 3 | $24B |
|
||
| Consumer Goods | 2 | $93B |
|
||
| Aerospace / Defense | 2 | $47B |
|
||
| Utilities | 2 | $33B |
|
||
Price history
+185.5% since first listed8 events — show timeline
- 2026-05-22 Listed $169,900 MLSNOW
- 2024-12-16 Sold (Public Records) $100,000 Public Records
- 2017-10-11 Sold (Public Records) $20,000 Public Records
- 2017-10-11 Sold (MLS) $20,000 MLSNOW
- 2017-10-05 Pending — MLSNOW
- 2017-08-21 Listed $39,900 MLSNOW
- 1992-05-30 Listing Removed — MLSNOW
- 1991-12-03 Listed $59,500 MLSNOW
Property tax history
-1.7%/yrLatest (2025): $987 · -2.1% YoY. Source: county tax records.
Cash-flow waterfall
monthlySold comps — $/sqft
last 12 mo · ≤1 miLoading sold comps…