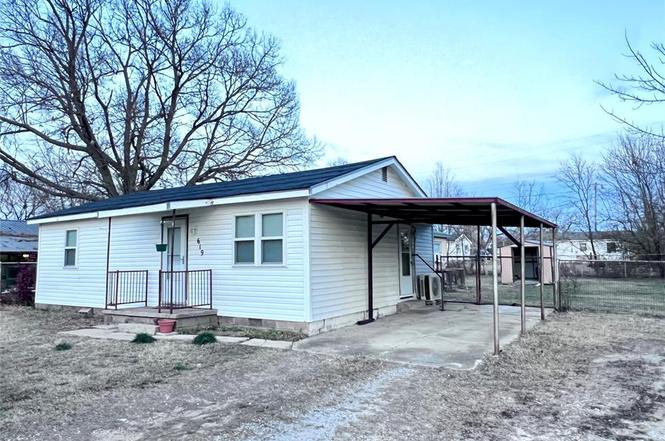
619 N Hyden St · Stratford, OK
Flood risk 1/10 · Minimal
- FEMA flood zone
- X (unshaded)
- Chance of flooding over 30 yrs
- 0.0%
- Est. flood insurance / yr
- $507 – $1,088
Fire risk 7/10 · Major
- Est. fire insurance / yr
- $2,463 – $4,575
Heat risk 5/10 · Moderate
- Hot days now (above 108°F)
- 7 days/yr
- Hot days in 30 yrs
- 19 days/yr
Wind risk 4/10 · Minor
- Chance of severe wind over 30 yrs
- 10.0%
Air-quality risk 2/10 · Minimal
- Unhealthy air days now
- 1 days/yr
- Unhealthy air days in 30 yrs
- 1 days/yr
Risk factors via First Street. Map © Google.
Why this score? — see what drove the B- grade
The composite is a weighted blend of 9 inputs, each scored 0–100. Each bar is that input's sub-score; the figure is the points it added to the 100-point composite (weight × sub-score).
- Cash flow +24.9/30.0
- ARV discount +10.9/15.0
- DSCR +8.1/10.0
- Appreciation +7.8/10.0
- 1% rule +6.5/10.0
- Livability +3.1/5.0
- Rent growth +2.5/5.0
- Condition / age +2.5/5.0
- Schools +2.0/10.0
$74,000
🖨 Deal sheet (PDF) 📄 Offer letter ✓ Due diligence
Listing remarks
Charming and Move-In Ready, 2 bedroom, 1 bath home with a new roof and mini split, perfect for first-time buyers or investors! This adorable property features a carport and a large fenced-in backyard, ideal for your pets or kids. Enjoy the convenience of being within walking distance to school and little league ball fields. Additional highlights include a storage shed for your tools or equipment, as well as an outbuilding that would make a great workspace, man-cave/she-shed, or even a tiny home. Don't miss out on this one!
Key facts
- Carport
- Storage shed
- Mini split
Tags
Neighborhood map
What this means for you Summary
Snapshot
- This is a 2-bed/1.0-bath single-family listed at $74k.
Deal economics
- At list price, monthly cash flow is $159 ($2k/yr) — positive.
- The deal already cash-flows at list — no discount required.
- Meets the 1% rule at list price ($849 rent vs $74k).
- Recommended offer: $70k (6.0% below list) — sets the bar for market timing.
Location & tenants
- Location reads 61/100 on livability (#291 in OK) — a middle-class / working-renter tenant base. Strengths: cost of living A+, housing A+; Watch: amenities F, commute F, employment F.
- Stratford (rural): math 27% / reading 22% proficiency, ranked #130 of 270 in OK (top 48%) — low school quality limits family demand, transient renter base, plan for 1-2y turnover.
- Zoned schools: Stratford Es (math 22% / reading 17%, grade F, #479 of 845 statewide, top 63%, 307 students, 0% FRL); Stratford Ms (math 27% / reading 22%, grade F, #97 of 345 statewide, top 31%, 139 students, 0% FRL); Stratford Hs (math 34% / reading 44%, grade F, #37 of 447 statewide, top 9%, 186 students, 0% FRL) — zoned schools average 0% FRL vs 54% district-wide (54 pts lower); this property's tenant base skews higher-income than the district average.
- Market conditions: 42 active listings in the ZIP; 1 units permitted in Garvin County in 2024 (0 in 5+ unit buildings).
Forward outlook
- In year one you build about $5k of equity ($512 loan paydown + $4k appreciation (5.5% local appreciation)).
- Garvin County population projected at +8% by 2050 — modest demand growth; plan on rents tracking national, not racing it.
- At projected returns (5.5% appreciation + 3.0% rent growth), your $21k cash investment doubles in ~3 years — after that, you're playing with house money.
- By year 8, paydown + projected appreciation supports a ~$35k cash-out refi (75% LTV) — recoverable capital for the next deal without selling this one.
Negotiation context
- It's been on market 86 days — a 6% lower offer ($70k) is reasonable based on typical stale-listing flexibility.
- 2 sale attempts; this cycle's ask is 6% above the opening price — seller raised mid-cycle; expect resistance to lowballs.
- Current owner paid $18k; list at $74k implies a 323% gain — meaningful room to come down on a strong offer.
Risks & watch-outs
- Watch-outs: built in 1955 — expect roof / HVAC / electrical / plumbing capex.
- Climate carrying-cost: major wildfire risk; extreme-heat days projected 7→19/yr by 2055 (HVAC capex compounding) — expect insurance premiums to compound above CPI over the hold.
Questions for the listing agent
- It's been on market 86 days. Have you received any prior offers? Is the seller open to a 6% concession, seller financing, or rate buy-down credit?
- Built in 1955 — when were the roof, HVAC, electrical panel, plumbing, and water heater last replaced?
- Why hasn't it sold? Are there any deal-killer items the seller is aware of (foundation, flood, title, zoning, code violations)?
- Is there a deadline driving the sale (1031 exchange, divorce, estate, relocation)? That informs how much negotiation room exists.
- Schools are D-rated, which usually means shorter tenancies and higher turnover. Who's the typical renter profile here, and what's been the actual vacancy rate?
- What's the average days-on-market for RENTAL listings here right now (not sales)? A rising rental-DOM trend means longer vacancies and softer asking-rent achievability than the comps imply.
- What's the recent tenant-quality profile in this submarket — average credit score on applications, eviction rate, late-payment / NSF rate, and stable-employment percentage? A property-management company in the area should have these aggregated.
- How much new for-sale + rental construction is in the pipeline within 1–3 miles? Heavy new supply typically softens prices + rents 12–24 months out; constrained supply supports both.
Investment metrics
- 1% rule
- 1.15% ✓
- Cap rate
- 8.88%
- Cash-on-cash
- 9.23%
- DSCR
- 1.41
- GRM
- 7.3
CMA / ARV
- ARV (on-the-fly)
- $79,968
- Comps found
- 3
Show comp detail 3 sales within ~0.75 mi
| Address | Dist | Beds/Ba | Sqft | Sold | Price | $/sf | Match |
|---|---|---|---|---|---|---|---|
| 500 E Smith | 0.43mi | 2/1.0 | 828 (+2%) | 1mo | $81,000 | $98 | 77 |
| 225 E Main St | 0.41mi | 2/1.0 | 816 (0%) | 9mo | $45,000 | $55 | 73 |
| 125 E 1st St | 0.47mi | 3/1.0 (+1) | 912 (+12%) | 15mo | $120,000 | $132 | 41 |
Match score weights: distance 35% · size 25% · config 20% · recency 20%. Top-matched comps best support the ARV.
Projected returns pro-forma
5.54% appreciation · 3.0% rent growth · sell at horizon
- IRR
- 22.0%
- Equity multiple
- 2.43×
- Total profit
- $29,535
- Equity at exit
- $44,401
- IRR
- 21.2%
- Equity multiple
- 4.84×
- Total profit
- $79,538
- Equity at exit
- $78,752
Cash invested: $20,720 (down + closing). Projections, not guarantees.
Landlord ↔ Tenant lean methodology
- Overall (STATE)
- 83 Strongly Landlord-Friendly
- State Oklahoma
- 83 Strongly Landlord-Friendly · R+20
- County
- — inherits STATE
- City
- — inherits STATE
ZIP-level market 74872
- Home prices YoY
- 1.9%
- Active inventory
- 42
- Price-to-rent
- 7.3×
Monthly cashflow live
- Estimated rent
- $849 medium interval (Pro) →
- Mortgage (P&I)
- −$388
- Tax est. 1.5%
- −$92 /mo · $1,110/yr
- Insurance
- −$31
- HOA
- −$0
- Vacancy / Maint / Mgmt
- −$178
- Net cashflow
- $159
Break-even live
Sensitivity live
| Price | -10% $210 | -5% $185 | +0% $159 | +5% $134 | +10% $108 |
|---|---|---|---|---|---|
| Rent | -10% $92 | -5% $126 | +0% $159 | +5% $193 | +10% $226 |
| Rate | -1.0pp $197 | -0.5pp $178 | base $159 | +0.5pp $140 | +1.0pp $121 |
UW: 25.0% down · 7.5% · 30yr · 1.5% tax · 5.0% vac · 8.0% maint · 8.0% mgmt
Financing live
Cash to close
- Down payment
- $18,500
- Closing costs
- $2,220
- Reserves months
- —
- Total cash needed
- —
Loan-product check · same deal, 3 products live
Conventional
25% down · 7.5% · 30yr
- Down + closing
- —
- Monthly P&I
- —
- Monthly cashflow
- —
- DSCR
- —
- Eligible?
- —
Personal DTI + credit; lowest rate.
DSCR
20% down · 8.5% · 30yr
- Down + closing
- —
- Monthly P&I
- —
- Monthly cashflow
- —
- DSCR
- —
- Eligible?
- —
No personal income docs; deal must DSCR.
Hard money
10% down · 12.0% · 12mo
- Down + closing
- —
- Monthly P&I
- —
- Monthly cashflow
- —
- DSCR
- —
- Eligible?
- —
Short-term bridge; refi at stabilization.
Listing history 6 events
-
2026-03-25status Pending
-
2026-02-21status Active
-
2026-02-18status Pending
-
2025-12-28price $74,000
-
2025-12-27$69,900 Active
-
2003-10-02soldstatus $17,500
ⓘ Source: listings_history table (triggers on properties + properties_extension) + one-shot
backfill from property_details.listing_events for pre-trigger history.
Climate risk First Street
- Flood 1/10 Low FEMA zone X (unshaded) · 0% chance over 30 yrs
- Wildfire 7/10 Severe
- Heat 5/10 Major 7 d/yr ≥108°F today · 19 d/yr by 30 yrs out
- Wind 4/10 Moderate 10% chance of damaging wind over 30 yrs
- Air quality 2/10 Low 1 unhealthy d/yr today · 1 by 30 yrs out
Nearby sold comps map
Loading sold comps map…
Walkable amenities ~0.75 mi
Loading nearby amenities…
Taxation est. · year 1
- Rental income
- $10,188
- − Mortgage interest
- −$4,145
- − Property taxes
- −$1,110
- − Insurance
- −$370
- − Repairs & maintenance
- −$815
- − Management
- −$815
- − Depreciation
- −$2,153
- Taxable income
- $780
- Est. tax owed @ 24.0%
- −$187
- After-tax cash flow
- $1,725/yr
For passive investors: Depreciation is non-cash, so a rental often shows a tax loss while cash-flowing — sheltering income. Rental losses are passive: they offset passive income freely, and up to $25,000/yr can offset ordinary (W-2) income if you actively participate and your MAGI is under $100k (phasing out to $0 by $150k); unused losses carry forward. On sale, claimed depreciation is recaptured at up to 25%, and gains may owe capital-gains tax (a 1031 exchange can defer both). Figures are a year-1 estimate at your 24.0% rate — not tax advice; consult a CPA.
Schools (NCES district)
- District
- Stratford
- NCES district ID
- 4028980
- Math proficiency
- 27% ▼ -11.00%
- Reading proficiency
- 22% ▼ -11.00%
- Median HH income
- $35,090
- Composite
- 20.25/100
- National rank
- #8622
- State rank
- #130 of 270 in OK
Livability — Stratford
- Score
- 61/100
- State rank
- #291
- US rank
- #17642
Category grades
Schools grade is shown separately in the Schools card above.
Census & demographics
- Census place
- Stratford, OK
- Population (ZIP)
- 3,102
Population outlook (Garvin County) Hauer SSP2
- Today (2025)
- 28,277 people
- By 2030
- 28,619 · +1.2%
- By 2040
- 29,478 · +4.2%
- By 2050
- 30,384 · +7.5%
- By 2075
- 34,074 · +20.5%
- By 2100
- 36,099 · +27.7%
Race, ethnicity, and origin ACS 2023
- Neighborhood character
- Predominantly White (70%)
- Race & ethnicity
- White 70% Two or more races 18% Native American 8% Hispanic / Latino 5%
- Hispanic origin (detail)
- Mexican 5%
- Common ancestry
- Slovak 4% Italian 3% European 3%
- Foreign-born
- 1% · Canada
- Languages at home
- 97% English-only · Spanish 2%
Political lean MEDSL · Garvin
- 2024 margin
- Solid R (+66.1) · D 16.4% · R 82.5% · Other 1.1%
- 2008→2024 swing
- -22.5pp toward R · 2008: -43.6pp · 2024: -66.1pp
- All cycles
- 2024: R+66.1 2020: R+64.2 2016: R+60.7 2012: R+46.1 2008: R+43.6
Not yet ingested
- Civics
- —
Market trends
- HPI YoY
- ▲ 5.54%
- Current HPI
- 291.1099
- Rent YoY
- —
- Metro
- —
- State GDP YoY
- ▲ 1.55%
- F500 in state
- 6
Industry mix (Fortune 500 HQ in OK)
| Industry | F500 HQs | Revenue |
|---|---|---|
| Energy | 3 | $48B |
|
||
Price history
+322.9% since first listed6 events — show timeline
- 2026-03-25 Pending — MLSOK
- 2026-02-21 Relisted — MLSOK
- 2026-02-18 Pending — MLSOK
- 2025-12-28 Price Changed $74,000 MLSOK
- 2025-12-27 Listed $69,900 MLSOK
- 2003-10-02 Sold (Public Records) $17,500 Public Records
Property tax history
-9.7%/yrLatest (2025): $136 · +2.3% YoY. Source: county tax records.
Cash-flow waterfall
monthlySold comps — $/sqft
last 12 mo · ≤1 miLoading sold comps…