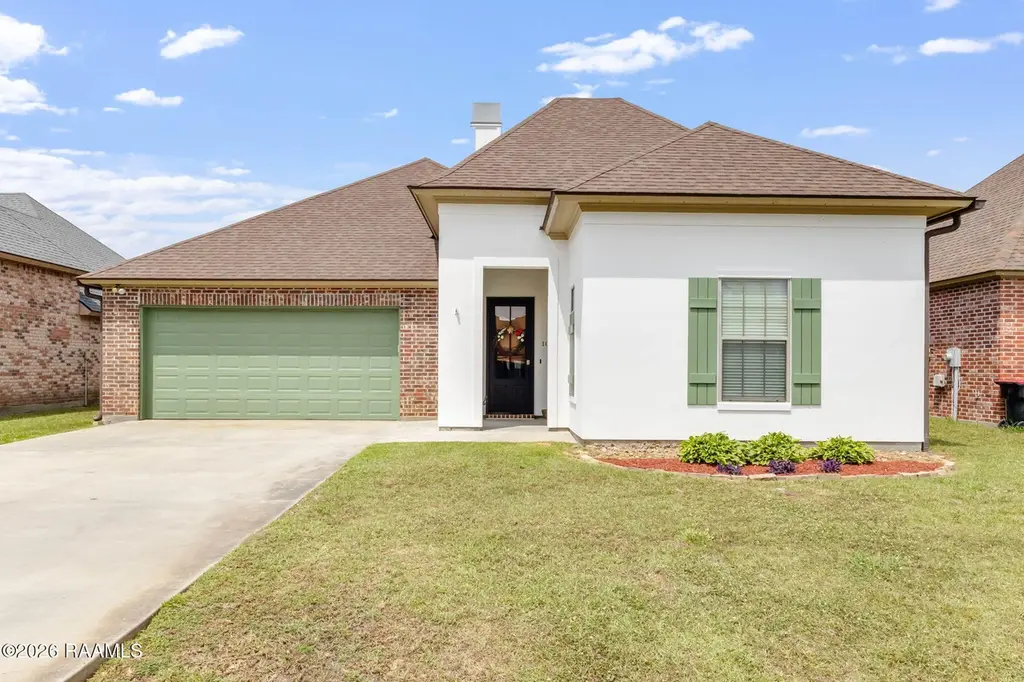
106 Grazing Trce · Lafayette, LA
Flood risk 1/10 · Minimal
- FEMA flood zone
- X (unshaded)
- Chance of flooding over 30 yrs
- 0.0%
- Est. flood insurance / yr
- $507 – $1,088
Fire risk 1/10 · Minimal
- Est. fire insurance / yr
- $1,269 – $2,357
Heat risk 9/10 · Severe
- Hot days now (above 108°F)
- 7 days/yr
- Hot days in 30 yrs
- 22 days/yr
Wind risk 9/10 · Severe
- Chance of severe wind over 30 yrs
- 99.0%
Air-quality risk 1/10 · Minimal
- Unhealthy air days now
- 0 days/yr
- Unhealthy air days in 30 yrs
- 0 days/yr
Risk factors via First Street. Map © Google.
Why this score? — see what drove the D- grade
The composite is a weighted blend of 9 inputs, each scored 0–100. Each bar is that input's sub-score; the figure is the points it added to the 100-point composite (weight × sub-score).
- Cash flow +11.2/30.0
- ARV discount +10.1/15.0
- Schools +3.6/10.0
- Livability +3.5/5.0
- DSCR +3.3/10.0
- Rent growth +2.8/5.0
- 1% rule +2.6/10.0
- Condition / age +2.5/5.0
- Appreciation +0.0/10.0
$260,000
🖨 Deal sheet 📄 Offer letter ✓ Due diligence
Listing remarks
Beautiful 3-bedroom, 2-bath home offering 1,525 sq ft in a highly sought-after neighborhood! This well-maintained property features a fully fenced backyard with a wooden privacy fence, perfect for entertaining or relaxing. Inside, the spacious living room includes a cozy fireplace, while the primary suite offers a double vanity, separate tub and shower, and a walk-in closet. Enjoy outdoor living year-round with a covered back patio complete with its own fireplace. Additional highlights include a 2-car garage, a brand-new HVAC system installed in 2025, freshly painted stucco on the front exterior, and newly painted garage doors and shutters. The roof has also been recently soft washed for ad
Key facts
- Neighborhood pond
- Covered back patio
- 7,405 sq ft lot
Tags
Property features AI
Finance
- HOA & community: Community association with annual fee of $240; Association covers accounting and grounds maintenance; Association provides management and recreation facilities
Exterior
- Parking: Two covered parking spaces; Two total parking spaces; Has garage (2 spaces)
- Utilities: Public/communal sewer; Electric service by Entergy
- Home design: Single family residence; Located on a paved city street; Zoned residential
- Construction: Brick veneer, HardiPlank, stucco, and frame construction; Composition roof
- Exterior features: Outdoor lighting; Covered porch; Pond with walk-to access; Privacy wood fencing
Interior
- Kitchen: Dishwasher; Disposal; Microwave
- Flooring: Carpet; Laminate; Tile
- Bathrooms: Two full bathrooms
- Heating & cooling: Central air conditioning; Central electric heating
- Interior features: High ceilings; Crown molding; Separate shower; Varied ceiling heights; Walk-in closets; Double pane windows; Two wood-burning fireplaces
- Laundry & utility: Electric dryer hookup
Neighborhood map
What this means for you Summary
Snapshot
- This is a 3-bed/2.0-bath single-family listed at $260k.
Deal economics
- At list price, monthly cash flow is $-101 ($-1k/yr) — negative.
- To cash-flow at today's rent, offer at most $242k (6.8% below list).
- To meet the 1% rule (rent ≥ 1% of price), the offer needs to be $198k (24.0% below list).
- Recommended offer: $198k (24.0% below list) — sets the bar for 1% rule.
- Cap rate 5.8% vs local median 4.7% in Lafayette — meaningfully above typical; check what's discounted (condition, days-on-market, listing class) to confirm the premium yield is real.
Location & tenants
- Location reads 70/100 on livability (#63 in LA) — a middle-class / working-renter tenant base. Strengths: cost of living A+, housing A+, health & safety A+; Watch: amenities C-, employment C-, crime F.
- Lafayette Parish (urban): math 38% / reading 46% proficiency, ranked #19 of 98 in LA (top 19%) — families likely to look elsewhere, expect single-tenant / working-renter base with shorter leases.
- Zoned schools: Milton Elementary School (math 49% / reading 64%, grade C+, #86 of 646 statewide, top 13%, 1,332 students, 39% FRL); Southside High School (math 52% / reading 53%, grade C-, #30 of 265 statewide, top 12%, 1,910 students, 39% FRL) — zoned schools average 39% FRL vs 56% district-wide (17 pts lower); this property's tenant base skews higher-income than the district average.
- Zoned-school proficiency averages 54% at this address vs 42% district-wide (+12 pts) — the actual schools serving this property are materially stronger than the Lafayette Parish average implies; a family-tenant draw the district grade alone would hide.
- Market conditions: Rents rising (+1.2%/yr); 464 active listings in the ZIP; 3 comparable units currently listed for rent nearby; rentals lingering (median 44d on market — plan ~5-8 weeks vacancy on turnover, expect pricing pressure); 67% of comp listings sitting > 30 days — soft ceiling on asking rent; solid renter incomes; 1,585 units permitted in Lafayette Parish in 2024 (10 in 5+ unit buildings).
Forward outlook
- Local home prices are declining (-3.0%/yr); year-one equity from $2k of loan paydown is wiped out by about $8k of value loss. Plan a longer hold.
- Lafayette County population projected at +34% by 2050 — long-run rental-demand tailwind backs the buy-and-hold thesis.
Negotiation context
- It's been on market 45 days — a 3% lower offer ($252k) is reasonable based on typical stale-listing flexibility.
- 2 sale attempts since 15y ago with the ask held roughly flat each time — persistent listings suggest the price (not the market) is what's stuck; bring a comps-based counter.
- Current owner paid $132k; list at $260k implies a 97% gain — meaningful room to come down on a strong offer.
Risks & watch-outs
- Climate carrying-cost: severe wind risk, 99% chance of damaging wind over 30y; extreme-heat days projected 7→22/yr by 2055 (HVAC capex compounding) — expect insurance premiums to compound above CPI over the hold.
Questions for the listing agent
- What do current leases actually rent for vs. the listed asking? Can we see a recent rent roll and the last 12 months of T-12 income?
- It's been on market 45 days. Have you received any prior offers? Is the seller open to a 24% concession, seller financing, or rate buy-down credit?
- What does the HOA fee cover, when was the last increase, and are there any pending special assessments or reserve-fund shortfalls?
- Is there a deadline driving the sale (1031 exchange, divorce, estate, relocation)? That informs how much negotiation room exists.
- Schools are B-rated — typically a magnet for longer-tenancy family renters. What's the average tenant stay here, and is there a school-zone premium baked into asking?
- Crime grade is F in this area — have there been break-ins, vandalism, or insurance claims at this property in the last 3 years? What carrier currently insures it and at what premium?
- The area grade is low — what's the realistic commute time and amenity access for the typical tenant pool here? Any planned neighborhood developments (good or bad) we should know about?
- What's the average days-on-market for RENTAL listings here right now (not sales)? A rising rental-DOM trend means longer vacancies and softer asking-rent achievability than the comps imply.
- What's the recent tenant-quality profile in this submarket — average credit score on applications, eviction rate, late-payment / NSF rate, and stable-employment percentage? A property-management company in the area should have these aggregated.
- How much new for-sale + rental construction is in the pipeline within 1–3 miles? Heavy new supply typically softens prices + rents 12–24 months out; constrained supply supports both.
Investment metrics
- 1% rule
- 0.76% ✗
- Cap rate
- 5.83%
- Cash-on-cash
- -1.66%
- DSCR
- 0.93
- GRM
- 11.0
CMA / ARV
- ARV (median comp)
- $275,987
- List price
- $260,000
- Delta
- -5.79%
- Verdict
- FAIR
- Comps
- 20 within 1.0 mi
Show comp detail 12 sales within ~0.75 mi
| Address | Dist | Beds/Ba | Sqft | Sold | Price | $/sf | Match |
|---|---|---|---|---|---|---|---|
| 205 Rivergrass Dr | 0.28mi | 3/2.0 | 1,468 (-5%) | 3mo | $248,000 | $169 | 77 |
| 202 Rivergrass Dr | 0.28mi | 3/2.0 | 1,415 (-8%) | 0mo | $308,000 | $218 | 73 |
| 102 Crenshaw Dr | 0.47mi | 3/2.0 | 1,506 (-2%) | 3mo | $244,000 | $162 | 72 |
| 408 Wetgrass Dr | 0.30mi | 3/2.0 | 1,410 (-8%) | 1mo | $260,000 | $184 | 71 |
| 314 Wetgrass Dr | 0.23mi | 3/2.0 | 1,744 (+13%) | 0mo | $295,000 | $169 | 67 |
| 125 Sojourner Dr | 0.72mi | 3/2.0 | 1,522 (-1%) | 0mo | $284,690 | $187 | 64 |
| 120 Mirada Ln | 0.63mi | 3/2.0 | 1,478 (-4%) | 3mo | $235,000 | $159 | 61 |
| 116 Rougeau Rd | 0.42mi | 3/2.0 | 1,746 (+13%) | 0mo | $118,500 | $68 | 58 |
| 300 Sleepy Brook Rd | 0.33mi | 4/2.0 (+1) | 1,754 (+14%) | 3mo | $292,800 | $167 | 54 |
| 110 Mirada Ln | 0.68mi | 3/2.0 | 1,391 (-10%) | 1mo | $229,500 | $165 | 51 |
| 115 Hacienda Ln | 0.63mi | 3/2.0 | 1,728 (+12%) | 2mo | $250,000 | $145 | 48 |
| 104 Bijou Dr | 0.73mi | 4/2.0 (+1) | 1,684 (+9%) | 2mo | $315,000 | $187 | 44 |
Match score weights: distance 35% · size 25% · config 20% · recency 20%. Top-matched comps best support the ARV.
Projected returns pro-forma
-3.0% appreciation · 1.23% rent growth · sell at horizon
- IRR
- -20.9%
- Equity multiple
- 0.28×
- Total profit
- $-52,062
- Equity at exit
- $38,767
- IRR
- -18.5%
- Equity multiple
- 0.07×
- Total profit
- $-67,509
- Equity at exit
- $22,480
Cash invested: $72,800 (down + closing). Projections, not guarantees.
Landlord ↔ Tenant lean methodology
- Overall (STATE)
- 90 Strongly Landlord-Friendly
- State Louisiana
- 90 Strongly Landlord-Friendly · R+12
- County
- — inherits STATE
- City
- — inherits STATE
ZIP-level market 70508
- Home prices YoY
- -34.7%
- Rents YoY
- 1.2%
- Active inventory
- 464
- Price-to-rent
- 11.0×
Monthly cashflow live
- Estimated rent
- $1,975 medium interval (Pro) →
- Mortgage (P&I)
- −$1,363
- Tax from tax record
- −$169 /mo · $2,033/yr
- Insurance
- −$108
- HOA
- −$20
- Vacancy / Maint / Mgmt
- −$415
- Net cashflow
- $-101
Break-even live
UW: 25.0% down · 7.5% · 30yr · 1.5% tax · 5.0% vac · 8.0% maint · 8.0% mgmt
Financing live
Cash to close
- Down payment
- $65,000
- Closing costs
- $7,800
- Reserves months
- —
- Total cash needed
- —
Loan-product check · same deal, 3 products live
Conventional
25% down · 7.5% · 30yr
- Down + closing
- —
- Monthly P&I
- —
- Monthly cashflow
- —
- DSCR
- —
- Eligible?
- —
Personal DTI + credit; lowest rate.
DSCR
20% down · 8.5% · 30yr
- Down + closing
- —
- Monthly P&I
- —
- Monthly cashflow
- —
- DSCR
- —
- Eligible?
- —
No personal income docs; deal must DSCR.
Hard money
10% down · 12.0% · 12mo
- Down + closing
- —
- Monthly P&I
- —
- Monthly cashflow
- —
- DSCR
- —
- Eligible?
- —
Short-term bridge; refi at stabilization.
Rent comps 3 comps
| Address | Beds | Baths | Sqft | Rent | $/sqft | DOM | Units | Dist |
|---|---|---|---|---|---|---|---|---|
| 204 Crenshaw Dr Lafayette, LA | 3.0 | 2.0 | 1337 | $2,150 | $1.61 | 21d | 1 | 0.42mi |
| 103 Bijou Dr Lafayette, LA | 3.0 | 2.0 | 1522 | $2,100 | $1.38 | 43d | 1 | 0.73mi |
| 114 Gadwall Dr Youngsville, LA | 2.0 | 2.5 | 1305 | $1,800 | $1.38 | 43d | 1 | 1.26mi |
HOA detail
- Monthly dues
- $20 · $240/yr
Listing history 19 events
-
2026-06-18days on market $260,000 Active 45 DOM
-
2026-06-17days on market $260,000 Active 44 DOM
-
2026-06-16days on market $260,000 Active 43 DOM
-
2026-06-15days on market $260,000 Active 42 DOM
-
2026-06-14days on market $260,000 Active 40 DOM
-
2026-06-13days on market $260,000 Active 39 DOM
-
2026-06-10days on market $260,000 Active 37 DOM
-
2026-06-09days on market $260,000 Active 36 DOM
-
2026-06-08days on market $260,000 Active 35 DOM
-
2026-06-07days on market $260,000 Active 34 DOM
-
2026-06-05days on market $260,000 Active 31 DOM
-
2026-06-03days on market $260,000 Active 30 DOM
-
2026-06-02days on market $260,000 Active 29 DOM
-
2026-06-01days on market $260,000 Active 28 DOM
-
2026-05-31days on market $260,000 Active 27 DOM
-
2026-05-30days on market $260,000 Active 26 DOM
-
2026-05-04$260,000 Active 911-char remark
-
2011-12-09$199,900
-
2011-10-18soldstatus $132,000
ⓘ Source: listings_history table (triggers on properties + properties_extension) + one-shot
backfill from property_details.listing_events for pre-trigger history.
Tax reassessment forecast LA · Resets to sale price
- Current annual tax
- $2,033 · $169/mo
- Projected year-2 tax
- $2,033 · $169/mo
- Expected delta
- $0/yr ($0/mo · 0.0%)
ⓘ Screening estimate from a state-policy table — verify with the county assessor before closing.
Climate risk First Street
- Flood 1/10 Low FEMA zone X (unshaded) · 0% chance over 30 yrs
- Wildfire 1/10 Low
- Heat 9/10 Extreme 7 d/yr ≥108°F today · 22 d/yr by 30 yrs out
- Wind 9/10 Extreme 99% chance of damaging wind over 30 yrs
- Air quality 1/10 Low 0 unhealthy d/yr today · 0 by 30 yrs out
Nearby sold comps map
Loading sold comps map…
Walkable amenities ~0.75 mi
Loading nearby amenities…
Taxation est. · year 1
- Rental income
- $23,702
- − Mortgage interest
- −$14,564
- − Property taxes
- −$2,033
- − Insurance
- −$1,300
- − Repairs & maintenance
- −$1,896
- − Management
- −$1,896
- − HOA
- −$240
- − Depreciation
- −$7,564
- Taxable loss
- −$5,791
- Est. tax savings @ 24.0%
- +$1,390
- After-tax cash flow
- $180/yr
For passive investors: Depreciation is non-cash, so a rental often shows a tax loss while cash-flowing — sheltering income. Rental losses are passive: they offset passive income freely, and up to $25,000/yr can offset ordinary (W-2) income if you actively participate and your MAGI is under $100k (phasing out to $0 by $150k); unused losses carry forward. On sale, claimed depreciation is recaptured at up to 25%, and gains may owe capital-gains tax (a 1031 exchange can defer both). Figures are a year-1 estimate at your 24.0% rate — not tax advice; consult a CPA.
Schools (NCES district)
- District
- Lafayette Parish
- NCES district ID
- 2200870
- Math proficiency
- 38% ▼ -32.00%
- Reading proficiency
- 46% ▼ -24.00%
- Median HH income
- $50,238
- Composite
- 36.15/100
- National rank
- #4741
- State rank
- #19 of 98 in LA
Livability — Lafayette
- Score
- 70/100
- State rank
- #63
- US rank
- #8133
Category grades
Schools grade is shown separately in the Schools card above.
Census & demographics
- County
- Lafayette Parish · 207,544 people
- City population
- 158,114
- Metro
- Lafayette, LA
- Population (ZIP)
- 40,592
- Household income
- $86,005
- Rent vs Own
- Severe rent burden
- 1860.0
Population outlook (Lafayette County) Hauer SSP2
- Today (2025)
- 280,930 people
- By 2030
- 301,092 · +7.2%
- By 2040
- 339,456 · +20.8%
- By 2050
- 375,156 · +33.5%
- By 2075
- 451,672 · +60.8%
- By 2100
- 497,203 · +77.0%
Race, ethnicity, and origin ACS 2023
- Neighborhood character
- Predominantly White (75%)
- Race & ethnicity
- White 75% Black 13% Two or more races 7% Hispanic / Latino 5% Asian 3%
- Common ancestry
- Lithuanian 20% Slovak 2% Italian 1%
- Foreign-born
- 5% · Canada, China
- Languages at home
- 91% English-only · Spanish 3% French/Haitian/Cajun 2% Other Indo-European 1%
Political lean MEDSL · Lafayette
- 2024 margin
- Solid R (+31.4) · D 33.5% · R 64.8% · Other 1.7%
- 2008→2024 swing
- -0.1pp no change · 2008: -31.3pp · 2024: -31.4pp
- All cycles
- 2024: R+31.4 2020: R+28.7 2016: R+33.6 2012: R+33.7 2008: R+31.3
Not yet ingested
- Civics
- —
Market trends
- HPI YoY
- ▼ -76.28%
- Current HPI
- 143.6305
- Rent YoY
- ▲ 1.23%
- Metro
- Lafayette, LA
- State GDP YoY
- ▲ 3.29%
- F500 in state
- 10
Industry mix (Fortune 500 HQ in LA)
| Industry | F500 HQs | Revenue |
|---|---|---|
| Telecommunications | 2 | $23B |
|
||
| Utilities | 1 | $12B |
|
||
| Wholesale / Distribution | 1 | $5B |
|
||
| Advertising | 1 | $2B |
|
||
Price history
+97.0% since first listed3 events — show timeline
- 2026-05-04 Listed $260,000 AcadianaMLS
- 2011-12-09 Listed $199,900 AcadianaMLS
- 2011-10-18 Sold (Public Records) $132,000 Public Records
Property tax history
+16.4%/yrLatest (2025): $2,033 · -1.3% YoY. Source: county tax records.
Cash-flow waterfall
monthlySold comps — $/sqft
last 12 mo · ≤1 miLoading sold comps…