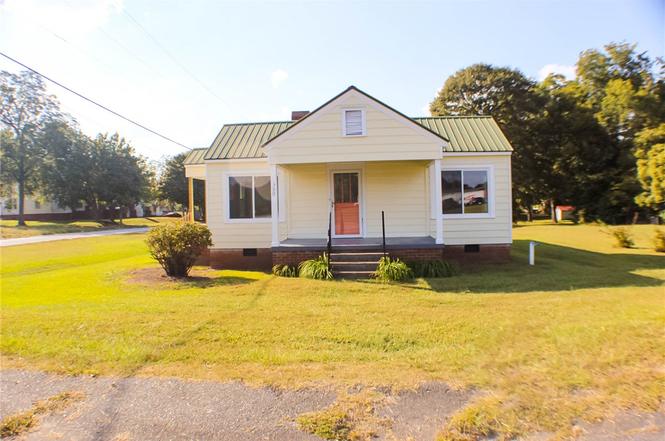
300 Betsy St · Iva, SC
Flood risk 1/10 · Minimal
- FEMA flood zone
- X (unshaded)
- Chance of flooding over 30 yrs
- 0.0%
- Est. flood insurance / yr
- $507 – $1,088
Fire risk 4/10 · Minor
- Est. fire insurance / yr
- $783 – $1,453
Heat risk 6/10 · Moderate
- Hot days now (above 105°F)
- 7 days/yr
- Hot days in 30 yrs
- 17 days/yr
Wind risk 4/10 · Minor
- Chance of severe wind over 30 yrs
- 15.0%
Air-quality risk 3/10 · Minor
- Unhealthy air days now
- 2 days/yr
- Unhealthy air days in 30 yrs
- 3 days/yr
Risk factors via First Street. Map © Google.
Why this score? — see what drove the C grade
The composite is a weighted blend of 9 inputs, each scored 0–100. Each bar is that input's sub-score; the figure is the points it added to the 100-point composite (weight × sub-score).
- Cash flow +24.5/30.0
- DSCR +7.9/10.0
- ARV discount +7.5/15.0
- 1% rule +5.3/10.0
- Schools +3.8/10.0
- Livability +3.4/5.0
- Rent growth +2.5/5.0
- Condition / age +2.5/5.0
- Appreciation +0.0/10.0
$171,000
🖨 Deal sheet 📄 Offer letter ✓ Due diligence
Listing remarks MLS
GREAT LITTLE STARTER HOME ON CORNER LOT, PRICED TO SELL! OR WOULD MAKE WONDERFUL INVESTMENT PROPERTY-WOULD RENT EASILY.
Key facts
- Corner lot
- Public utilities
- 9,583 sq ft lot
Tags
Property features AI
Exterior
- Utilities: Public water; Public sewer
- Home design: Single-story home; Over 50 years old
- Construction: Vinyl siding; Crawlspace foundation
- Exterior features: City lot; Not in a subdivision
Interior
- Kitchen: Electric oven; Electric range
- Bedrooms: 2 main-level bedrooms
- Bathrooms: 1 full bathroom on the main level
- Heating & cooling: Central heating (electric); Central air conditioning (electric)
- Interior features: Crawl space basement
- Laundry & utility: Main-level laundry; Electric water heater
Neighborhood map
What this means for you Summary
Snapshot
- This is a 2-bed/1.0-bath other listed at $171k.
Deal economics
- At list price, monthly cash flow is $350 ($4k/yr) — positive.
- The deal already cash-flows at list — no discount required.
- Meets the 1% rule at list price ($2k rent vs $171k).
- Recommended offer: $150k (12.0% below list) — sets the bar for market timing.
Location & tenants
- Location reads 67/100 on livability (#100 in SC) — a middle-class / working-renter tenant base. Strengths: cost of living A+, housing A+; Watch: health & safety C-, schools D+, crime D.
- Anderson 03 (rural): math 44% / reading 49% proficiency, ranked #22 of 80 in SC (top 28%) — families likely to look elsewhere, expect single-tenant / working-renter base with shorter leases.
- Market conditions: 105 active listings in the ZIP; 1,255 units permitted in Anderson County in 2024 (0 in 5+ unit buildings).
Forward outlook
- Local home prices are declining (-3.0%/yr); year-one equity from $1k of loan paydown is wiped out by about $5k of value loss. Plan a longer hold.
- Anderson County population projected at +14% by 2050 — modest demand growth; plan on rents tracking national, not racing it.
Negotiation context
- It's been on market 244 days — a 12% lower offer ($150k) is reasonable based on typical stale-listing flexibility.
- 3 sale attempts since 16y ago; this cycle's ask has dropped $18k (10%) from the opening price — seller is motivated, your offer sets the floor, not the list.
- Current owner paid $28k; list at $171k implies a 511% gain — meaningful room to come down on a strong offer.
Risks & watch-outs
- Watch-outs: built in 1952 — expect roof / HVAC / electrical / plumbing capex.
- Climate carrying-cost: extreme-heat days projected 7→17/yr by 2055 (HVAC capex compounding) — expect insurance premiums to compound above CPI over the hold.
Questions for the listing agent
- It's been on market 244 days. Have you received any prior offers? Is the seller open to a 12% concession, seller financing, or rate buy-down credit?
- Built in 1952 — when were the roof, HVAC, electrical panel, plumbing, and water heater last replaced?
- Why hasn't it sold? Are there any deal-killer items the seller is aware of (foundation, flood, title, zoning, code violations)?
- Is there a deadline driving the sale (1031 exchange, divorce, estate, relocation)? That informs how much negotiation room exists.
- Schools are D-rated, which usually means shorter tenancies and higher turnover. Who's the typical renter profile here, and what's been the actual vacancy rate?
- Crime grade is D in this area — have there been break-ins, vandalism, or insurance claims at this property in the last 3 years? What carrier currently insures it and at what premium?
- What's the average days-on-market for RENTAL listings here right now (not sales)? A rising rental-DOM trend means longer vacancies and softer asking-rent achievability than the comps imply.
- What's the recent tenant-quality profile in this submarket — average credit score on applications, eviction rate, late-payment / NSF rate, and stable-employment percentage? A property-management company in the area should have these aggregated.
- How much new for-sale + rental construction is in the pipeline within 1–3 miles? Heavy new supply typically softens prices + rents 12–24 months out; constrained supply supports both.
Investment metrics
- 1% rule
- 1.03% ✓
- Cap rate
- 8.75%
- Cash-on-cash
- 8.76%
- DSCR
- 1.39
- GRM
- 8.1
CMA / ARV
No comps found within radius.
Projected returns pro-forma
-3.0% appreciation · 3.0% rent growth · sell at horizon
- IRR
- -3.1%
- Equity multiple
- 0.89×
- Total profit
- $-5,501
- Equity at exit
- $25,497
- IRR
- 6.6%
- Equity multiple
- 1.49×
- Total profit
- $23,646
- Equity at exit
- $14,785
Cash invested: $47,880 (down + closing). Projections, not guarantees.
Landlord ↔ Tenant lean methodology
- Overall (STATE)
- 90 Strongly Landlord-Friendly
- State South Carolina
- 90 Strongly Landlord-Friendly · R+6
- County
- — inherits STATE
- City
- — inherits STATE
ZIP-level market 29655
- Home prices YoY
- -5.5%
- Active inventory
- 105
- Price-to-rent
- 8.1×
Monthly cashflow live
- Estimated rent
- $1,765 medium interval (Pro) →
- Mortgage (P&I)
- −$897
- Tax from tax record
- −$77 /mo · $922/yr
- Insurance
- −$71
- HOA
- −$0
- Vacancy / Maint / Mgmt
- −$371
- Net cashflow
- $350
Break-even live
UW: 25.0% down · 7.5% · 30yr · 1.5% tax · 5.0% vac · 8.0% maint · 8.0% mgmt
Financing live
Cash to close
- Down payment
- $42,750
- Closing costs
- $5,130
- Reserves months
- —
- Total cash needed
- —
Loan-product check · same deal, 3 products live
Conventional
25% down · 7.5% · 30yr
- Down + closing
- —
- Monthly P&I
- —
- Monthly cashflow
- —
- DSCR
- —
- Eligible?
- —
Personal DTI + credit; lowest rate.
DSCR
20% down · 8.5% · 30yr
- Down + closing
- —
- Monthly P&I
- —
- Monthly cashflow
- —
- DSCR
- —
- Eligible?
- —
No personal income docs; deal must DSCR.
Hard money
10% down · 12.0% · 12mo
- Down + closing
- —
- Monthly P&I
- —
- Monthly cashflow
- —
- DSCR
- —
- Eligible?
- —
Short-term bridge; refi at stabilization.
Listing history 26 events
-
2026-06-18days on market $171,000 Active 244 DOM
-
2026-06-17days on market $171,000 Active 243 DOM
-
2026-06-16days on market $171,000 Active 242 DOM
-
2026-06-15days on market $171,000 Active 241 DOM
-
2026-06-13days on market $171,000 Active 239 DOM
-
2026-06-13days on market $171,000 Active 238 DOM
-
2026-06-10days on market $171,000 Active 236 DOM
-
2026-06-09days on market $171,000 Active 235 DOM
-
2026-06-08days on market $171,000 Active 234 DOM
-
2026-06-07days on market $171,000 Active 233 DOM
-
2026-06-05days on market $171,000 Active 230 DOM
-
2026-06-03days on market $171,000 Active 229 DOM
-
2026-06-03days on market $171,000 Active 228 DOM
-
2026-06-01days on market $171,000 Active 227 DOM
-
2026-05-31days on market $171,000 Active 226 DOM
-
2026-05-20price $171,000
-
2026-05-19status Active
-
2026-04-25status Pending
-
2026-04-20price $173,000
-
2026-02-18price $180,000
-
2025-09-22$189,000 Active
-
2011-03-08soldstatus $28,000
-
2011-03-07soldstatus $28,000 119-char remark
Show marketing remark (119 chars)
GREAT LITTLE STARTER HOME ON CORNER LOT, PRICED TO SELL! OR WOULD MAKE WONDERFUL INVESTMENT PROPERTY-WOULD RENT EASILY.
-
2010-08-06$37,500 119-char remark
Show marketing remark (119 chars)
GREAT LITTLE STARTER HOME ON CORNER LOT, PRICED TO SELL! OR WOULD MAKE WONDERFUL INVESTMENT PROPERTY-WOULD RENT EASILY.
-
2002-09-19soldstatus $40,000
-
2000-04-17soldstatus $23,000
ⓘ Source: listings_history table (triggers on properties + properties_extension) + one-shot
backfill from property_details.listing_events for pre-trigger history.
Tax reassessment forecast SC · Resets to sale price
- Current annual tax
- $922 · $77/mo
- Projected year-2 tax
- $975 · $81/mo
- Expected delta
- +$53/yr (+$4/mo · 5.8%)
ⓘ Screening estimate from a state-policy table — verify with the county assessor before closing.
Climate risk First Street
- Flood 1/10 Low FEMA zone X (unshaded) · 0% chance over 30 yrs
- Wildfire 4/10 Moderate
- Heat 6/10 Major 7 d/yr ≥105°F today · 17 d/yr by 30 yrs out
- Wind 4/10 Moderate 15% chance of damaging wind over 30 yrs
- Air quality 3/10 Moderate 2 unhealthy d/yr today · 3 by 30 yrs out
Nearby sold comps map
Loading sold comps map…
Walkable amenities ~0.75 mi
Loading nearby amenities…
Taxation est. · year 1
- Rental income
- $21,181
- − Mortgage interest
- −$9,579
- − Property taxes
- −$922
- − Insurance
- −$855
- − Repairs & maintenance
- −$1,694
- − Management
- −$1,694
- − Depreciation
- −$4,975
- Taxable income
- $1,462
- Est. tax owed @ 24.0%
- −$351
- After-tax cash flow
- $3,844/yr
For passive investors: Depreciation is non-cash, so a rental often shows a tax loss while cash-flowing — sheltering income. Rental losses are passive: they offset passive income freely, and up to $25,000/yr can offset ordinary (W-2) income if you actively participate and your MAGI is under $100k (phasing out to $0 by $150k); unused losses carry forward. On sale, claimed depreciation is recaptured at up to 25%, and gains may owe capital-gains tax (a 1031 exchange can defer both). Figures are a year-1 estimate at your 24.0% rate — not tax advice; consult a CPA.
Schools (NCES district)
- District
- Anderson 03
- NCES district ID
- 4500840
- Math proficiency
- 44% ▼ -16.00%
- Reading proficiency
- 49% ▼ -2.00%
- Median HH income
- $35,457
- Composite
- 38.48/100
- National rank
- #4187
- State rank
- #22 of 80 in SC
Livability — Iva
- Score
- 67/100
- State rank
- #100
- US rank
- #10875
Category grades
Schools grade is shown separately in the Schools card above.
Census & demographics
- Census place
- Iva, SC
- Population (ZIP)
- 8,078
Population outlook (Anderson County) Hauer SSP2
- Today (2025)
- 210,546 people
- By 2030
- 217,791 · +3.4%
- By 2040
- 230,643 · +9.5%
- By 2050
- 240,220 · +14.1%
- By 2075
- 259,518 · +23.3%
- By 2100
- 258,696 · +22.9%
Race, ethnicity, and origin ACS 2023
- Neighborhood character
- Predominantly White (87%)
- Race & ethnicity
- White 87% Black 8% Two or more races 5%
- Common ancestry
- Serbian 3% Slovak 3% Scotch-Irish 2%
- Foreign-born
- 1%
- Languages at home
- 99% English-only · Russian/Polish/Slavic 1%
Political lean MEDSL · Anderson
- 2024 margin
- Solid R (+47.4) · D 25.7% · R 73.1% · Other 1.2%
- 2008→2024 swing
- -14.1pp toward R · 2008: -33.3pp · 2024: -47.4pp
- All cycles
- 2024: R+47.4 2020: R+42.0 2016: R+43.7 2012: R+36.4 2008: R+33.3
Not yet ingested
- Civics
- —
Market trends
- HPI YoY
- ▼ -15.62%
- Current HPI
- 271.1368
- Rent YoY
- —
- Metro
- —
- State GDP YoY
- ▲ 4.51%
- F500 in state
- 2
Industry mix (Fortune 500 HQ in SC)
| Industry | F500 HQs | Revenue |
|---|---|---|
| Packaging | 1 | $7B |
|
||
Price history
+643.5% since first listed11 events — show timeline
- 2026-05-20 Price Changed $171,000 WUMLS
- 2026-05-19 Relisted — WUMLS
- 2026-04-25 Pending — WUMLS
- 2026-04-20 Price Changed $173,000 WUMLS
- 2026-02-18 Price Changed $180,000 WUMLS
- 2025-09-22 Listed $189,000 WUMLS
- 2011-03-08 Sold (Public Records) $28,000 Public Records
- 2011-03-07 Sold (MLS) $28,000 WUMLS
- 2010-08-06 Listed $37,500 WUMLS
- 2002-09-19 Sold (Public Records) $40,000 Public Records
- 2000-04-17 Sold (Public Records) $23,000 Public Records
Property tax history
+1.8%/yrLatest (2025): $922 · +5.0% YoY. Source: county tax records.
Cash-flow waterfall
monthlySold comps — $/sqft
last 12 mo · ≤1 miLoading sold comps…