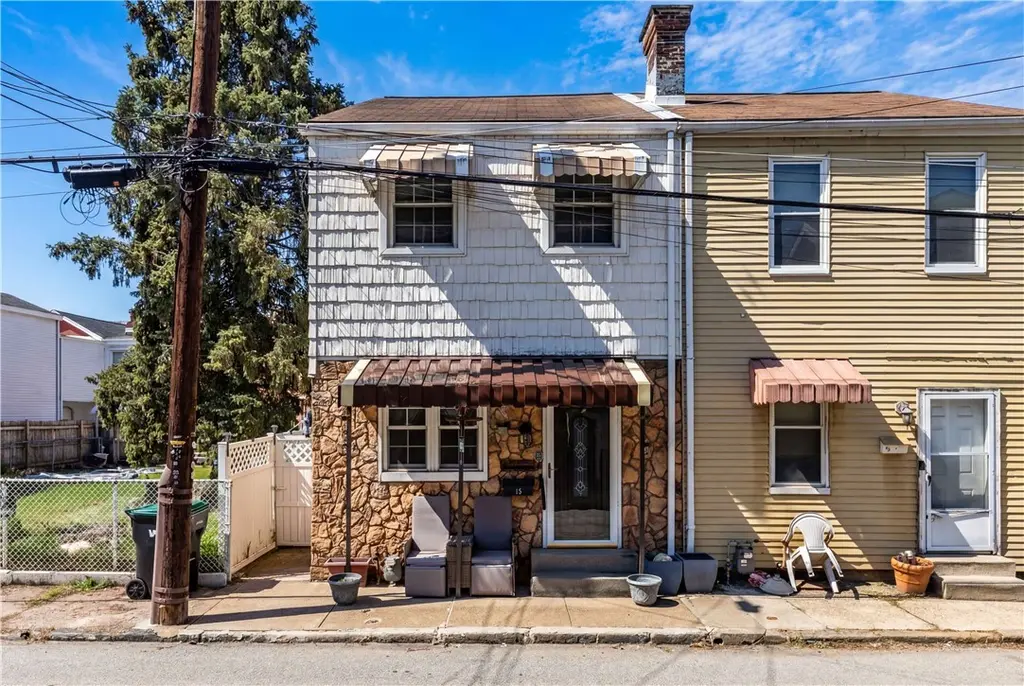
13 3rd St · Sharpsburg, PA
Flood risk 10/10 · Severe
- FEMA flood zone
- X (shaded)
- Chance of flooding over 30 yrs
- 0.99%
- Est. flood insurance / yr
- $473 – $860
Fire risk 1/10 · Minimal
- Est. fire insurance / yr
- $511 – $949
Heat risk 4/10 · Minor
- Hot days now (above 98°F)
- 8 days/yr
- Hot days in 30 yrs
- 19 days/yr
Wind risk 2/10 · Minimal
- Chance of severe wind over 30 yrs
- 0.0%
Air-quality risk 4/10 · Minor
- Unhealthy air days now
- 5 days/yr
- Unhealthy air days in 30 yrs
- 7 days/yr
Risk factors via First Street. Map © Google.
Why this score? — see what drove the B- grade
The composite is a weighted blend of 9 inputs, each scored 0–100. Each bar is that input's sub-score; the figure is the points it added to the 100-point composite (weight × sub-score).
- Cash flow +26.9/30.0
- DSCR +9.3/10.0
- ARV discount +7.3/15.0
- Schools +6.9/10.0
- 1% rule +6.7/10.0
- Livability +4.0/5.0
- Rent growth +3.8/5.0
- Condition / age +2.5/5.0
- Appreciation +0.0/10.0
$219,900
🖨 Deal sheet (PDF) 📄 Offer letter ✓ Due diligence
Listing remarks MLS
Welcome to this spacious and updated 2-story home, perfectly situated on a quiet dead-end street in the vibrant Sharpsburg community. Combining classic character with modern convivence, this property offers an ideal layout for comfortable living and entertaining. Fabulous property with modern kitchen, inviting living spaces, spacious bedrooms, two full bathrooms, and a walkable lifestyle community.
Key facts
- Updated 2-story home
- Modern kitchen
- 1,254 sq ft lot
Tags
Neighborhood map
What this means for you Summary
Snapshot
- This is a 2-bed/1.0-bath single-family listed at $220k.
Deal economics
- At list price, monthly cash flow is $550 ($7k/yr) — positive.
- The deal already cash-flows at list — no discount required.
- Meets the 1% rule at list price ($3k rent vs $220k).
- Recommended offer: $207k (6.0% below list) — sets the bar for market timing.
Location & tenants
- Location reads 79/100 on livability (#248 in PA, #2,145 nationally) — a middle-class / working-renter tenant base. Strengths: commute A+, cost of living A+, housing A+; Watch: amenities D, employment D-.
- Fox Chapel Area SD (suburban): math 73% / reading 85% proficiency, ranked #7 of 539 in PA (top 1%) — strong family-tenant draw, lease renewals of 3-5y typical; only 16% free/reduced lunch — higher-income household profile.
- Zoned schools: Dorseyville Ms (math 59% / reading 82%, grade A, #11 of 512 statewide, top 2%, 967 students, 24% FRL); Fox Chapel Area Hs (math 87%, 1,283 students, 25% FRL).
- Market conditions: Rents rising fast (+5.2%/yr); 56 active listings in the ZIP; 6 comparable units currently listed for rent nearby; rentals at typical pace (median 21d on market — plan ~3-4 weeks tenant-placement turnaround); solid renter incomes; 2,996 units permitted in Allegheny County in 2024 (1,588 in 5+ unit buildings).
- This rent runs 31% of the median local income ($99k/yr) — at the standard rent-burdened threshold; future hikes will face affordability resistance.
Forward outlook
- Local home prices are declining (-3.0%/yr); year-one equity from $2k of loan paydown is wiped out by about $7k of value loss. Plan a longer hold.
- At projected returns (-3.0% appreciation + 5.2% rent growth), your $62k cash investment doubles in ~9 years — after that, you're playing with house money.
Negotiation context
- It's been on market 68 days — a 6% lower offer ($207k) is reasonable based on typical stale-listing flexibility.
- 2 sale attempts since 19y ago with the ask held roughly flat each time — persistent listings suggest the price (not the market) is what's stuck; bring a comps-based counter.
- Current owner paid $58k; list at $220k implies a 279% gain — meaningful room to come down on a strong offer.
Risks & watch-outs
- Watch-outs: flood insurance adds $56/mo; built in 1900 — expect roof / HVAC / electrical / plumbing capex.
- Climate carrying-cost: severe flood risk — expect insurance premiums to compound above CPI over the hold.
Questions for the listing agent
- It's been on market 68 days. Have you received any prior offers? Is the seller open to a 6% concession, seller financing, or rate buy-down credit?
- Built in 1900 — when were the roof, HVAC, electrical panel, plumbing, and water heater last replaced?
- What's the actual annual flood-insurance premium (NFIP or private), and is the property in a SFHA with mandatory coverage?
- Why hasn't it sold? Are there any deal-killer items the seller is aware of (foundation, flood, title, zoning, code violations)?
- Is there a deadline driving the sale (1031 exchange, divorce, estate, relocation)? That informs how much negotiation room exists.
- Schools are D-rated, which usually means shorter tenancies and higher turnover. Who's the typical renter profile here, and what's been the actual vacancy rate?
- What's the average days-on-market for RENTAL listings here right now (not sales)? A rising rental-DOM trend means longer vacancies and softer asking-rent achievability than the comps imply.
- What's the recent tenant-quality profile in this submarket — average credit score on applications, eviction rate, late-payment / NSF rate, and stable-employment percentage? A property-management company in the area should have these aggregated.
- How much new for-sale + rental construction is in the pipeline within 1–3 miles? Heavy new supply typically softens prices + rents 12–24 months out; constrained supply supports both.
Investment metrics
- 1% rule
- 1.17% ✓
- Cap rate
- 9.60%
- Cash-on-cash
- 11.81%
- DSCR
- 1.53
- GRM
- 7.1
CMA / ARV
- ARV (median comp)
- $219,047
- List price
- $219,900
- Delta
- 0.39%
- Verdict
- FAIR
- Comps
- 20 within 1.0 mi
Show comp detail 12 sales within ~0.75 mi
| Address | Dist | Beds/Ba | Sqft | Sold | Price | $/sf | Match |
|---|---|---|---|---|---|---|---|
| 16 4th St | 0.05mi | 3/1.5 (+1) | 1,824 (-6%) | 6mo | $215,000 | $118 | 75 |
| 66 Cherry St | 0.37mi | 3/2.0 (+1) | 1,952 (+1%) | 2mo | $325,000 | $166 | 72 |
| 1636 Trinity St | 0.59mi | 3/2.5 (+1) | 1,873 (-4%) | 1mo | $501,636 | $268 | 55 |
| 1218 Penn St | 0.46mi | 3/1.5 (+1) | 2,082 (+7%) | 8mo | $128,000 | $61 | 53 |
| 29 Kittanning Pike | 0.73mi | 3/1.5 (+1) | 1,934 (-0%) | 8mo | $205,000 | $106 | 52 |
| 229 Clifton Ave | 0.52mi | 3/1.5 (+1) | 1,725 (-11%) | 3mo | $209,000 | $121 | 48 |
| 713 Edgewood Ave | 0.57mi | 3/2.5 (+1) | 2,020 (+4%) | 10mo | $710,000 | $351 | 47 |
| 1503 Windcrest Dr | 0.67mi | 3/2.5 (+1) | 1,927 (-1%) | 14mo | $462,000 | $240 | 44 |
| 1048 Downlook | 0.68mi | 3/2.0 (+1) | 1,832 (-6%) | 12mo | $367,500 | $201 | 40 |
| 1351 Simona Dr | 0.74mi | 3/1.5 (+1) | 1,834 (-6%) | 12mo | $367,500 | $200 | 39 |
| 1405 Woodbine St | 0.65mi | 3/2.5 (+1) | 2,032 (+5%) | 16mo | $313,595 | $154 | 38 |
| 78 High St | 0.62mi | 3/3.0 (+1) | 2,176 (+12%) | 4mo | $33,333 | $15 | 35 |
Match score weights: distance 35% · size 25% · config 20% · recency 20%. Top-matched comps best support the ARV.
Projected returns pro-forma
-3.0% appreciation · 5.24% rent growth · sell at horizon
- IRR
- 2.2%
- Equity multiple
- 1.09×
- Total profit
- $5,392
- Equity at exit
- $32,788
- IRR
- 13.9%
- Equity multiple
- 2.23×
- Total profit
- $75,483
- Equity at exit
- $19,013
Cash invested: $61,572 (down + closing). Projections, not guarantees.
Landlord ↔ Tenant lean methodology
- Overall (STATE)
- 62 Landlord-Friendly
- State Pennsylvania
- 62 Landlord-Friendly · EVEN
- County
- — inherits STATE
- City
- — inherits STATE
ZIP-level market 15215
- Rents YoY
- 5.2%
- Active inventory
- 56
- Price-to-rent
- 7.1×
Monthly cashflow live
- Estimated rent
- $2,583 medium interval (Pro) →
- Mortgage (P&I)
- −$1,153
- Tax from tax record
- −$190 /mo · $2,276/yr
- Insurance
- −$92
- Flood insurance flood zone
- −$56 /mo · $666/yr
- HOA
- −$0
- Vacancy / Maint / Mgmt
- −$542
- Net cashflow
- $550
Break-even live
Sensitivity live
| Price | -10% $675 | -5% $613 | +0% $550 | +5% $488 | +10% $426 |
|---|---|---|---|---|---|
| Rent | -10% $346 | -5% $448 | +0% $550 | +5% $652 | +10% $754 |
| Rate | -1.0pp $661 | -0.5pp $606 | base $550 | +0.5pp $493 | +1.0pp $435 |
UW: 25.0% down · 7.5% · 30yr · 1.5% tax · 5.0% vac · 8.0% maint · 8.0% mgmt
Financing live
Cash to close
- Down payment
- $54,975
- Closing costs
- $6,597
- Reserves months
- —
- Total cash needed
- —
Loan-product check · same deal, 3 products live
Conventional
25% down · 7.5% · 30yr
- Down + closing
- —
- Monthly P&I
- —
- Monthly cashflow
- —
- DSCR
- —
- Eligible?
- —
Personal DTI + credit; lowest rate.
DSCR
20% down · 8.5% · 30yr
- Down + closing
- —
- Monthly P&I
- —
- Monthly cashflow
- —
- DSCR
- —
- Eligible?
- —
No personal income docs; deal must DSCR.
Hard money
10% down · 12.0% · 12mo
- Down + closing
- —
- Monthly P&I
- —
- Monthly cashflow
- —
- DSCR
- —
- Eligible?
- —
Short-term bridge; refi at stabilization.
Rent comps 6 comps
| Address | Beds | Baths | Sqft | Rent | $/sqft | DOM | Units | Dist |
|---|---|---|---|---|---|---|---|---|
| 6026 Sawyer St Unit NA Pittsburgh, PA | 3.0 | 2.0 | 2231 | $2,500 | $1.12 | 20d | 1 | 0.57mi |
| 160 56th St Pittsburgh, PA | 3.0 | 3.0 | 1737 | $3,900 | $2.25 | 20d | 1 | 0.85mi |
| 5264 Dresden Way Pittsburgh, PA | 2.0 | 2.0 | 1853 | $2,500 | $1.35 | 25d | 1 | 1.14mi |
| 5275 Butler St Pittsburgh, PA | 2.0 | 1.0–2.0 | 885 | $4,076 | $4.61 | 3d | 130 | 1.15mi |
| 5700 Bunkerhill St Pittsburgh, PA | 1.0–3.0 | 1.0–2.0 | 1258 | $2,608 | $2.07 | 3d | 17 | 1.41mi |
| 1115 N Negley Ave Pittsburgh, PA | 1.0–2.0 | 1.0–2.0 | 968 | $2,390 | $2.47 | 3d | 2 | 1.43mi |
Listing history 17 events
-
2026-06-21days on market $219,900 Active 68 DOM
-
2026-06-18days on market $219,900 Active 65 DOM
-
2026-06-17days on market $219,900 Active 64 DOM
-
2026-06-16days on market $219,900 Active 63 DOM
-
2026-06-15days on market $219,900 Active 62 DOM
-
2026-06-13days on market $219,900 Active 60 DOM
-
2026-06-09days on market $219,900 Active 56 DOM
-
2026-06-08days on market $219,900 Active 55 DOM
-
2026-06-07days on market $219,900 Active 54 DOM
-
2026-06-03days on market $219,900 Active 50 DOM
-
2026-06-02days on market $219,900 Active 49 DOM
-
2026-06-01pricedays on market $219,900 Active 48 DOM
-
2026-05-31days on market $224,900 Active 47 DOM
-
2026-04-13$224,900 Active 401-char remark
Show marketing remark (401 chars)
Welcome to this spacious and updated 2-story home, perfectly situated on a quiet dead-end street in the vibrant Sharpsburg community. Combining classic character with modern convivence, this property offers an ideal layout for comfortable living and entertaining. Fabulous property with modern kitchen, inviting living spaces, spacious bedrooms, two full bathrooms, and a walkable lifestyle community.
-
2007-09-12soldstatus $58,000
-
2007-09-11soldstatus $58,000 135-char remark
Show marketing remark (135 chars)
What a surprise in this 3 bedroom home, with newer cherry kitchen, large rooms, walk in closets, 1st floor family room, and central air
-
2007-02-15$63,500 135-char remark
Show marketing remark (135 chars)
What a surprise in this 3 bedroom home, with newer cherry kitchen, large rooms, walk in closets, 1st floor family room, and central air
ⓘ Source: listings_history table (triggers on properties + properties_extension) + one-shot
backfill from property_details.listing_events for pre-trigger history.
Tax reassessment forecast PA · Partial reset (capped growth)
- Current annual tax
- $2,276 · $190/mo
- Projected year-2 tax
- $2,875 · $240/mo
- Expected delta
- +$599/yr (+$50/mo · 26.3%)
ⓘ Screening estimate from a state-policy table — verify with the county assessor before closing.
Climate risk First Street
- Flood 10/10 Extreme FEMA zone X (shaded) · 99% chance over 30 yrs
- Wildfire 1/10 Low
- Heat 4/10 Moderate 8 d/yr ≥98°F today · 19 d/yr by 30 yrs out
- Wind 2/10 Low 0% chance of damaging wind over 30 yrs
- Air quality 4/10 Moderate 5 unhealthy d/yr today · 7 by 30 yrs out
Nearby sold comps map
Loading sold comps map…
Walkable amenities ~0.75 mi
Loading nearby amenities…
Taxation est. · year 1
- Rental income
- $30,993
- − Mortgage interest
- −$12,318
- − Property taxes
- −$2,276
- − Insurance
- −$1,766
- − Repairs & maintenance
- −$2,479
- − Management
- −$2,479
- − Depreciation
- −$6,397
- Taxable income
- $3,277
- Est. tax owed @ 24.0%
- −$787
- After-tax cash flow
- $5,818/yr
For passive investors: Depreciation is non-cash, so a rental often shows a tax loss while cash-flowing — sheltering income. Rental losses are passive: they offset passive income freely, and up to $25,000/yr can offset ordinary (W-2) income if you actively participate and your MAGI is under $100k (phasing out to $0 by $150k); unused losses carry forward. On sale, claimed depreciation is recaptured at up to 25%, and gains may owe capital-gains tax (a 1031 exchange can defer both). Figures are a year-1 estimate at your 24.0% rate — not tax advice; consult a CPA.
Schools (NCES district)
- District
- Fox Chapel Area SD
- NCES district ID
- 4210070
- Math proficiency
- 73% ▼ -5.00%
- Reading proficiency
- 85% ▼ -2.00%
- Median HH income
- $73,326
- Composite
- 69.02/100
- National rank
- #324
- State rank
- #7 of 539 in PA
Livability — Sharpsburg
- Score
- 79/100
- State rank
- #248
- US rank
- #2145
Category grades
Schools grade is shown separately in the Schools card above.
Census & demographics
- Census place
- Sharpsburg, PA
- County
- Allegheny County · 1,022,028 people
- Metro
- Pittsburgh, PA
- Population (ZIP)
- 11,907
- Household income
- $99,071
- Rent vs Own
- Severe rent burden
- 311.0
Population outlook (Allegheny County) Hauer SSP2
- Today (2025)
- 1,250,282 people
- By 2030
- 1,256,482 · +0.5%
- By 2040
- 1,256,318 · +0.5%
- By 2050
- 1,244,169 · -0.5%
- By 2075
- 1,197,693 · -4.2%
- By 2100
- 1,093,187 · -12.6%
Race, ethnicity, and origin ACS 2023
- Neighborhood character
- Predominantly White (86%)
- Race & ethnicity
- White 86% Asian 5% Two or more races 4% Black 4% Hispanic / Latino 3%
- Common ancestry
- Romanian 9% Lithuanian 3% Scotch-Irish 2%
- Foreign-born
- 7% · China, South Korea, Canada
- Languages at home
- 91% English-only · Spanish 2% Chinese 2% Other Indo-European 2%
Political lean MEDSL · Allegheny
- 2024 margin
- Strong D (+20.3) · D 59.7% · R 39.4%
- 2008→2024 swing
- +4.8pp toward D · 2008: 15.5pp · 2024: 20.3pp
- All cycles
- 2024: D+20.3 2020: D+20.4 2016: D+16.4 2012: D+14.4 2008: D+15.5
Not yet ingested
- Civics
- —
Market trends
- HPI YoY
- ▼ -171.68%
- Current HPI
- 284.7359
- Rent YoY
- ▲ 5.24%
- Metro
- Pittsburgh, PA
- State GDP YoY
- ▲ 1.68%
- F500 in state
- 34
Industry mix (Fortune 500 HQ in PA)
| Industry | F500 HQs | Revenue |
|---|---|---|
| Healthcare | 2 | $309B |
|
||
| Insurance | 2 | $27B |
|
||
| Telecommunications / Media | 1 | $124B |
|
||
| Industrial Distribution | 1 | $22B |
|
||
| Financial Services | 1 | $20B |
|
||
| Chemicals / Materials | 1 | $18B |
|
||
Price history
+254.2% since first listed4 events — show timeline
- 2026-04-13 Listed $224,900 West Penn MLS
- 2007-09-12 Sold (Public Records) $58,000 Public Records
- 2007-09-11 Sold (MLS) $58,000 West Penn MLS
- 2007-02-15 Listed $63,500 West Penn MLS
Property tax history
+1.4%/yrLatest (2026): $2,276 · +1.3% YoY. Source: county tax records.
Cash-flow waterfall
monthlySold comps — $/sqft
last 12 mo · ≤1 miLoading sold comps…