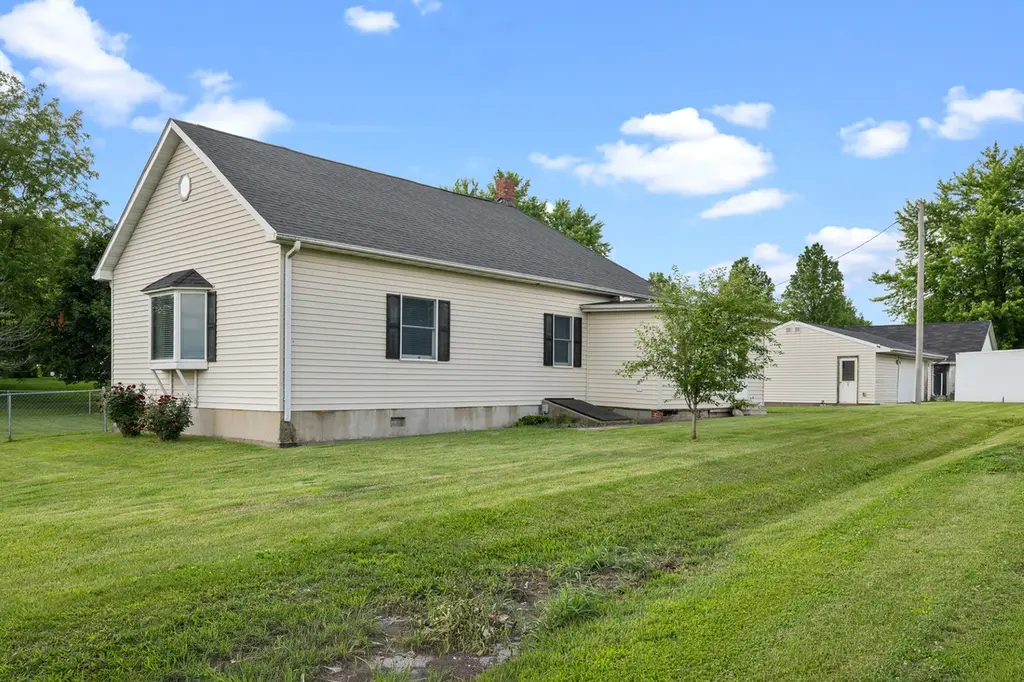
406 234th St · Viola, IL
Flood risk 1/10 · Minimal
- FEMA flood zone
- X (unshaded)
- Chance of flooding over 30 yrs
- 0.0%
- Est. flood insurance / yr
- $473 – $860
Fire risk 1/10 · Minimal
- Est. fire insurance / yr
- $804 – $1,492
Heat risk 3/10 · Minor
- Hot days now (above 104°F)
- 7 days/yr
- Hot days in 30 yrs
- 16 days/yr
Wind risk 2/10 · Minimal
- Chance of severe wind over 30 yrs
- 1.0%
Air-quality risk 2/10 · Minimal
- Unhealthy air days now
- 2 days/yr
- Unhealthy air days in 30 yrs
- 2 days/yr
Risk factors via First Street. Map © Google.
Why this score? — see what drove the D grade
The composite is a weighted blend of 9 inputs, each scored 0–100. Each bar is that input's sub-score; the figure is the points it added to the 100-point composite (weight × sub-score).
- Cash flow +16.8/30.0
- ARV discount +7.5/15.0
- DSCR +5.2/10.0
- 1% rule +4.4/10.0
- Livability +3.3/5.0
- Rent growth +2.5/5.0
- Condition / age +2.5/5.0
- Schools +1.7/10.0
- Appreciation +0.0/10.0
$139,900
🖨 Deal sheet (PDF) 📄 Offer letter ✓ Due diligence
Listing remarks
Escape to the peace and quiet of the countryside! Experience the charm of country living in this spacious and inviting three-bedroom, one bath ranch house. This charming home offers the perfect blend of comfort and convenience, with numerous updates throughout. The open floor plan creates a bright and airy space, perfect for families or hosting a group of friends. Step outside and entertain on the expansive deck or enjoy your morning coffee while listening to the sounds of nature. Plus, an oversized 2.5 car heated garage with a workbench provides space for hobbyist, DIY projects, or storing bikes and outdoor equipment! Schedule your private tour of this cozy home today!
Key facts
- Workbench
- Expansive deck
- 0.33 acre lot
Tags
Neighborhood map
What this means for you Summary
Snapshot
- This is a 3-bed/1.0-bath single-family listed at $140k.
Deal economics
- At list price, monthly cash flow is $90 ($1k/yr) — positive.
- The deal already cash-flows at list — no discount required.
- To meet the 1% rule (rent ≥ 1% of price), the offer needs to be $132k (5.8% below list).
- Recommended offer: $123k (12.0% below list) — sets the bar for market timing.
Location & tenants
- Location reads 66/100 on livability (#593 in IL) — a middle-class / working-renter tenant base. Strengths: crime A+, cost of living A+, housing A+; Watch: amenities F, commute F, health & safety F.
- Mercer County School District 404 (town): math 14% / reading 24% proficiency, ranked #439 of 620 in IL (top 71%) — low school quality limits family demand, transient renter base, plan for 1-2y turnover.
- Zoned schools: Apollo Elem School (math 17% / reading 17%, grade F, #1,141 of 2,056 statewide, top 59%, 335 students, 0% FRL); Mercer County Jr High School (math 17% / reading 29%, grade F, #377 of 665 statewide, top 58%, 299 students, 0% FRL); Mercer County High School (math 17% / reading 22%, grade F, #397 of 693 statewide, top 61%, 404 students, 0% FRL) — zoned schools average 0% FRL vs 37% district-wide (37 pts lower); this property's tenant base skews higher-income than the district average.
- Market conditions: 41 active listings in the ZIP; 15 units permitted in Mercer County in 2024 (0 in 5+ unit buildings).
Forward outlook
- Local home prices are declining (-3.0%/yr); year-one equity from $967 of loan paydown is wiped out by about $4k of value loss. Plan a longer hold.
- Mercer County population projected at -25% by 2050 — secular population decline; favor cash flow + early exit over multi-decade hold.
Negotiation context
- It's been on market 155 days — a 12% lower offer ($123k) is reasonable based on typical stale-listing flexibility.
- Current owner paid $86k; list at $140k implies a 63% gain — meaningful room to come down on a strong offer.
Risks & watch-outs
- Watch-outs: built in 1940 — expect roof / HVAC / electrical / plumbing capex.
Questions for the listing agent
- It's been on market 155 days. Have you received any prior offers? Is the seller open to a 12% concession, seller financing, or rate buy-down credit?
- Built in 1940 — when were the roof, HVAC, electrical panel, plumbing, and water heater last replaced?
- Why hasn't it sold? Are there any deal-killer items the seller is aware of (foundation, flood, title, zoning, code violations)?
- Is there a deadline driving the sale (1031 exchange, divorce, estate, relocation)? That informs how much negotiation room exists.
- Schools are D-rated, which usually means shorter tenancies and higher turnover. Who's the typical renter profile here, and what's been the actual vacancy rate?
- The area grade is low — what's the realistic commute time and amenity access for the typical tenant pool here? Any planned neighborhood developments (good or bad) we should know about?
- What's the average days-on-market for RENTAL listings here right now (not sales)? A rising rental-DOM trend means longer vacancies and softer asking-rent achievability than the comps imply.
- What's the recent tenant-quality profile in this submarket — average credit score on applications, eviction rate, late-payment / NSF rate, and stable-employment percentage? A property-management company in the area should have these aggregated.
- How much new for-sale + rental construction is in the pipeline within 1–3 miles? Heavy new supply typically softens prices + rents 12–24 months out; constrained supply supports both.
Investment metrics
- 1% rule
- 0.94% ✗
- Cap rate
- 7.07%
- Cash-on-cash
- 2.76%
- DSCR
- 1.12
- GRM
- 8.8
CMA / ARV
- ARV (median comp)
- $285,000
- List price
- $139,900
- Delta
- -50.91%
- Verdict
- UNDERPRICED
- Comps
- 1 within 2.0 mi
Show comp detail 1 sale within ~0.75 mi
| Address | Dist | Beds/Ba | Sqft | Sold | Price | $/sf | Match |
|---|---|---|---|---|---|---|---|
| 405 234th St St | 0.03mi | 4/2.0 (+1) | 1,826 (+10%) | 5mo | $285,000 | $156 | 70 |
Match score weights: distance 35% · size 25% · config 20% · recency 20%. Top-matched comps best support the ARV.
Projected returns pro-forma
-3.0% appreciation · 3.0% rent growth · sell at horizon
- IRR
- -11.9%
- Equity multiple
- 0.57×
- Total profit
- $-16,917
- Equity at exit
- $20,860
- IRR
- -2.8%
- Equity multiple
- 0.81×
- Total profit
- $-7,296
- Equity at exit
- $12,096
Cash invested: $39,172 (down + closing). Projections, not guarantees.
Landlord ↔ Tenant lean methodology
- Overall (STATE)
- 43 Moderately Tenant-Leaning
- State Illinois
- 43 Moderately Tenant-Leaning · D+7
- County
- — inherits STATE
- City
- — inherits STATE
ZIP-level market 61231
- Home prices YoY
- -33.0%
- Active inventory
- 41
- Price-to-rent
- 8.8×
Monthly cashflow live
- Estimated rent
- $1,317 medium interval (Pro) →
- Mortgage (P&I)
- −$734
- Tax from tax record
- −$159 /mo · $1,904/yr
- Insurance
- −$58
- HOA
- −$0
- Vacancy / Maint / Mgmt
- −$277
- Net cashflow
- $90
Break-even live
Sensitivity live
| Price | -10% $169 | -5% $130 | +0% $90 | +5% $51 | +10% $11 |
|---|---|---|---|---|---|
| Rent | -10% $-14 | -5% $38 | +0% $90 | +5% $142 | +10% $194 |
| Rate | -1.0pp $161 | -0.5pp $126 | base $90 | +0.5pp $54 | +1.0pp $17 |
UW: 25.0% down · 7.5% · 30yr · 1.5% tax · 5.0% vac · 8.0% maint · 8.0% mgmt
Financing live
Cash to close
- Down payment
- $34,975
- Closing costs
- $4,197
- Reserves months
- —
- Total cash needed
- —
Loan-product check · same deal, 3 products live
Conventional
25% down · 7.5% · 30yr
- Down + closing
- —
- Monthly P&I
- —
- Monthly cashflow
- —
- DSCR
- —
- Eligible?
- —
Personal DTI + credit; lowest rate.
DSCR
20% down · 8.5% · 30yr
- Down + closing
- —
- Monthly P&I
- —
- Monthly cashflow
- —
- DSCR
- —
- Eligible?
- —
No personal income docs; deal must DSCR.
Hard money
10% down · 12.0% · 12mo
- Down + closing
- —
- Monthly P&I
- —
- Monthly cashflow
- —
- DSCR
- —
- Eligible?
- —
Short-term bridge; refi at stabilization.
Listing history 12 events
-
2026-01-15status Active
-
2026-01-14historical
-
2026-01-08status Active
-
2026-01-06historical
-
2026-01-05historical
-
2025-12-30price $139,900
-
2025-09-18price
-
2025-08-29historical
-
2025-08-29Active
-
2025-08-29historical
-
2025-06-20Active
-
2007-09-25soldstatus $86,000
ⓘ Source: listings_history table (triggers on properties + properties_extension) + one-shot
backfill from property_details.listing_events for pre-trigger history.
Tax reassessment forecast IL · Partial reset (capped growth)
- Current annual tax
- $1,904 · $159/mo
- Projected year-2 tax
- $2,540 · $212/mo
- Expected delta
- +$636/yr (+$53/mo · 33.4%)
ⓘ Screening estimate from a state-policy table — verify with the county assessor before closing.
Climate risk First Street
- Flood 1/10 Low FEMA zone X (unshaded) · 0% chance over 30 yrs
- Wildfire 1/10 Low
- Heat 3/10 Moderate 7 d/yr ≥104°F today · 16 d/yr by 30 yrs out
- Wind 2/10 Low 100% chance of damaging wind over 30 yrs
- Air quality 2/10 Low 2 unhealthy d/yr today · 2 by 30 yrs out
Nearby sold comps map
Loading sold comps map…
Walkable amenities ~0.75 mi
Loading nearby amenities…
Taxation est. · year 1
- Rental income
- $15,809
- − Mortgage interest
- −$7,837
- − Property taxes
- −$1,904
- − Insurance
- −$700
- − Repairs & maintenance
- −$1,265
- − Management
- −$1,265
- − Depreciation
- −$4,070
- Taxable loss
- −$1,230
- Est. tax savings @ 24.0%
- +$295
- After-tax cash flow
- $1,377/yr
For passive investors: Depreciation is non-cash, so a rental often shows a tax loss while cash-flowing — sheltering income. Rental losses are passive: they offset passive income freely, and up to $25,000/yr can offset ordinary (W-2) income if you actively participate and your MAGI is under $100k (phasing out to $0 by $150k); unused losses carry forward. On sale, claimed depreciation is recaptured at up to 25%, and gains may owe capital-gains tax (a 1031 exchange can defer both). Figures are a year-1 estimate at your 24.0% rate — not tax advice; consult a CPA.
Schools (NCES district)
- District
- Mercer County School District 404
- NCES district ID
- 1701395
- Math proficiency
- 14% ▼ -5.00%
- Reading proficiency
- 24% ▼ -9.00%
- Median HH income
- $46,980
- Composite
- 16.76/100
- National rank
- #9158
- State rank
- #439 of 620 in IL
Livability — Viola
- Score
- 66/100
- State rank
- #593
- US rank
- #12280
Category grades
Schools grade is shown separately in the Schools card above.
Census & demographics
- Population (ZIP)
- 4,958
Population outlook (Mercer County) Hauer SSP2
- Today (2025)
- 14,595 people
- By 2030
- 13,846 · -5.1%
- By 2040
- 12,335 · -15.5%
- By 2050
- 10,893 · -25.4%
- By 2075
- 8,238 · -43.6%
- By 2100
- 6,111 · -58.1%
Race, ethnicity, and origin ACS 2023
- Neighborhood character
- Predominantly White (93%)
- Race & ethnicity
- White 93% Hispanic / Latino 4% Two or more races 3% Black 1%
- Common ancestry
- Lithuanian 2% Danish 2% Iranian 1%
- Foreign-born
- 1% · Canada
- Languages at home
- 96% English-only · Spanish 3% Arabic 1%
Political lean MEDSL · Mercer
- 2024 margin
- Strong R (+27.1) · D 35.4% · R 62.5% · Other 2.2%
- 2008→2024 swing
- -39.0pp toward R · 2008: 11.9pp · 2024: -27.1pp
- All cycles
- 2024: R+27.1 2020: R+24.0 2016: R+20.7 2012: D+7.4 2008: D+11.9
Not yet ingested
- Civics
- —
Market trends
- HPI YoY
- ▼ -69.03%
- Current HPI
- 140.0
- Rent YoY
- —
- Metro
- —
- State GDP YoY
- ▲ 1.59%
- F500 in state
- 60
Industry mix (Fortune 500 HQ in IL)
| Industry | F500 HQs | Revenue |
|---|---|---|
| Insurance | 4 | $201B |
|
||
| Consumer Goods | 4 | $87B |
|
||
| Industrial Machinery | 3 | $64B |
|
||
| Healthcare | 2 | $55B |
|
||
| Retail / Pharmacy | 1 | $148B |
|
||
| Agriculture / Food | 1 | $86B |
|
||
Price history
+62.7% since first listed12 events — show timeline
- 2026-01-15 Relisted — MRED as Distributed by MLS Grid
- 2026-01-14 Listing Removed — MRED as Distributed by MLS Grid
- 2026-01-08 Relisted — MRED as Distributed by MLS Grid
- 2026-01-06 Listing Removed — RMLSA as Distributed by MLS Grid
- 2026-01-05 Listing Removed — MRED as Distributed by MLS Grid
- 2025-12-30 Price Changed $139,900 MRED as Distributed by MLS Grid
- 2025-09-18 Price Changed — RMLSA as Distributed by MLS Grid
- 2025-08-29 Listing Removed — RMLSA as Distributed by MLS Grid
- 2025-08-29 Listing Removed — MRED as Distributed by MLS Grid
- 2025-08-29 Listed — RMLSA as Distributed by MLS Grid
- 2025-06-20 Listed — RMLSA as Distributed by MLS Grid
- 2007-09-25 Sold (Public Records) $86,000 Public Records
Property tax history
+4.4%/yrLatest (2024): $1,904 · +14.3% YoY. Source: county tax records.
Cash-flow waterfall
monthlySold comps — $/sqft
last 12 mo · ≤1 miLoading sold comps…