 Duplex
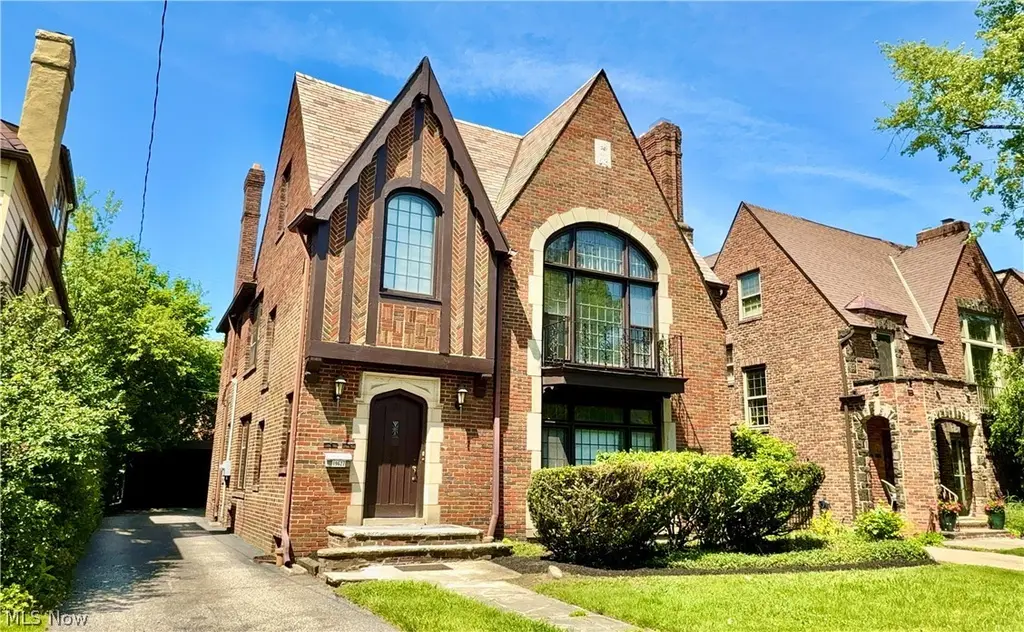
19627 Winslow Rd · Shaker Heights, OH
Flood risk 1/10 · Minimal
- FEMA flood zone
- X (unshaded)
- Chance of flooding over 30 yrs
- 0.0%
- Est. flood insurance / yr
- $507 – $1,088
Fire risk 1/10 · Minimal
- Est. fire insurance / yr
- $713 – $1,323
Heat risk 3/10 · Minor
- Hot days now (above 95°F)
- 7 days/yr
- Hot days in 30 yrs
- 17 days/yr
Wind risk 1/10 · Minimal
- Chance of severe wind over 30 yrs
- —
Air-quality risk 3/10 · Minor
- Unhealthy air days now
- 2 days/yr
- Unhealthy air days in 30 yrs
- 5 days/yr
Risk factors via First Street. Map © Google.
Why this score? — see what drove the F grade
The composite is a weighted blend of 9 inputs, each scored 0–100. Each bar is that input's sub-score; the figure is the points it added to the 100-point composite (weight × sub-score).
- Cash flow +12.0/30.0
- Schools +5.0/10.0
- Livability +4.5/5.0
- 1% rule +4.1/10.0
- DSCR +3.6/10.0
- Rent growth +2.8/5.0
- Condition / age +2.5/5.0
- ARV discount +0.0/15.0
- Appreciation +0.0/10.0
$429,900
🖨 Deal sheet 📄 Offer letter ✓ Due diligence
Multi-family units
County records classify this as Multi-Family (2-4 Unit). Listing-text estimate: 2 units. confirmed
Listing remarks MLS
Majestic 2 family brick Tudor! Features leaded glass windows, vaulted ceilings, beautiful moldings, hardwood floors throughout. Each unit offers; built-in corner cabinets with leaded glass doors in formal dining rooms, sunken living rooms, gorgeous fireplaces, separate dinettes and Butler's pantry off kitchens. Second floor unit has loft leading up to master suite with full bath. Also a finished third floor (attic) suite with full bath. In walking distance to Shaker Van Aken shopping district and more, close to RTA for convenient commuting. Buyer to assume all City of Shaker Heights POS violations. Great opportunity to own this classic beauty!
Key facts
- Upscale kitchen
- Leaded glass windows
- Vaulted ceilings
Tags
Property features AI
Finance
- Other: Lot size approximately 0.1343 acres (assessor)
- Financial info: Tenant pays all utilities; One unit is leased for $2,335/month through January 31, 2027
Exterior
- Parking: Driveway; Detached garage; Off-street parking; 3-car garage
- Utilities: Public water; Public sewer
- Home design: Multifamily building with 1 building
- Construction: Brick construction; Slate roof; Approximately 3,276 above-grade finished area (estimated); Approximately 600 below-grade finished area (estimated)
- Exterior features: Public water; Public sewer
Interior
- Bedrooms: Downstairs unit: 2 bedrooms; Upstairs unit: 5 bedrooms
- Bathrooms: 4 full bathrooms total; Downstairs unit: 1 bathroom; Upstairs unit: 3 bathrooms
- Heating & cooling: Central air conditioning; Forced air heating
- Interior features: Full, partially finished basement; 13 total rooms
Neighborhood map
What this means for you Summary
Snapshot
- This is a 1×4bd/2.0ba + 1×2bd/1.0ba units multifamily listed at $430k.
Deal economics
- At list price, monthly cash flow is $-99 ($-1k/yr) — negative. Per door: $-49/mo.
- To cash-flow at today's rent, offer at most $412k (4.1% below list).
- To meet the 1% rule (rent ≥ 1% of price), the offer needs to be $393k (8.6% below list).
- Recommended offer: $393k (8.6% below list) — sets the bar for 1% rule.
- Cap rate 6.0% vs local median 2.5% in Shaker Heights — top-decile yield for the area; either an underpriced asset or a hidden risk that comps aren't pricing in. Stress-test before assuming the spread holds.
Location & tenants
- Location reads 89/100 on livability (#15 in OH, #134 nationally) — a professional / high-income tenant draw. Strengths: schools A+, crime A+, commute A+; Watch: amenities F.
- Shaker Heights City (suburban): math 50% / reading 63% proficiency, ranked #309 of 656 in OH (top 47%) — acceptable for families but not a draw, mixed tenant base, ~2y average lease.
- Market conditions: Rents rising (+1.1%/yr); 177 active listings in the ZIP; 5 comparable units currently listed for rent nearby; rentals at typical pace (median 16d on market — plan ~3-4 weeks tenant-placement turnaround); solid renter incomes; 1,441 units permitted in Cuyahoga County in 2024 (700 in 5+ unit buildings).
- At $3,930/mo this rent would consume 47% of the median local household income ($101k/yr) (locally 1294% of renters already pay >50% of income on rent) — very limited rent-growth headroom before tenants either downsize or default.
Forward outlook
- Local home prices are declining (-3.0%/yr); year-one equity from $3k of loan paydown is wiped out by about $13k of value loss. Plan a longer hold.
- Cuyahoga County population projected to shrink 8% by 2050 — rents likely to lag national; underwrite the cash flow, not the appreciation.
Negotiation context
- It's been on market 24 days — a 2% lower offer ($423k) is reasonable based on typical stale-listing flexibility.
- 6 sale attempts since 9y ago with the ask held roughly flat each time — persistent listings suggest the price (not the market) is what's stuck; bring a comps-based counter.
- Current owner paid $100k; list at $430k implies a 330% gain — meaningful room to come down on a strong offer.
Risks & watch-outs
- Watch-outs: built in 1928 — expect roof / HVAC / electrical / plumbing capex.
Questions for the listing agent
- What do current leases actually rent for vs. the listed asking? Can we see a recent rent roll and the last 12 months of T-12 income?
- Can we see the unit-by-unit rent roll, current vacancy, and any below-market leases? What's the average tenancy length?
- What capital expenditures (roof, boiler, parking lot, exteriors) have been made in the last 5 years, and what's planned in the next 2?
- Built in 1928 — when were the roof, HVAC, electrical panel, plumbing, and water heater last replaced?
- Is there a deadline driving the sale (1031 exchange, divorce, estate, relocation)? That informs how much negotiation room exists.
- Schools are A-rated — typically a magnet for longer-tenancy family renters. What's the average tenant stay here, and is there a school-zone premium baked into asking?
- The area grade is low — what's the realistic commute time and amenity access for the typical tenant pool here? Any planned neighborhood developments (good or bad) we should know about?
- What's the average days-on-market for RENTAL listings here right now (not sales)? A rising rental-DOM trend means longer vacancies and softer asking-rent achievability than the comps imply.
- What's the recent tenant-quality profile in this submarket — average credit score on applications, eviction rate, late-payment / NSF rate, and stable-employment percentage? A property-management company in the area should have these aggregated.
- How much new apartment / multifamily construction is in the pipeline within 1–3 miles? Heavy new supply (>2% of stock underway) typically softens rents 12–24 months out; light construction supports rent growth.
Investment metrics
- 1% rule
- 0.91% ✗
- Cap rate
- 6.02%
- Cash-on-cash
- -0.98%
- DSCR
- 0.96
- GRM
- 9.1
CMA / ARV
- ARV (on-the-fly)
- $313,092
- Comps found
- 12
Show comp detail 12 sales within ~0.75 mi
| Address | Dist | Beds/Ba | Sqft | Sold | Price | $/sf | Match |
|---|---|---|---|---|---|---|---|
| 19829 Winslow Rd | 0.04mi | 6/4.0 (+1) | 2,846 (+6%) | 1mo | $319,000 | $112 | 82 |
| 19239 Winslow Rd | 0.13mi | 6/2.0 (+1) | 2,656 (-1%) | 5mo | $217,000 | $82 | 75 |
| 19406 Chagrin Blvd | 0.14mi | 6/4.0 (+1) | 2,942 (+10%) | 2mo | $352,000 | $120 | 70 |
| 19835 Winslow Rd | 0.05mi | 6/4.0 (+1) | 3,000 (+12%) | 15mo | $349,900 | $117 | 60 |
| 18424 Newell Rd | 0.50mi | 6/3.0 (+1) | 2,688 (+0%) | 9mo | $310,000 | $115 | 59 |
| 18520 Winslow Rd | 0.43mi | 6/2.0 (+1) | 2,542 (-5%) | 2mo | $331,600 | $130 | 57 |
| 19229 Winslow Rd | 0.14mi | 6/3.0 (+1) | 3,037 (+14%) | 7mo | $390,000 | $128 | 56 |
| 18427 Winslow Rd | 0.48mi | 6/3.0 (+1) | 2,424 (-9%) | 1mo | $334,000 | $138 | 52 |
| 18412 Winslow Rd | 0.51mi | 6/3.0 (+1) | 2,497 (-7%) | 12mo | $295,000 | $118 | 46 |
| 18705 Newell Rd | 0.40mi | 4/3.5 (-1) | 2,472 (-8%) | 21mo | $252,500 | $102 | 44 |
| 18423 Winslow Rd | 0.49mi | 6/3.0 (+1) | 2,975 (+11%) | 13mo | $326,000 | $110 | 38 |
| 3454 Ingleside Rd | 0.73mi | 6/2.0 (+1) | 2,980 (+11%) | 17mo | $203,520 | $68 | 20 |
Match score weights: distance 35% · size 25% · config 20% · recency 20%. Top-matched comps best support the ARV.
Projected returns pro-forma
-3.0% appreciation · 1.15% rent growth · sell at horizon
- IRR
- -20.1%
- Equity multiple
- 0.31×
- Total profit
- $-82,931
- Equity at exit
- $64,099
- IRR
- -18.1%
- Equity multiple
- 0.10×
- Total profit
- $-107,890
- Equity at exit
- $37,170
Cash invested: $120,372 (down + closing). Projections, not guarantees.
Landlord ↔ Tenant lean methodology
- Overall (STATE)
- 73 Landlord-Friendly
- State Ohio
- 73 Landlord-Friendly · R+6
- County
- — inherits STATE
- City
- — inherits STATE
ZIP-level market 44122
- Rents YoY
- 1.1%
- Active inventory
- 177
- Price-to-rent
- 15.7×
Monthly cashflow live
- Estimated rent
- $3,930 high interval (Pro) →
- Mortgage (P&I)
- −$2,254
- Tax from tax record
- −$770 /mo · $9,238/yr
- Insurance
- −$179
- HOA
- −$0
- Vacancy / Maint / Mgmt
- −$825
- Net cashflow
- $-99
Break-even live
2-unit breakdown (identical units grouped — click to expand)
| Units | Beds | Baths | Est. rent |
|---|---|---|---|
| 1× unit | 4 | 2 | $2,282 |
| 1× unit | 2 | 1 | $1,648 |
| Total (2 units) | $3,930 | ||
UW: 25.0% down · 7.5% · 30yr · 1.5% tax · 5.0% vac · 8.0% maint · 8.0% mgmt
Financing live
Cash to close
- Down payment
- $107,475
- Closing costs
- $12,897
- Reserves months
- —
- Total cash needed
- —
Loan-product check · same deal, 3 products live
Conventional
25% down · 7.5% · 30yr
- Down + closing
- —
- Monthly P&I
- —
- Monthly cashflow
- —
- DSCR
- —
- Eligible?
- —
Personal DTI + credit; lowest rate.
DSCR
20% down · 8.5% · 30yr
- Down + closing
- —
- Monthly P&I
- —
- Monthly cashflow
- —
- DSCR
- —
- Eligible?
- —
No personal income docs; deal must DSCR.
Hard money
10% down · 12.0% · 12mo
- Down + closing
- —
- Monthly P&I
- —
- Monthly cashflow
- —
- DSCR
- —
- Eligible?
- —
Short-term bridge; refi at stabilization.
Rent comps 5 comps
| Address | Beds | Baths | Sqft | Rent | $/sqft | DOM | Units | Dist |
|---|---|---|---|---|---|---|---|---|
| 19601 Van Aken Blvd Shaker Heights, OH | 1.0–4.0 | 1.0–4.0 | 1977 | $4,400 | $2.23 | 21d | 1 | 0.09mi |
| 3653 Winchell Rd Unit 2 Shaker Heights, OH | 5.0 | 3.0 | 1775 | $2,350 | $1.32 | 43d | 1 | 0.53mi |
| 2975 Claremont Rd Shaker Heights, OH | 5.0 | 3.0 | 3241 | $3,200 | $0.99 | 11d | 1 | 0.75mi |
| 17424 Winslow Rd Cleveland, OH | 4.0 | 2.0 | 1995 | $2,200 | $1.10 | 16d | 1 | 0.84mi |
| 16818 Kenyon Rd Unit 2 Shaker Heights, OH | 4.0 | 1.0 | 1900 | $1,900 | $1.00 | 4d | 1 | 1.10mi |
Listing history 27 events
-
2026-06-18days on market $429,900 Active 24 DOM
-
2026-06-17days on market $429,900 Active 23 DOM
-
2026-06-16days on market $429,900 Active 22 DOM
-
2026-06-15days on market $429,900 Active 21 DOM
-
2026-06-13days on market $429,900 Active 19 DOM
-
2026-06-13days on market $429,900 Active 18 DOM
-
2026-06-09days on market $429,900 Active 15 DOM
-
2026-06-08days on market $429,900 Active 14 DOM
-
2026-06-07days on market $429,900 Active 13 DOM
-
2026-06-03days on market $429,900 Active 9 DOM
-
2026-06-02days on market $429,900 Active 8 DOM
-
2026-06-01days on market $429,900 Active 7 DOM
-
2026-05-31days on market $429,900 Active 6 DOM
-
2026-05-25$429,900 Active
-
2026-03-09historical $2,300
-
2026-01-31historical $2,300
-
2026-01-16$2,300
-
2025-12-05historical
-
2025-11-06$1,500
-
2025-09-19status Active
-
2025-07-22price $439,000
-
2025-06-06$459,000 Active
-
2017-06-20soldstatus $100,000 Sold 652-char remark
Show marketing remark (652 chars)
Majestic 2 family brick Tudor! Features leaded glass windows, vaulted ceilings, beautiful moldings, hardwood floors throughout. Each unit offers; built-in corner cabinets with leaded glass doors in formal dining rooms, sunken living rooms, gorgeous fireplaces, separate dinettes and Butler's pantry off kitchens. Second floor unit has loft leading up to master suite with full bath. Also a finished third floor (attic) suite with full bath. In walking distance to Shaker Van Aken shopping district and more, close to RTA for convenient commuting. Buyer to assume all City of Shaker Heights POS violations. Great opportunity to own this classic beauty!
-
2017-06-16soldstatus $100,000
-
2017-05-30status Pending 652-char remark
Show marketing remark (652 chars)
Majestic 2 family brick Tudor! Features leaded glass windows, vaulted ceilings, beautiful moldings, hardwood floors throughout. Each unit offers; built-in corner cabinets with leaded glass doors in formal dining rooms, sunken living rooms, gorgeous fireplaces, separate dinettes and Butler's pantry off kitchens. Second floor unit has loft leading up to master suite with full bath. Also a finished third floor (attic) suite with full bath. In walking distance to Shaker Van Aken shopping district and more, close to RTA for convenient commuting. Buyer to assume all City of Shaker Heights POS violations. Great opportunity to own this classic beauty!
-
2017-05-19$129,900 Active 652-char remark
Show marketing remark (652 chars)
Majestic 2 family brick Tudor! Features leaded glass windows, vaulted ceilings, beautiful moldings, hardwood floors throughout. Each unit offers; built-in corner cabinets with leaded glass doors in formal dining rooms, sunken living rooms, gorgeous fireplaces, separate dinettes and Butler's pantry off kitchens. Second floor unit has loft leading up to master suite with full bath. Also a finished third floor (attic) suite with full bath. In walking distance to Shaker Van Aken shopping district and more, close to RTA for convenient commuting. Buyer to assume all City of Shaker Heights POS violations. Great opportunity to own this classic beauty!
-
1974-10-01soldstatus $41,400
ⓘ Source: listings_history table (triggers on properties + properties_extension) + one-shot
backfill from property_details.listing_events for pre-trigger history.
Tax reassessment forecast OH · Partial reset (capped growth)
- Current annual tax
- $9,238 · $770/mo
- Projected year-2 tax
- $9,238 · $770/mo
- Expected delta
- $0/yr ($0/mo · 0.0%)
ⓘ Screening estimate from a state-policy table — verify with the county assessor before closing.
Climate risk First Street
- Flood 1/10 Low FEMA zone X (unshaded) · 0% chance over 30 yrs
- Wildfire 1/10 Low
- Heat 3/10 Moderate 7 d/yr ≥95°F today · 17 d/yr by 30 yrs out
- Wind 1/10 Low
- Air quality 3/10 Moderate 2 unhealthy d/yr today · 5 by 30 yrs out
Nearby sold comps map
Loading sold comps map…
Walkable amenities ~0.75 mi
Loading nearby amenities…
Taxation est. · year 1
- Rental income
- $47,160
- − Mortgage interest
- −$24,081
- − Property taxes
- −$9,238
- − Insurance
- −$2,150
- − Repairs & maintenance
- −$3,773
- − Management
- −$3,773
- − Depreciation
- −$12,506
- Taxable loss
- −$8,361
- Est. tax savings @ 24.0%
- +$2,007
- After-tax cash flow
- $822/yr
For passive investors: Depreciation is non-cash, so a rental often shows a tax loss while cash-flowing — sheltering income. Rental losses are passive: they offset passive income freely, and up to $25,000/yr can offset ordinary (W-2) income if you actively participate and your MAGI is under $100k (phasing out to $0 by $150k); unused losses carry forward. On sale, claimed depreciation is recaptured at up to 25%, and gains may owe capital-gains tax (a 1031 exchange can defer both). Figures are a year-1 estimate at your 24.0% rate — not tax advice; consult a CPA.
Schools (NCES district)
- District
- Shaker Heights City
- NCES district ID
- 3904475
- Math proficiency
- 50% ▼ -16.00%
- Reading proficiency
- 63% ▼ -6.00%
- Median HH income
- $69,421
- Composite
- 49.98/100
- National rank
- #1928
- State rank
- #309 of 656 in OH
Livability — Shaker Heights
- Score
- 89/100
- State rank
- #15
- US rank
- #134
Category grades
Schools grade is shown separately in the Schools card above.
Census & demographics
- Census place
- Shaker Heights, OH
- County
- Cuyahoga County · 1,090,369 people
- City population
- 69,880
- Metro
- Cleveland-Elyria, OH
- Population (ZIP)
- 36,678
- Household income
- $101,230
- Rent vs Own
- Severe rent burden
- 1294.0
Population outlook (Cuyahoga County) Hauer SSP2
- Today (2025)
- 1,244,621 people
- By 2030
- 1,230,093 · -1.2%
- By 2040
- 1,189,108 · -4.5%
- By 2050
- 1,145,706 · -7.9%
- By 2075
- 1,076,557 · -13.5%
- By 2100
- 978,987 · -21.3%
Race, ethnicity, and origin ACS 2023
- Neighborhood character
- Diverse neighborhood (Simpson 0.59)
- Race & ethnicity
- White 56% Black 29% Asian 6% Two or more races 6% Hispanic / Latino 3%
- Common ancestry
- Romanian 6% Scotch-Irish 5% Italian 2%
- Foreign-born
- 12% · Canada, China
- Languages at home
- 85% English-only · Spanish 3% Other Indo-European 3% Chinese 2%
Political lean MEDSL · Cuyahoga
- 2024 margin
- Solid D (+31.5) · D 65.4% · R 33.9%
- 2008→2024 swing
- -7.4pp toward R · 2008: 38.9pp · 2024: 31.5pp
- All cycles
- 2024: D+31.5 2020: D+34.1 2016: D+35.0 2012: D+38.7 2008: D+38.9
Not yet ingested
- Civics
- —
Market trends
- HPI YoY
- ▼ -268.81%
- Current HPI
- 200.5087
- Rent YoY
- ▲ 1.15%
- Metro
- Cleveland-Elyria, OH
- State GDP YoY
- ▲ 1.98%
- F500 in state
- 48
Industry mix (Fortune 500 HQ in OH)
| Industry | F500 HQs | Revenue |
|---|---|---|
| Insurance | 3 | $145B |
|
||
| Industrial Machinery | 3 | $49B |
|
||
| Financial Services | 3 | $24B |
|
||
| Consumer Goods | 2 | $93B |
|
||
| Aerospace / Defense | 2 | $47B |
|
||
| Utilities | 2 | $33B |
|
||
Price history
+938.4% since first listed14 events — show timeline
- 2026-05-25 Listed $429,900 MLSNOW
- 2026-03-09 Rental Removed $2,300 RENTALBEAST
- 2026-01-31 Rental Removed $2,300 RENTALBEAST
- 2026-01-16 Listed for Rent $2,300 RENTALBEAST
- 2025-12-05 Listing Removed — MLSNOW
- 2025-11-06 Listed for Rent $1,500 RENTALBEAST
- 2025-09-19 Relisted — MLSNOW
- 2025-07-22 Price Changed $439,000 MLSNOW
- 2025-06-06 Listed $459,000 MLSNOW
- 2017-06-20 Sold (MLS) $100,000 MLSNOW
- 2017-06-16 Sold (Public Records) $100,000 Public Records
- 2017-05-30 Pending — MLSNOW
- 2017-05-19 Listed $129,900 MLSNOW
- 1974-10-01 Sold (Public Records) $41,400 Public Records
Property tax history
+3.4%/yrLatest (2025): $9,238 · +13.3% YoY. Source: county tax records.
Cash-flow waterfall
monthlySold comps — $/sqft
last 12 mo · ≤1 miLoading sold comps…