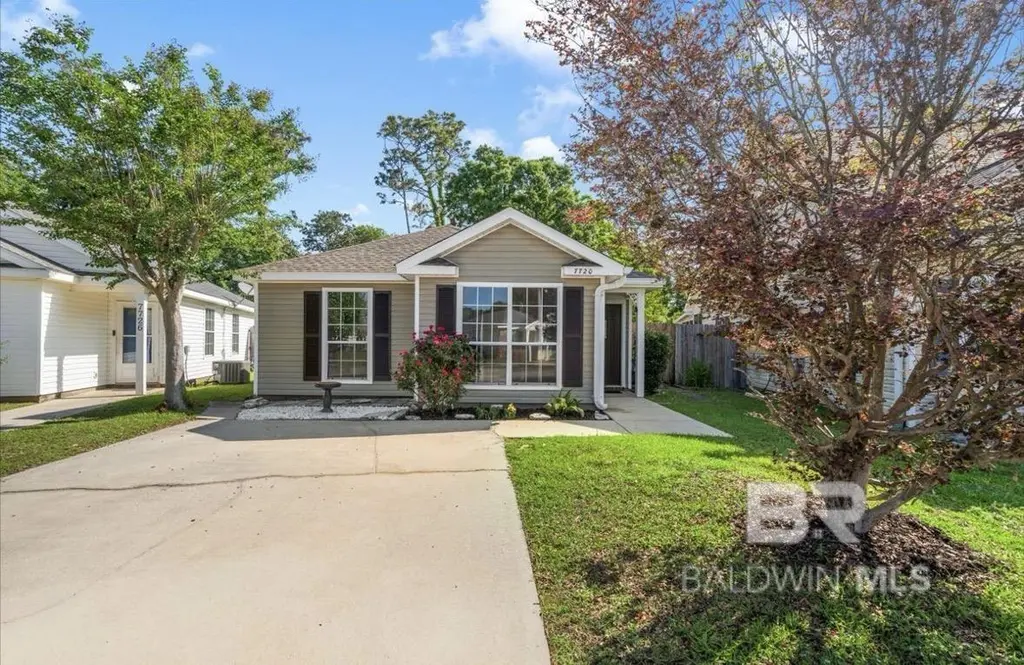
7720 Audubon Dr · Foley, AL
Flood risk 1/10 · Minimal
- FEMA flood zone
- X (unshaded)
- Chance of flooding over 30 yrs
- 0.0%
- Est. flood insurance / yr
- $507 – $1,088
Fire risk 3/10 · Minor
- Est. fire insurance / yr
- $916 – $1,700
Heat risk 10/10 · Severe
- Hot days now (above 105°F)
- 7 days/yr
- Hot days in 30 yrs
- 24 days/yr
Wind risk 9/10 · Severe
- Chance of severe wind over 30 yrs
- 99.0%
Air-quality risk 2/10 · Minimal
- Unhealthy air days now
- 1 days/yr
- Unhealthy air days in 30 yrs
- 1 days/yr
Risk factors via First Street. Map © Google.
Why this score? — see what drove the C+ grade
The composite is a weighted blend of 9 inputs, each scored 0–100. Each bar is that input's sub-score; the figure is the points it added to the 100-point composite (weight × sub-score).
- Cash flow +25.5/30.0
- ARV discount +12.7/15.0
- DSCR +8.5/10.0
- 1% rule +5.5/10.0
- Schools +3.9/10.0
- Livability +3.1/5.0
- Rent growth +3.0/5.0
- Condition / age +2.5/5.0
- Appreciation +0.0/10.0
$210,000
🖨 Deal sheet (PDF) 📄 Offer letter ✓ Due diligence
Listing remarks MLS
Great Home in Foley!!! Here is your opportunity to own a 3 bedroom 2 bathroom house in Foley. This house features a split bedroom plan with large living room. Large master suite has walk-in closet and en-suite. Kitchen is open to dining and convenient to living room. Home Warranty Available. Come see this amazing opportunity now.
Key facts
- Private bath
- Fortified roof
- Newer hvac system
Tags
Property features AI
Finance
- Other: Property is whole/full ownership
- HOA & community: Annual association fee of $260 (includes association management); No community amenities listed
Exterior
- Parking: 2 parking spaces
- Utilities: Public water; Natural gas connected; Riviera Utilities
- Home design: Single-story home; Vinyl siding
- Construction: Vinyl siding construction; Composition roof with fortified roof features; Resale property; One level
- Exterior features: Covered screened porch; Fenced yard; Storage building; No waterfront
Interior
- Kitchen: Dishwasher; Microwave; Electric range; Refrigerator
- Bedrooms: Primary bedroom on main/1st floor with primary bath combo
- Flooring: Other (see remarks)
- Bathrooms: Two full bathrooms
- Heating & cooling: Natural gas heating; Has heating
- Interior features: Vaulted ceilings; Screened covered porch; Storage structure on property; Fenced yard
- Laundry & utility: Washer; Dryer; Gas water heater
Neighborhood map
What this means for you Summary
Snapshot
- This is a 3-bed/2.0-bath single-family listed at $210k.
Deal economics
- At list price, monthly cash flow is $491 ($6k/yr) — positive.
- The deal already cash-flows at list — no discount required.
- Meets the 1% rule at list price ($2k rent vs $210k).
- Recommended offer: $204k (3.0% below list) — sets the bar for market timing.
- Cap rate 9.1% vs local median 4.0% in Foley — top-decile yield for the area; either an underpriced asset or a hidden risk that comps aren't pricing in. Stress-test before assuming the spread holds.
Location & tenants
- Location reads 61/100 on livability (#241 in AL) — a middle-class / working-renter tenant base. Strengths: housing A+, cost of living A-, crime B; Watch: employment D+, amenities F, commute F.
- Baldwin County (rural): math 33% / reading 57% proficiency, ranked #18 of 129 in AL (top 14%) — families likely to look elsewhere, expect single-tenant / working-renter base with shorter leases.
- Zoned schools: Foley Middle School (math 11% / reading 36%, grade F, #172 of 257 statewide, top 68%, 783 students, 82% FRL); Foley High School (math 24% / reading 25%, grade F, #118 of 305 statewide, top 45%, 1,578 students, 75% FRL) — zoned schools average 79% FRL vs 38% district-wide (40 pts higher); higher-poverty schools than district average — tighter screening recommended.
- Zoned-school proficiency averages 24% at this address vs 45% district-wide (-21 pts) — the specific schools serving this property underperform the Baldwin County average; the district grade overstates school quality for this exact location.
- Market conditions: Rents rising (+1.8%/yr); 883 active listings in the ZIP; 10 comparable units currently listed for rent nearby; rentals at typical pace (median 22d on market — plan ~3-4 weeks tenant-placement turnaround); 3,883 units permitted in Baldwin County in 2024 (481 in 5+ unit buildings).
- This rent runs 40% of the median local income ($67k/yr) — at the standard rent-burdened threshold; future hikes will face affordability resistance.
Forward outlook
- Local home prices are declining (-3.0%/yr); year-one equity from $1k of loan paydown is wiped out by about $6k of value loss. Plan a longer hold.
- Baldwin County population projected at +42% by 2050 — long-run rental-demand tailwind backs the buy-and-hold thesis.
Negotiation context
- It's been on market 35 days — a 3% lower offer ($204k) is reasonable based on typical stale-listing flexibility.
- 3 sale attempts since 8y ago with the ask held roughly flat each time — persistent listings suggest the price (not the market) is what's stuck; bring a comps-based counter.
- Current owner paid $114k; list at $210k implies a 84% gain — meaningful room to come down on a strong offer.
Risks & watch-outs
- Climate carrying-cost: severe wind risk, 99% chance of damaging wind over 30y; extreme-heat days projected 7→24/yr by 2055 (HVAC capex compounding) — expect insurance premiums to compound above CPI over the hold.
Questions for the listing agent
- It's been on market 35 days. Have you received any prior offers? Is the seller open to a 3% concession, seller financing, or rate buy-down credit?
- What does the HOA fee cover, when was the last increase, and are there any pending special assessments or reserve-fund shortfalls?
- Is there a deadline driving the sale (1031 exchange, divorce, estate, relocation)? That informs how much negotiation room exists.
- Schools are D-rated, which usually means shorter tenancies and higher turnover. Who's the typical renter profile here, and what's been the actual vacancy rate?
- What's the average days-on-market for RENTAL listings here right now (not sales)? A rising rental-DOM trend means longer vacancies and softer asking-rent achievability than the comps imply.
- What's the recent tenant-quality profile in this submarket — average credit score on applications, eviction rate, late-payment / NSF rate, and stable-employment percentage? A property-management company in the area should have these aggregated.
- How much new for-sale + rental construction is in the pipeline within 1–3 miles? Heavy new supply typically softens prices + rents 12–24 months out; constrained supply supports both.
Investment metrics
- 1% rule
- 1.05% ✓
- Cap rate
- 9.10%
- Cash-on-cash
- 10.03%
- DSCR
- 1.45
- GRM
- 7.9
CMA / ARV
- ARV (on-the-fly)
- $237,176
- Comps found
- 7
Show comp detail 7 sales within ~0.75 mi
| Address | Dist | Beds/Ba | Sqft | Sold | Price | $/sf | Match |
|---|---|---|---|---|---|---|---|
| 7636 Audubon Dr | 0.09mi | 3/2.0 | 1,175 (-9%) | 1mo | $208,000 | $177 | 80 |
| 7544 Audubon Dr | 0.20mi | 3/2.0 | 1,175 (-9%) | 4mo | $216,000 | $184 | 73 |
| 7899 Audubon Dr | 0.15mi | 3/2.0 | 1,175 (-9%) | 8mo | $215,000 | $183 | 72 |
| 7660 Audubon Dr | 0.06mi | 3/2.0 | 1,184 (-8%) | 18mo | $209,000 | $177 | 68 |
| 8204 Carmel Cir | 0.52mi | 3/2.0 | 1,331 (+3%) | 5mo | $305,000 | $229 | 66 |
| 7946 Audubon Dr | 0.20mi | 3/2.0 | 1,175 (-9%) | 12mo | $220,000 | $187 | 66 |
| 7907 Audubon Dr | 0.15mi | 3/2.0 | 1,184 (-8%) | 17mo | $229,000 | $193 | 65 |
Match score weights: distance 35% · size 25% · config 20% · recency 20%. Top-matched comps best support the ARV.
Projected returns pro-forma
-3.0% appreciation · 1.81% rent growth · sell at horizon
- IRR
- -2.5%
- Equity multiple
- 0.91×
- Total profit
- $-5,445
- Equity at exit
- $31,312
- IRR
- 5.9%
- Equity multiple
- 1.42×
- Total profit
- $24,714
- Equity at exit
- $18,157
Cash invested: $58,800 (down + closing). Projections, not guarantees.
Landlord ↔ Tenant lean methodology
- Overall (STATE)
- 90 Strongly Landlord-Friendly
- State Alabama
- 90 Strongly Landlord-Friendly · R+15
- County
- — inherits STATE
- City
- — inherits STATE
ZIP-level market 36535
- Home prices YoY
- -24.9%
- Rents YoY
- 1.8%
- Active inventory
- 883
- Price-to-rent
- 7.9×
Monthly cashflow live
- Estimated rent
- $2,210 high interval (Pro) →
- Mortgage (P&I)
- −$1,101
- Tax from tax record
- −$44 /mo · $524/yr
- Insurance
- −$88
- HOA
- −$22
- Vacancy / Maint / Mgmt
- −$464
- Net cashflow
- $491
Break-even live
Sensitivity live
| Price | -10% $610 | -5% $551 | +0% $491 | +5% $432 | +10% $372 |
|---|---|---|---|---|---|
| Rent | -10% $317 | -5% $404 | +0% $491 | +5% $579 | +10% $666 |
| Rate | -1.0pp $597 | -0.5pp $545 | base $491 | +0.5pp $437 | +1.0pp $381 |
UW: 25.0% down · 7.5% · 30yr · 1.5% tax · 5.0% vac · 8.0% maint · 8.0% mgmt
Financing live
Cash to close
- Down payment
- $52,500
- Closing costs
- $6,300
- Reserves months
- —
- Total cash needed
- —
Loan-product check · same deal, 3 products live
Conventional
25% down · 7.5% · 30yr
- Down + closing
- —
- Monthly P&I
- —
- Monthly cashflow
- —
- DSCR
- —
- Eligible?
- —
Personal DTI + credit; lowest rate.
DSCR
20% down · 8.5% · 30yr
- Down + closing
- —
- Monthly P&I
- —
- Monthly cashflow
- —
- DSCR
- —
- Eligible?
- —
No personal income docs; deal must DSCR.
Hard money
10% down · 12.0% · 12mo
- Down + closing
- —
- Monthly P&I
- —
- Monthly cashflow
- —
- DSCR
- —
- Eligible?
- —
Short-term bridge; refi at stabilization.
Rent comps 10 comps
| Address | Beds | Baths | Sqft | Rent | $/sqft | DOM | Units | Dist |
|---|---|---|---|---|---|---|---|---|
| 212 Burnston Way Foley, AL | 4.0 | 2.0 | 1768 | $2,175 | $1.23 | 44d | 1 | 0.32mi |
| 224 Fulham Ln Foley, AL | 4.0 | 2.0 | 1787 | $2,100 | $1.18 | 14d | 1 | 0.39mi |
| 20215 Edison Ave Foley, AL | 1.0–3.0 | 1.0–2.0 | 1008 | $1,950 | $1.93 | 14d | 53 | 0.41mi |
| 8088 Carmel Cir Foley, AL | 3.0 | 2.0 | 1693 | $2,300 | $1.36 | 14d | 1 | 0.47mi |
| 263 Preston Way Gulf Shores, AL | 4.0 | 2.0 | 1787 | $2,400 | $1.34 | 14d | 1 | 0.86mi |
| 392 Parkerman Ave Gulf Shores, AL | 4.0 | 2.0 | 1835 | $2,600 | $1.42 | 22d | 1 | 1.05mi |
| 452 Parkerman Ave Gulf Shores, AL | 4.0 | 2.0 | 1835 | $2,600 | $1.42 | 22d | 1 | 1.05mi |
| 417 Parkerman Ave Gulf Shores, AL | 4.0 | 2.0 | 1835 | $2,500 | $1.36 | 14d | 1 | 1.05mi |
| 3855 Stardust Dr Foley, AL | 2.0–3.0 | 2.0–3.0 | 1533 | $2,200 | $1.43 | 22d | 1 | 1.36mi |
| 21150 Coastal Gateway Blvd Gulf Shores, AL | 3.0 | 2.5 | 1516 | $1,699 | $1.12 | 22d | 1 | 1.49mi |
HOA detail
- Monthly dues
- $22 · $264/yr
Listing history 12 events
-
2026-05-31status $210,000 Pending 35 DOM
-
2026-05-31days on market $210,000 Active 35 DOM
-
2026-05-30days on market $210,000 Active 34 DOM
-
2026-05-25status Active
-
2026-05-21status Pending
-
2026-05-01historical Active Under Contract
-
2026-04-23$210,000 Active
-
2018-03-23soldstatus $114,318
-
2018-03-22soldstatus $114,900 332-char remark
Show marketing remark (332 chars)
Great Home in Foley!!! Here is your opportunity to own a 3 bedroom 2 bathroom house in Foley. This house features a split bedroom plan with large living room. Large master suite has walk-in closet and en-suite. Kitchen is open to dining and convenient to living room. Home Warranty Available. Come see this amazing opportunity now.
-
2018-01-16$114,900 332-char remark
Show marketing remark (332 chars)
Great Home in Foley!!! Here is your opportunity to own a 3 bedroom 2 bathroom house in Foley. This house features a split bedroom plan with large living room. Large master suite has walk-in closet and en-suite. Kitchen is open to dining and convenient to living room. Home Warranty Available. Come see this amazing opportunity now.
-
2009-09-11soldstatus $73,226
-
2009-07-15soldstatus $46,600
ⓘ Source: listings_history table (triggers on properties + properties_extension) + one-shot
backfill from property_details.listing_events for pre-trigger history.
Tax reassessment forecast AL · Resets to sale price
- Current annual tax
- $524 · $44/mo
- Projected year-2 tax
- $861 · $72/mo
- Expected delta
- +$337/yr (+$28/mo · 64.2%)
ⓘ Screening estimate from a state-policy table — verify with the county assessor before closing.
Climate risk First Street
- Flood 1/10 Low FEMA zone X (unshaded) · 0% chance over 30 yrs
- Wildfire 3/10 Moderate
- Heat 10/10 Extreme 7 d/yr ≥105°F today · 24 d/yr by 30 yrs out
- Wind 9/10 Extreme 99% chance of damaging wind over 30 yrs
- Air quality 2/10 Low 1 unhealthy d/yr today · 1 by 30 yrs out
Nearby sold comps map
Loading sold comps map…
Walkable amenities ~0.75 mi
Loading nearby amenities…
Taxation est. · year 1
- Rental income
- $26,517
- − Mortgage interest
- −$11,763
- − Property taxes
- −$524
- − Insurance
- −$1,050
- − Repairs & maintenance
- −$2,121
- − Management
- −$2,121
- − HOA
- −$264
- − Depreciation
- −$6,109
- Taxable income
- $2,563
- Est. tax owed @ 24.0%
- −$615
- After-tax cash flow
- $5,280/yr
For passive investors: Depreciation is non-cash, so a rental often shows a tax loss while cash-flowing — sheltering income. Rental losses are passive: they offset passive income freely, and up to $25,000/yr can offset ordinary (W-2) income if you actively participate and your MAGI is under $100k (phasing out to $0 by $150k); unused losses carry forward. On sale, claimed depreciation is recaptured at up to 25%, and gains may owe capital-gains tax (a 1031 exchange can defer both). Figures are a year-1 estimate at your 24.0% rate — not tax advice; consult a CPA.
Schools (NCES district)
- District
- Baldwin County
- NCES district ID
- 0100270
- Math proficiency
- 33% ▼ -26.00%
- Reading proficiency
- 57% ▲ 1.00%
- Median HH income
- $50,677
- Composite
- 38.61/100
- National rank
- #4157
- State rank
- #18 of 129 in AL
Livability — Foley
- Score
- 61/100
- State rank
- #241
- US rank
- #17616
Category grades
Schools grade is shown separately in the Schools card above.
Census & demographics
- County
- Baldwin County · 181,514 people
- City population
- 40,628
- Metro
- Daphne-Fairhope-Foley, AL
- Population (ZIP)
- 40,628
- Household income
- $66,714
- Rent vs Own
- Severe rent burden
- 803.0
Population outlook (Baldwin County) Hauer SSP2
- Today (2025)
- 248,264 people
- By 2030
- 270,315 · +8.9%
- By 2040
- 312,967 · +26.1%
- By 2050
- 352,262 · +41.9%
- By 2075
- 438,841 · +76.8%
- By 2100
- 487,736 · +96.5%
Race, ethnicity, and origin ACS 2023
- Neighborhood character
- Predominantly White (78%)
- Race & ethnicity
- White 78% Hispanic / Latino 10% Two or more races 8% Black 5% Asian 2%
- Hispanic origin (detail)
- Mexican 6%
- Common ancestry
- Lithuanian 2% Romanian 2% Slovak 1%
- Foreign-born
- 6% · Canada, China
- Languages at home
- 89% English-only · Spanish 7% Other Indo-European 2% Chinese 1%
Political lean MEDSL · Baldwin
- 2024 margin
- Solid R (+58.2) · D 20.5% · R 78.7%
- 2008→2024 swing
- -6.7pp toward R · 2008: -51.5pp · 2024: -58.2pp
- All cycles
- 2024: R+58.2 2020: R+53.8 2016: R+57.8 2012: R+55.8 2008: R+51.5
Not yet ingested
- Civics
- —
Market trends
- HPI YoY
- ▼ -86.82%
- Current HPI
- 262.2796
- Rent YoY
- ▲ 1.81%
- Metro
- Daphne-Fairhope-Foley, AL
- State GDP YoY
- ▲ 2.94%
- F500 in state
- 4
Industry mix (Fortune 500 HQ in AL)
| Industry | F500 HQs | Revenue |
|---|---|---|
| Financial Services | 1 | $8B |
|
||
| Healthcare | 1 | $5B |
|
||
Price history
+350.6% since first listed9 events — show timeline
- 2026-05-25 Relisted — BCAR
- 2026-05-21 Pending — BCAR
- 2026-05-01 Contingent — BCAR
- 2026-04-23 Listed $210,000 BCAR
- 2018-03-23 Sold (Public Records) $114,318 Public Records
- 2018-03-22 Sold (MLS) $114,900 BCAR
- 2018-01-16 Listed $114,900 BCAR
- 2009-09-11 Sold (Public Records) $73,226 Public Records
- 2009-07-15 Sold (Public Records) $46,600 Public Records
Property tax history
+14.4%/yrLatest (2025): $524 · +12.5% YoY. Source: county tax records.
Cash-flow waterfall
monthlySold comps — $/sqft
last 12 mo · ≤1 miLoading sold comps…