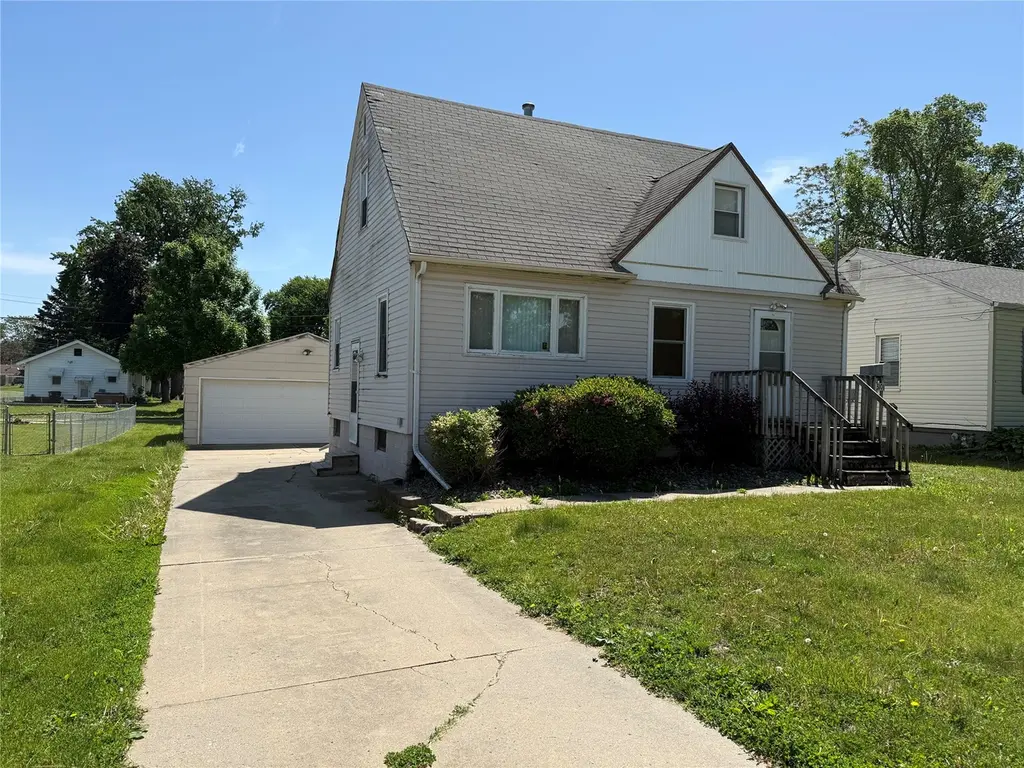
3101 Cambridge St · Des Moines, IA
Flood risk 1/10 · Minimal
- FEMA flood zone
- X (unshaded)
- Chance of flooding over 30 yrs
- 0.0%
- Est. flood insurance / yr
- $473 – $860
Fire risk 1/10 · Minimal
- Est. fire insurance / yr
- $902 – $1,676
Heat risk 3/10 · Minor
- Hot days now (above 103°F)
- 7 days/yr
- Hot days in 30 yrs
- 15 days/yr
Wind risk 2/10 · Minimal
- Chance of severe wind over 30 yrs
- —
Air-quality risk 2/10 · Minimal
- Unhealthy air days now
- 1 days/yr
- Unhealthy air days in 30 yrs
- 2 days/yr
Risk factors via First Street. Map © Google.
Why this score? — see what drove the C grade
The composite is a weighted blend of 9 inputs, each scored 0–100. Each bar is that input's sub-score; the figure is the points it added to the 100-point composite (weight × sub-score).
- Cash flow +16.3/30.0
- ARV discount +15.0/15.0
- 1% rule +5.2/10.0
- DSCR +5.0/10.0
- Rent growth +5.0/5.0
- Livability +4.0/5.0
- Schools +3.8/10.0
- Condition / age +2.5/5.0
- Appreciation +0.0/10.0
$130,000
🖨 Deal sheet (PDF) 📄 Offer letter ✓ Due diligence
Listing remarks
Great investment, close to elementary & Jr High, restaurants, grocery story and easy access to freeway. 2 car detached garage, great for hobbyist or car person. The Furnace, A/C and electrical panel all replaced 8 yrs ago. This home is ready for someone to give it new life.
Key facts
- Detached garage
- 6,550 sq ft lot
- 2 garage spots
Tags
Property features AI
Finance
- Financial info: Annual tax amount available
- HOA & community: Located in a senior community
Exterior
- Parking: Detached two-car garage
- Security: Smoke detector(s)
- Utilities: Public water; Public sewer
- Home design: Vinyl-sided exterior; Asphalt shingle roof; Block foundation
- Construction: Vinyl siding construction; Asphalt shingle roof; Block foundation
- Exterior features: Partial fencing; Fence
Interior
- Kitchen: Cooktop; Stove; Microwave; Dishwasher; Refrigerator
- Bedrooms: 1 main-level bedroom
- Flooring: Hardwood
- Bathrooms: 1 full bathroom
- Heating & cooling: Forced air heating (natural gas); Central air conditioning
- Interior features: Dining area; Partially finished basement
- Laundry & utility: Washer; Dryer
Neighborhood map
What this means for you Summary
Snapshot
- This is a 3-bed/1.0-bath single-family listed at $130k.
Deal economics
- At list price, monthly cash flow is $71 ($847/yr) — positive.
- The deal already cash-flows at list — no discount required.
- Meets the 1% rule at list price ($1k rent vs $130k).
- Cap rate 6.9% vs local median 3.1% in Des Moines — top-decile yield for the area; either an underpriced asset or a hidden risk that comps aren't pricing in. Stress-test before assuming the spread holds.
Location & tenants
- Location reads 81/100 on livability (#63 in IA, #1,432 nationally) — a professional / high-income tenant draw. Strengths: commute A+, cost of living A+, housing A+; Watch: employment C-, schools D+, crime F.
- Des Moines Independent Community School District (urban): math 43% / reading 46% proficiency, ranked #289 of 289 in IA (top 100%) — families likely to look elsewhere, expect single-tenant / working-renter base with shorter leases; 63% free/reduced lunch — lower-income household profile, screen leases tightly.
- Market conditions: Rents rising fast (+13.1%/yr); 156 active listings in the ZIP; 10 comparable units currently listed for rent nearby; rentals at typical pace (median 25d on market — plan ~3-4 weeks tenant-placement turnaround); 40% of comp listings sitting > 30 days — soft ceiling on asking rent; 2,953 units permitted in Polk County in 2024 (540 in 5+ unit buildings).
Forward outlook
- Local home prices are declining (-3.0%/yr); year-one equity from $899 of loan paydown is wiped out by about $4k of value loss. Plan a longer hold.
- Polk County population projected at +37% by 2050 — long-run rental-demand tailwind backs the buy-and-hold thesis.
- At projected returns (-3.0% appreciation + 8.0% rent growth), your $36k cash investment doubles in ~10 years — after that, you're playing with house money.
Negotiation context
- Only 8 days on market — expect competitive offers; lowballing is unlikely to land.
- 2 sale attempts with the ask held roughly flat each time — persistent listings suggest the price (not the market) is what's stuck; bring a comps-based counter.
- Current owner paid $102k; 27% above their basis — modest negotiation headroom, anchor on the comps not their cost.
Risks & watch-outs
- Watch-outs: built in 1942 — expect roof / HVAC / electrical / plumbing capex.
Questions for the listing agent
- Built in 1942 — when were the roof, HVAC, electrical panel, plumbing, and water heater last replaced?
- Is there a deadline driving the sale (1031 exchange, divorce, estate, relocation)? That informs how much negotiation room exists.
- Schools are D-rated, which usually means shorter tenancies and higher turnover. Who's the typical renter profile here, and what's been the actual vacancy rate?
- Crime grade is F in this area — have there been break-ins, vandalism, or insurance claims at this property in the last 3 years? What carrier currently insures it and at what premium?
- What's the average days-on-market for RENTAL listings here right now (not sales)? A rising rental-DOM trend means longer vacancies and softer asking-rent achievability than the comps imply.
- What's the recent tenant-quality profile in this submarket — average credit score on applications, eviction rate, late-payment / NSF rate, and stable-employment percentage? A property-management company in the area should have these aggregated.
- How much new for-sale + rental construction is in the pipeline within 1–3 miles? Heavy new supply typically softens prices + rents 12–24 months out; constrained supply supports both.
Investment metrics
- 1% rule
- 1.02% ✓
- Cap rate
- 6.94%
- Cash-on-cash
- 2.33%
- DSCR
- 1.10
- GRM
- 8.1
CMA / ARV
- ARV (median comp)
- $170,821
- List price
- $130,000
- Delta
- -23.90%
- Verdict
- UNDERPRICED
- Comps
- 20 within 1.0 mi
Show comp detail 12 sales within ~0.75 mi
| Address | Dist | Beds/Ba | Sqft | Sold | Price | $/sf | Match |
|---|---|---|---|---|---|---|---|
| 2919 1st St | 0.15mi | 3/1.0 | 1,153 (-1%) | 0mo | $135,000 | $117 | 91 |
| 3109 4th St | 0.31mi | 2/1.0 (-1) | 1,156 (-0%) | 2mo | $165,000 | $143 | 78 |
| 3421 Amherst St | 0.34mi | 3/2.0 | 1,197 (+3%) | 1mo | $205,000 | $171 | 74 |
| 2915 3rd St | 0.26mi | 3/1.0 | 1,030 (-11%) | 2mo | $173,000 | $168 | 67 |
| 2915 4th St | 0.33mi | 3/1.0 | 1,042 (-10%) | 1mo | $161,500 | $155 | 66 |
| 3109 E 9th St | 0.54mi | 3/1.0 | 1,214 (+4%) | 1mo | $237,500 | $196 | 66 |
| 3006 3rd St | 0.28mi | 2/1.0 (-1) | 1,274 (+10%) | 2mo | $227,000 | $178 | 64 |
| 3007 E 8th St | 0.41mi | 3/2.0 | 1,065 (-8%) | 1mo | $181,000 | $170 | 62 |
| 1305 E Oak Park Ave | 0.71mi | 3/1.5 | 1,223 (+5%) | 0mo | $175,000 | $143 | 56 |
| 3837 3rd St | 0.58mi | 3/1.0 | 1,292 (+11%) | 2mo | $229,900 | $178 | 53 |
| 2327 E 9th St | 0.72mi | 2/1.0 (-1) | 1,034 (-11%) | 1mo | $220,000 | $213 | 42 |
| 4012 Amherst St | 0.75mi | 2/1.0 (-1) | 1,008 (-13%) | 1mo | $70,000 | $69 | 37 |
Match score weights: distance 35% · size 25% · config 20% · recency 20%. Top-matched comps best support the ARV.
Projected returns pro-forma
-3.0% appreciation · 8.0% rent growth · sell at horizon
- IRR
- -6.7%
- Equity multiple
- 0.74×
- Total profit
- $-9,472
- Equity at exit
- $19,383
- IRR
- 8.6%
- Equity multiple
- 1.82×
- Total profit
- $29,810
- Equity at exit
- $11,240
Cash invested: $36,400 (down + closing). Projections, not guarantees.
Landlord ↔ Tenant lean methodology
- Overall (STATE)
- 83 Strongly Landlord-Friendly
- State Iowa
- 83 Strongly Landlord-Friendly · R+6
- County
- — inherits STATE
- City
- — inherits STATE
ZIP-level market 50313
- Rents YoY
- 13.1%
- Active inventory
- 156
- Price-to-rent
- 8.1×
Monthly cashflow live
- Estimated rent
- $1,330 high interval (Pro) →
- Mortgage (P&I)
- −$682
- Tax from tax record
- −$244 /mo · $2,928/yr
- Insurance
- −$54
- HOA
- −$0
- Vacancy / Maint / Mgmt
- −$279
- Net cashflow
- $71
Break-even live
Sensitivity live
| Price | -10% $144 | -5% $107 | +0% $71 | +5% $34 | +10% $-3 |
|---|---|---|---|---|---|
| Rent | -10% $-34 | -5% $18 | +0% $71 | +5% $123 | +10% $176 |
| Rate | -1.0pp $136 | -0.5pp $104 | base $71 | +0.5pp $37 | +1.0pp $3 |
UW: 25.0% down · 7.5% · 30yr · 1.5% tax · 5.0% vac · 8.0% maint · 8.0% mgmt
Financing live
Cash to close
- Down payment
- $32,500
- Closing costs
- $3,900
- Reserves months
- —
- Total cash needed
- —
Loan-product check · same deal, 3 products live
Conventional
25% down · 7.5% · 30yr
- Down + closing
- —
- Monthly P&I
- —
- Monthly cashflow
- —
- DSCR
- —
- Eligible?
- —
Personal DTI + credit; lowest rate.
DSCR
20% down · 8.5% · 30yr
- Down + closing
- —
- Monthly P&I
- —
- Monthly cashflow
- —
- DSCR
- —
- Eligible?
- —
No personal income docs; deal must DSCR.
Hard money
10% down · 12.0% · 12mo
- Down + closing
- —
- Monthly P&I
- —
- Monthly cashflow
- —
- DSCR
- —
- Eligible?
- —
Short-term bridge; refi at stabilization.
Rent comps 10 comps
| Address | Beds | Baths | Sqft | Rent | $/sqft | DOM | Units | Dist |
|---|---|---|---|---|---|---|---|---|
| 3103 E 7th St Des Moines, IA | 2.0 | 1.0 | 960 | $1,200 | $1.25 | 45d | 1 | 0.34mi |
| 3623 Cambridge St Des Moines, IA | 2.0 | 1.0 | 732 | $1,145 | $1.56 | 20d | 1 | 0.38mi |
| 3410 5th Ave Des Moines, IA | 4.0 | 2.0 | 1474 | $1,550 | $1.05 | 45d | 1 | 0.47mi |
| 4124 3rd St Des Moines, IA | 3.0 | 1.0 | 996 | $1,595 | $1.60 | 15d | 1 | 0.94mi |
| 1914 10th St Des Moines, IA | 2.0 | 1.0 | 740 | $1,050 | $1.42 | 24d | 1 | 1.09mi |
| 1914 10th St Des Moines, IA | 2.0 | 1.0 | 740 | $1,050 | $1.42 | 45d | 1 | 1.09mi |
| 915 E Washington Ave Des Moines, IA | 3.0 | 1.0 | 1457 | $1,450 | $1.00 | 24d | 1 | 1.20mi |
| 1530 E 14th St Des Moines, IA | 3.0 | 2.0 | 1428 | $1,900 | $1.33 | 15d | 1 | 1.33mi |
| 1438 9th St Des Moines, IA | 2.0 | 1.0 | 700 | $745 | $1.06 | 22d | 1 | 1.40mi |
| 1354 E 12th St Des Moines, IA | 2.0 | 1.0 | 1300 | $925 | $0.71 | 45d | 1 | 1.40mi |
Listing history 3 events
-
2026-05-17status Pending 280-char remark
-
2026-05-14$130,000 Active 280-char remark
-
2005-04-20soldstatus $102,000
ⓘ Source: listings_history table (triggers on properties + properties_extension) + one-shot
backfill from property_details.listing_events for pre-trigger history.
Tax reassessment forecast IA · Partial reset (capped growth)
- Current annual tax
- $2,928 · $244/mo
- Projected year-2 tax
- $2,928 · $244/mo
- Expected delta
- $0/yr ($0/mo · 0.0%)
ⓘ Screening estimate from a state-policy table — verify with the county assessor before closing.
Climate risk First Street
- Flood 1/10 Low FEMA zone X (unshaded) · 0% chance over 30 yrs
- Wildfire 1/10 Low
- Heat 3/10 Moderate 7 d/yr ≥103°F today · 15 d/yr by 30 yrs out
- Wind 2/10 Low
- Air quality 2/10 Low 1 unhealthy d/yr today · 2 by 30 yrs out
Nearby sold comps map
Loading sold comps map…
Walkable amenities ~0.75 mi
Loading nearby amenities…
Taxation est. · year 1
- Rental income
- $15,957
- − Mortgage interest
- −$7,282
- − Property taxes
- −$2,928
- − Insurance
- −$650
- − Repairs & maintenance
- −$1,277
- − Management
- −$1,277
- − Depreciation
- −$3,782
- Taxable loss
- −$1,238
- Est. tax savings @ 24.0%
- +$297
- After-tax cash flow
- $1,144/yr
For passive investors: Depreciation is non-cash, so a rental often shows a tax loss while cash-flowing — sheltering income. Rental losses are passive: they offset passive income freely, and up to $25,000/yr can offset ordinary (W-2) income if you actively participate and your MAGI is under $100k (phasing out to $0 by $150k); unused losses carry forward. On sale, claimed depreciation is recaptured at up to 25%, and gains may owe capital-gains tax (a 1031 exchange can defer both). Figures are a year-1 estimate at your 24.0% rate — not tax advice; consult a CPA.
Schools (NCES district)
- District
- Des Moines Independent Community School District
- NCES district ID
- 1908970
- Math proficiency
- 43% ▼ -6.00%
- Reading proficiency
- 46% ▼ -1.00%
- Median HH income
- $45,905
- Composite
- 37.83/100
- National rank
- #4331
- State rank
- #289 of 289 in IA
Livability — Des Moines
- Score
- 81/100
- State rank
- #63
- US rank
- #1432
Category grades
Schools grade is shown separately in the Schools card above.
Census & demographics
- Census place
- Des Moines, IA
- County
- Polk County · 453,298 people
- City population
- 203,612
- Metro
- Des Moines-West Des Moines, IA
- Population (ZIP)
- 17,440
- Household income
- $68,361
- Rent vs Own
- Severe rent burden
- 454.0
Population outlook (Polk County) Hauer SSP2
- Today (2025)
- 548,042 people
- By 2030
- 588,557 · +7.4%
- By 2040
- 670,629 · +22.4%
- By 2050
- 752,830 · +37.4%
- By 2075
- 955,069 · +74.3%
- By 2100
- 1,115,436 · +103.5%
Race, ethnicity, and origin ACS 2023
- Neighborhood character
- Diverse neighborhood (Simpson 0.58)
- Race & ethnicity
- White 61% Hispanic / Latino 17% Black 11% Two or more races 8% Asian 6%
- Hispanic origin (detail)
- Mexican 11%
- Common ancestry
- Iranian 3% Portuguese 2% Scotch-Irish 2%
- Foreign-born
- 16% · Canada, Philippines, Vietnam
- Languages at home
- 75% English-only · Spanish 14% Other Asian/Pacific 4% Russian/Polish/Slavic 1%
Political lean MEDSL · Polk
- 2024 margin
- D (+10.9) · D 54.8% · R 43.9% · Other 1.3%
- 2008→2024 swing
- -3.7pp toward R · 2008: 14.6pp · 2024: 10.9pp
- All cycles
- 2024: D+10.9 2020: D+15.2 2016: D+11.5 2012: D+14.2 2008: D+14.6
Not yet ingested
- Civics
- —
Market trends
- HPI YoY
- ▼ -162.17%
- Current HPI
- 285.5708
- Rent YoY
- ▲ 13.11%
- Metro
- Des Moines-West Des Moines, IA
- State GDP YoY
- ▲ 2.48%
- F500 in state
- 4
Industry mix (Fortune 500 HQ in IA)
| Industry | F500 HQs | Revenue |
|---|---|---|
| Financial Services | 1 | $16B |
|
||
| Retail / Convenience | 1 | $15B |
|
||
Price history
+27.5% since first listed5 events — show timeline
- 2026-05-27 Pending — DMMLS
- 2026-05-22 Relisted — DMMLS
- 2026-05-17 Pending — DMMLS
- 2026-05-14 Listed $130,000 DMMLS
- 2005-04-20 Sold (Public Records) $102,000 Public Records
Property tax history
+2.1%/yrLatest (2025): $2,928 · +2.4% YoY. Source: county tax records.
Cash-flow waterfall
monthlySold comps — $/sqft
last 12 mo · ≤1 miLoading sold comps…