 Duplex
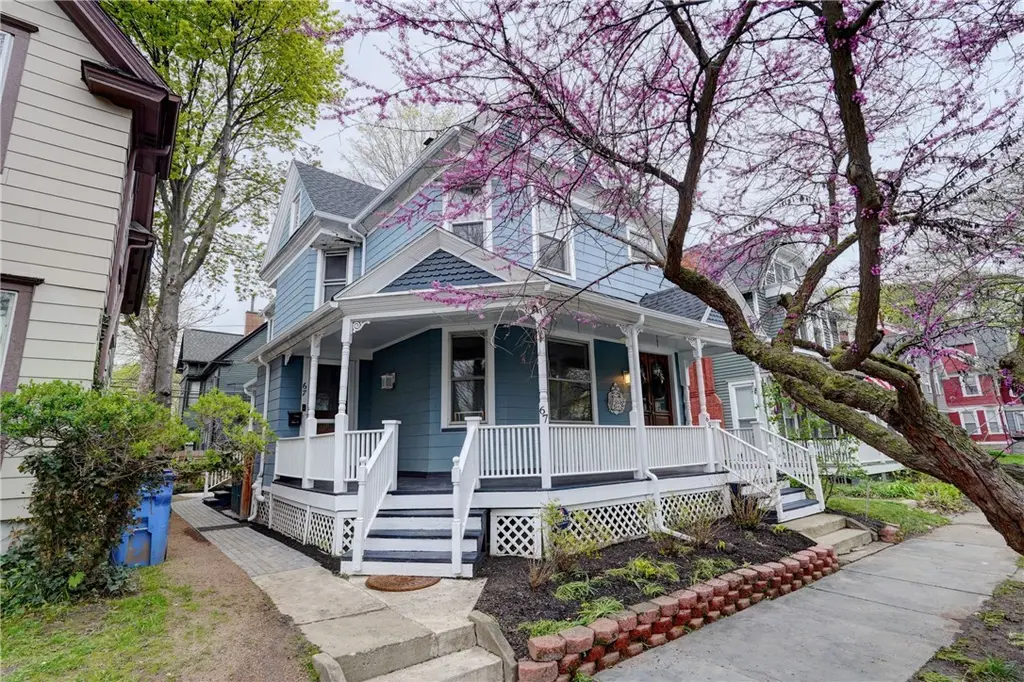
65-67 Oxford St · Rochester, NY
Flood risk 1/10 · Minimal
- FEMA flood zone
- X (unshaded)
- Chance of flooding over 30 yrs
- 0.0%
- Est. flood insurance / yr
- $473 – $860
Fire risk 1/10 · Minimal
- Est. fire insurance / yr
- $691 – $1,283
Heat risk 2/10 · Minimal
- Hot days now (above 95°F)
- 7 days/yr
- Hot days in 30 yrs
- 15 days/yr
Wind risk 1/10 · Minimal
- Chance of severe wind over 30 yrs
- —
Air-quality risk 2/10 · Minimal
- Unhealthy air days now
- 1 days/yr
- Unhealthy air days in 30 yrs
- 2 days/yr
Risk factors via First Street. Map © Google.
Why this score? — see what drove the B- grade
The composite is a weighted blend of 9 inputs, each scored 0–100. Each bar is that input's sub-score; the figure is the points it added to the 100-point composite (weight × sub-score).
- Cash flow +25.5/30.0
- ARV discount +15.0/15.0
- DSCR +8.5/10.0
- 1% rule +6.3/10.0
- Livability +3.8/5.0
- Rent growth +3.7/5.0
- Condition / age +2.5/5.0
- Schools +1.9/10.0
- Appreciation +0.0/10.0
$349,900
🖨 Deal sheet (PDF) 📄 Offer letter ✓ Due diligence
Multi-family units
County records classify this as Multi-Family (2-4 Unit). Listing-text estimate: 2 units. confirmed
Listing remarks
Timeless character meets modern versatility in this beautifully maintained Colonial-style multi-family home, ideally positioned in one of the city’s most vibrant and walkable locations. Blending early-century charm with thoughtful updates, this property offers an exceptional opportunity for both owner-occupants and investors alike. The first-floor unit showcases a spacious three-bedroom, one-bath layout designed for comfortable living and effortless entertaining. A welcoming living room flows into a fully renovated, eat-in chef’s kitchen featuring quartz countertops, a premium Kucht gas range, stainless steel refrigerator, and custom banquet seating. Residents enjoy access to a
Key facts
- Finished third floor
- Dedicated laundry
- 2,825 sq ft lot
Tags
Property features AI
Finance
- Financial info: Tenant pays all utilities; Operating expense details: see remarks
Exterior
- Parking: Paved parking
- Utilities: Cable available; Electricity connected with circuit breakers; Public water connected; Sewer connected
- Home design: Two-story building; Existing/Resale property; Residential 2-unit zoning
- Construction: Built with composite siding; Blown-in insulation; Copper and PEX plumbing; Asphalt architectural shingle roof; Stone foundation
- Exterior features: Fence (partial); Covered patio/porch; Patio; Porch; Located in a historic district; Near public transit; Rectangular residential lot; City street frontage
Interior
- Kitchen: Gas water heater (appliance); Energy-efficient appliances and lighting
- Bedrooms: Two-unit property (unit-level bedroom counts not provided)
- Flooring: Ceramic tile; Hardwood; Luxury vinyl; Varies by area
- Bathrooms: Two full bathrooms
- Heating & cooling: Gas forced-air heating; Central air conditioning
- Interior features: Attic; Natural woodwork; Programmable thermostat
- Laundry & utility: Separate gas meters for each unit; Separate electric meters for each unit
Neighborhood map
What this means for you Summary
Snapshot
- This is a 2 × 3-bed/1-bath units multifamily listed at $350k.
Deal economics
- At list price, monthly cash flow is $820 ($10k/yr) — positive. Per door: $410/mo.
- The deal already cash-flows at list — no discount required.
- Meets the 1% rule at list price ($4k rent vs $350k).
Location & tenants
- Location reads 76/100 on livability (#222 in NY, #3,482 nationally) — a middle-class / working-renter tenant base. Strengths: commute A+, cost of living A+, housing A+; Watch: schools D+, crime F, employment F.
- Rochester City School District (urban): math 21% / reading 26% proficiency, ranked #589 of 590 in NY (top 100%) — low school quality limits family demand, transient renter base, plan for 1-2y turnover; 82% free/reduced lunch — lower-income household profile, screen leases tightly.
- Market conditions: Rents rising fast (+4.6%/yr); 55 active listings in the ZIP; 6 comparable units currently listed for rent nearby; rentals at typical pace (median 16d on market — plan ~3-4 weeks tenant-placement turnaround); 1,169 units permitted in Monroe County in 2024 (591 in 5+ unit buildings).
- At $3,961/mo this rent would consume 80% of the median local household income ($60k/yr) (locally 2034% of renters already pay >50% of income on rent) — very limited rent-growth headroom before tenants either downsize or default.
Forward outlook
- Local home prices are declining (-3.0%/yr); year-one equity from $2k of loan paydown is wiped out by about $10k of value loss. Plan a longer hold.
- Monroe County population projected to shrink 6% by 2050 — rents likely to lag national; underwrite the cash flow, not the appreciation.
- At projected returns (-3.0% appreciation + 4.6% rent growth), your $98k cash investment doubles in ~9 years — after that, you're playing with house money.
Negotiation context
- Only 5 days on market — expect competitive offers; lowballing is unlikely to land.
Risks & watch-outs
- Watch-outs: built in 1900 — expect roof / HVAC / electrical / plumbing capex.
Questions for the listing agent
- Can we see the unit-by-unit rent roll, current vacancy, and any below-market leases? What's the average tenancy length?
- What capital expenditures (roof, boiler, parking lot, exteriors) have been made in the last 5 years, and what's planned in the next 2?
- Built in 1900 — when were the roof, HVAC, electrical panel, plumbing, and water heater last replaced?
- Is there a deadline driving the sale (1031 exchange, divorce, estate, relocation)? That informs how much negotiation room exists.
- Schools are D-rated, which usually means shorter tenancies and higher turnover. Who's the typical renter profile here, and what's been the actual vacancy rate?
- Crime grade is F in this area — have there been break-ins, vandalism, or insurance claims at this property in the last 3 years? What carrier currently insures it and at what premium?
- What's the average days-on-market for RENTAL listings here right now (not sales)? A rising rental-DOM trend means longer vacancies and softer asking-rent achievability than the comps imply.
- What's the recent tenant-quality profile in this submarket — average credit score on applications, eviction rate, late-payment / NSF rate, and stable-employment percentage? A property-management company in the area should have these aggregated.
- How much new apartment / multifamily construction is in the pipeline within 1–3 miles? Heavy new supply (>2% of stock underway) typically softens rents 12–24 months out; light construction supports rent growth.
Investment metrics
- 1% rule
- 1.13% ✓
- Cap rate
- 9.11%
- Cash-on-cash
- 10.05%
- DSCR
- 1.45
- GRM
- 7.4
CMA / ARV
- ARV (median comp)
- $699,517
- List price
- $349,900
- Delta
- -49.98%
- Verdict
- UNDERPRICED
- Comps
- 20 within 1.0 mi
Show comp detail 12 sales within ~0.75 mi
| Address | Dist | Beds/Ba | Sqft | Sold | Price | $/sf | Match |
|---|---|---|---|---|---|---|---|
| 31 Rundel Park | 0.10mi | 4/2.0 | 3,266 (+12%) | 12mo | $350,000 | $107 | 66 |
| 8 Rowley St | 0.45mi | 4/— | 3,199 (+9%) | 4mo | $300,000 | $94 | 61 |
| 115 Rutgers St St | 0.48mi | 4/3.0 | 3,201 (+9%) | 0mo | $440,000 | $137 | 58 |
| 48 Vick Park B | 0.31mi | 4/2.0 | 2,632 (-10%) | 14mo | $385,000 | $146 | 57 |
| 15 Edgerton St | 0.44mi | 4/3.0 | 2,761 (-6%) | 13mo | $525,000 | $190 | 56 |
| 10 Brighton St | 0.51mi | 3/2.0 (-1) | 2,832 (-3%) | 22mo | $249,000 | $88 | 47 |
| 33 Birch Cres | 0.40mi | 5/2.0 (+1) | 2,518 (-14%) | 7mo | $305,000 | $121 | 47 |
| 57 Grand Ave | 0.75mi | 4/2.0 | 2,846 (-3%) | 19mo | $75,000 | $26 | 44 |
| 18 Rowley St | 0.48mi | 4/3.0 | 2,730 (-7%) | 24mo | $370,000 | $136 | 42 |
| 164 Brunswick St | 0.74mi | 4/4.0 | 3,015 (+3%) | 14mo | $480,000 | $159 | 41 |
| 275 S Goodman St | 0.53mi | 5/3.0 (+1) | 2,621 (-10%) | 11mo | $375,000 | $143 | 39 |
| 31 Park Ave | 0.55mi | 5/4.5 (+1) | 2,828 (-3%) | 20mo | $460,000 | $163 | 37 |
Match score weights: distance 35% · size 25% · config 20% · recency 20%. Top-matched comps best support the ARV.
Projected returns pro-forma
-3.0% appreciation · 4.6% rent growth · sell at horizon
- IRR
- 0.5%
- Equity multiple
- 1.02×
- Total profit
- $2,009
- Equity at exit
- $52,171
- IRR
- 11.7%
- Equity multiple
- 1.98×
- Total profit
- $96,449
- Equity at exit
- $30,253
Cash invested: $97,972 (down + closing). Projections, not guarantees.
Landlord ↔ Tenant lean methodology
- Overall (STATE)
- 15 Strongly Tenant-Friendly
- State New York
- 15 Strongly Tenant-Friendly · D+10
- County
- — inherits STATE
- City
- — inherits STATE
ZIP-level market 14607
- Home prices YoY
- -10.7%
- Rents YoY
- 4.6%
- Active inventory
- 55
- Price-to-rent
- 14.7×
Monthly cashflow live
- Estimated rent
- $3,961 high interval (Pro) →
- Mortgage (P&I)
- −$1,835
- Tax from tax record
- −$328 /mo · $3,940/yr
- Insurance
- −$146
- HOA
- −$0
- Vacancy / Maint / Mgmt
- −$832
- Net cashflow
- $820
Break-even live
Sensitivity live
| Price | -10% $1,018 | -5% $919 | +0% $820 | +5% $721 | +10% $622 |
|---|---|---|---|---|---|
| Rent | -10% $507 | -5% $664 | +0% $820 | +5% $977 | +10% $1,133 |
| Rate | -1.0pp $996 | -0.5pp $909 | base $820 | +0.5pp $729 | +1.0pp $637 |
2-unit breakdown (identical units grouped — click to expand)
| Units | Beds | Baths | Est. rent |
|---|---|---|---|
| 2× units | 3 | 1 | $3,960 |
| #1 | 3 | 1 | $1,980 |
| #2 | 3 | 1 | $1,980 |
| Total (2 units) | $3,961 | ||
UW: 25.0% down · 7.5% · 30yr · 1.5% tax · 5.0% vac · 8.0% maint · 8.0% mgmt
Financing live
Cash to close
- Down payment
- $87,475
- Closing costs
- $10,497
- Reserves months
- —
- Total cash needed
- —
Loan-product check · same deal, 3 products live
Conventional
25% down · 7.5% · 30yr
- Down + closing
- —
- Monthly P&I
- —
- Monthly cashflow
- —
- DSCR
- —
- Eligible?
- —
Personal DTI + credit; lowest rate.
DSCR
20% down · 8.5% · 30yr
- Down + closing
- —
- Monthly P&I
- —
- Monthly cashflow
- —
- DSCR
- —
- Eligible?
- —
No personal income docs; deal must DSCR.
Hard money
10% down · 12.0% · 12mo
- Down + closing
- —
- Monthly P&I
- —
- Monthly cashflow
- —
- DSCR
- —
- Eligible?
- —
Short-term bridge; refi at stabilization.
Rent comps 6 comps
| Address | Beds | Baths | Sqft | Rent | $/sqft | DOM | Units | Dist |
|---|---|---|---|---|---|---|---|---|
| 256 Oxford St Unit 1 Rochester, NY | 3.0 | 1.0 | 2050 | $3,000 | $1.46 | 15d | 1 | 0.26mi |
| 1 Champeney Ter Rochester, NY | 3.0 | 1.0 | 1936 | $1,650 | $0.85 | 15d | 1 | 0.73mi |
| 42 Wilcox St Rochester, NY | 3.0 | 1.0 | 2184 | $1,695 | $0.78 | 45d | 1 | 0.79mi |
| 57 Calumet St Rochester, NY | 3.0 | 3.0 | 2500 | $2,250 | $0.90 | 15d | 1 | 0.94mi |
| 34 Shepard St Rochester, NY | 4.0 | 1.5 | 2347 | $800 | $0.34 | 45d | 1 | 0.99mi |
| 145 Macbeth St Rochester, NY | 3.0 | 1.0 | 3484 | $2,200 | $0.63 | 4d | 1 | 1.31mi |
Listing history 5 events
-
2026-05-05status Pending 1870-char remark
-
2026-04-30$349,900 Active 1870-char remark
-
2020-09-17soldstatus $315,000
-
2019-01-11soldstatus $262,500
-
2004-02-02soldstatus $162,000
ⓘ Source: listings_history table (triggers on properties + properties_extension) + one-shot
backfill from property_details.listing_events for pre-trigger history.
Tax reassessment forecast NY · Partial reset (capped growth)
- Current annual tax
- $3,940 · $328/mo
- Projected year-2 tax
- $4,927 · $411/mo
- Expected delta
- +$987/yr (+$82/mo · 25.0%)
ⓘ Screening estimate from a state-policy table — verify with the county assessor before closing.
Climate risk First Street
- Flood 1/10 Low FEMA zone X (unshaded) · 0% chance over 30 yrs
- Wildfire 1/10 Low
- Heat 2/10 Low 7 d/yr ≥95°F today · 15 d/yr by 30 yrs out
- Wind 1/10 Low
- Air quality 2/10 Low 1 unhealthy d/yr today · 2 by 30 yrs out
Nearby sold comps map
Loading sold comps map…
Walkable amenities ~0.75 mi
Loading nearby amenities…
Taxation est. · year 1
- Rental income
- $47,532
- − Mortgage interest
- −$19,600
- − Property taxes
- −$3,940
- − Insurance
- −$1,750
- − Repairs & maintenance
- −$3,803
- − Management
- −$3,803
- − Depreciation
- −$10,179
- Taxable income
- $4,459
- Est. tax owed @ 24.0%
- −$1,070
- After-tax cash flow
- $8,772/yr
For passive investors: Depreciation is non-cash, so a rental often shows a tax loss while cash-flowing — sheltering income. Rental losses are passive: they offset passive income freely, and up to $25,000/yr can offset ordinary (W-2) income if you actively participate and your MAGI is under $100k (phasing out to $0 by $150k); unused losses carry forward. On sale, claimed depreciation is recaptured at up to 25%, and gains may owe capital-gains tax (a 1031 exchange can defer both). Figures are a year-1 estimate at your 24.0% rate — not tax advice; consult a CPA.
Schools (NCES district)
- District
- Rochester City School District
- NCES district ID
- 3624750
- Math proficiency
- 21% ▬ 0.00%
- Reading proficiency
- 26% ▲ 4.00%
- Median HH income
- $30,923
- Composite
- 18.98/100
- National rank
- #8850
- State rank
- #589 of 590 in NY
Livability — Rochester
- Score
- 76/100
- State rank
- #222
- US rank
- #3482
Category grades
Schools grade is shown separately in the Schools card above.
Census & demographics
- Census place
- Rochester, NY
- County
- Monroe County · 674,131 people
- City population
- 432,803
- Metro
- Rochester, NY
- Population (ZIP)
- 17,891
- Household income
- $59,787
- Rent vs Own
- Severe rent burden
- 2034.0
Population outlook (Monroe County) Hauer SSP2
- Today (2025)
- 759,460 people
- By 2030
- 757,154 · -0.3%
- By 2040
- 740,644 · -2.5%
- By 2050
- 714,443 · -5.9%
- By 2075
- 645,883 · -15.0%
- By 2100
- 547,084 · -28.0%
Race, ethnicity, and origin ACS 2023
- Neighborhood character
- Predominantly White (78%)
- Race & ethnicity
- White 78% Black 8% Two or more races 7% Hispanic / Latino 6% Asian 2%
- Hispanic origin (detail)
- Puerto Rican 2%
- Common ancestry
- Romanian 5% Slovak 4% Scotch-Irish 2%
- Foreign-born
- 7% · Canada, South Korea
- Languages at home
- 90% English-only · Spanish 5% Other Indo-European 1% Russian/Polish/Slavic 1%
Political lean MEDSL · Monroe
- 2024 margin
- D (+19.1) · D 59.5% · R 40.5%
- 2008→2024 swing
- +1.4pp toward D · 2008: 17.7pp · 2024: 19.1pp
- All cycles
- 2024: D+19.1 2020: D+21.0 2016: D+14.1 2012: D+17.4 2008: D+17.7
Not yet ingested
- Civics
- —
Market trends
- HPI YoY
- ▼ -35.72%
- Current HPI
- 297.8107
- Rent YoY
- ▲ 4.60%
- Metro
- Rochester, NY
- State GDP YoY
- ▲ 2.60%
- F500 in state
- 92
Industry mix (Fortune 500 HQ in NY)
| Industry | F500 HQs | Revenue |
|---|---|---|
| Financial Services | 10 | $950B |
|
||
| Consumer Goods | 9 | $162B |
|
||
| Insurance | 4 | $225B |
|
||
| Telecommunications | 2 | $144B |
|
||
| Pharmaceuticals | 2 | $112B |
|
||
| Media / Entertainment | 2 | $69B |
|
||
Price history
+116.0% since first listed5 events — show timeline
- 2026-05-05 Pending — UNYREIS
- 2026-04-30 Listed $349,900 UNYREIS
- 2020-09-17 Sold (Public Records) $315,000 Public Records
- 2019-01-11 Sold (Public Records) $262,500 Public Records
- 2004-02-02 Sold (Public Records) $162,000 Public Records
Property tax history
+5.6%/yrLatest (2025): $3,940 · +2.5% YoY. Source: county tax records.
Cash-flow waterfall
monthlySold comps — $/sqft
last 12 mo · ≤1 miLoading sold comps…