 Multi-family
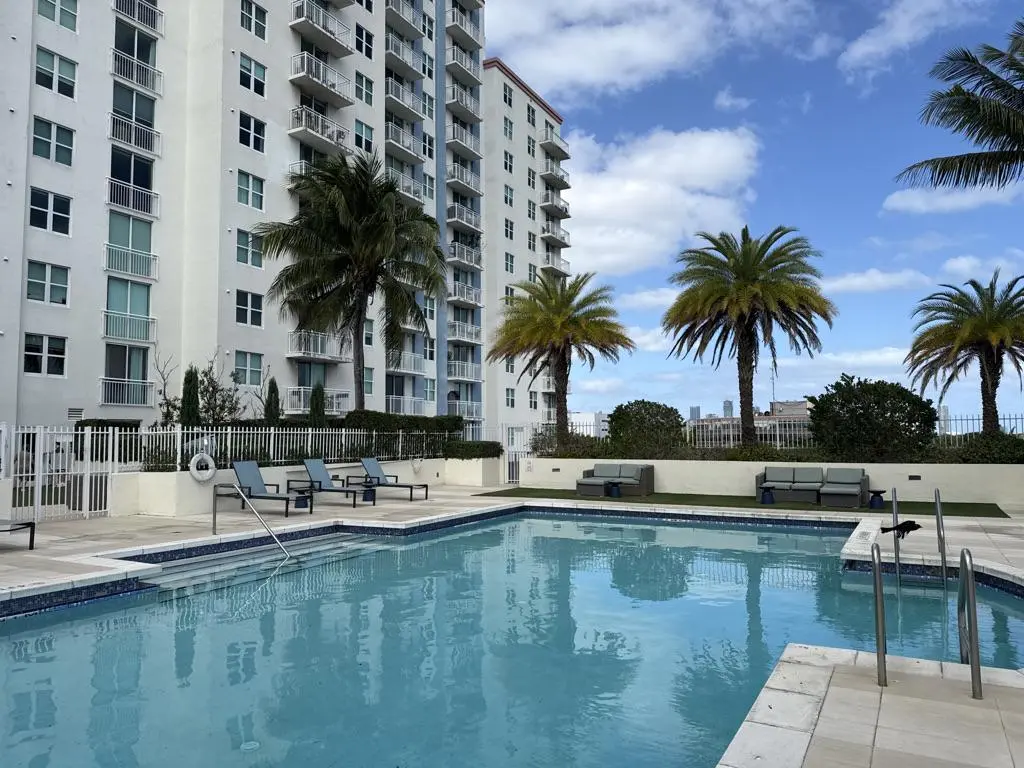
3000 Coral Way · Miami, FL
Flood risk 4/10 · Minor
- FEMA flood zone
- X (unshaded)
- Chance of flooding over 30 yrs
- 0.22%
- Est. flood insurance / yr
- $507 – $1,088
Fire risk 1/10 · Minimal
- Est. fire insurance / yr
- $947 – $1,759
Heat risk 10/10 · Severe
- Hot days now (above 104°F)
- 4 days/yr
- Hot days in 30 yrs
- 15 days/yr
Wind risk 10/10 · Severe
- Chance of severe wind over 30 yrs
- 99.0%
Air-quality risk 2/10 · Minimal
- Unhealthy air days now
- 1 days/yr
- Unhealthy air days in 30 yrs
- 1 days/yr
Risk factors via First Street. Map © Google.
Why this score? — see what drove the D+ grade
The composite is a weighted blend of 9 inputs, each scored 0–100. Each bar is that input's sub-score; the figure is the points it added to the 100-point composite (weight × sub-score).
- Cash flow +17.6/30.0
- ARV discount +7.5/15.0
- DSCR +5.5/10.0
- 1% rule +4.7/10.0
- Schools +4.2/10.0
- Livability +3.9/5.0
- Rent growth +3.2/5.0
- Condition / age +2.5/5.0
- Appreciation +0.0/10.0
$335,000
🖨 Deal sheet 📄 Offer letter ✓ Due diligence
Multi-family units
County records classify this as Multi-Family (5+ Unit). Listing-text estimate: 1 unit. estimate disagrees with records
5+ unit building — per-unit beds/baths from public records are typically unavailable; the breakdown below (if shown) is an estimate from the listing text.
Listing remarks
Wake up to breathtaking panoramic views of the Brickell skyline and the lush tree canopy of Coral Gables. Located at the prestigious 3000 Coral Way, this 10th-floor condo (#1007) offers the perfect blend of serene luxury and urban convenience, without the Brickell price tag. Step inside this well-appointed 1-bedroom, 1-bath retreat where natural light pours in all day. The open layout is perfect for a professional, first-time buyer, or investor looking for a turnkey asset in a high-demand rental market. This unit comes with a dedicated, private parking space, a non-negotiable luxury in Miami. Live the & quot; Gables& quot; Lifestyle: Ditch the car: Walk to Merrick Park, Miracle Mil
Key facts
- Walk to merrick park
- Walk to miracle mile
- Panoramic views
Tags
Property features AI
Finance
- Other: Located in Miami-Dade County
- HOA & community: Located in the Coral Gables subdivision
Exterior
- Parking: 1-car garage
- Security: Controlled access
- Home design: Built in 2003; Condo/attached property
- Exterior features: Controlled access community
Interior
- Kitchen: Dishwasher; Refrigerator
- Flooring: Tile
- Interior features: Tile flooring
Neighborhood map
What this means for you Summary
Snapshot
- This is a 1-bed/1.0-bath multifamily listed at $335k.
Deal economics
- At list price, monthly cash flow is $261 ($3k/yr) — positive.
- The deal already cash-flows at list — no discount required.
- To meet the 1% rule (rent ≥ 1% of price), the offer needs to be $326k (2.7% below list).
- Recommended offer: $325k (3.0% below list) — sets the bar for market timing.
- Cap rate 7.2% vs local median 1.9% in Miami — top-decile yield for the area; either an underpriced asset or a hidden risk that comps aren't pricing in. Stress-test before assuming the spread holds.
Location & tenants
- Location reads 78/100 on livability (#177 in FL, #2,724 nationally) — a middle-class / working-renter tenant base. Strengths: amenities A+, commute A+, health & safety A+; Watch: employment C-, crime F, cost of living F.
- Miami-Dade (suburban): math 45% / reading 54% proficiency, ranked #40 of 73 in FL (top 55%) — families likely to look elsewhere, expect single-tenant / working-renter base with shorter leases; 64% free/reduced lunch — lower-income household profile, screen leases tightly.
- Market conditions: Rents rising (+2.7%/yr); 225 active listings in the ZIP; 1 comparable units currently listed for rent nearby; 10,051 units permitted in Miami-Dade County in 2024 (7,758 in 5+ unit buildings).
- At $3,261/mo this rent would consume 53% of the median local household income ($74k/yr) (locally 1517% of renters already pay >50% of income on rent) — very limited rent-growth headroom before tenants either downsize or default.
Forward outlook
- Local home prices are declining (-3.0%/yr); year-one equity from $2k of loan paydown is wiped out by about $10k of value loss. Plan a longer hold.
- Miami-Dade County population projected at +28% by 2050 — long-run rental-demand tailwind backs the buy-and-hold thesis.
Negotiation context
- It's been on market 58 days — a 3% lower offer ($325k) is reasonable based on typical stale-listing flexibility.
- 8 sale attempts since 3y ago with the ask held roughly flat each time — persistent listings suggest the price (not the market) is what's stuck; bring a comps-based counter.
- Current owner paid $217k; list at $335k implies a 54% gain — meaningful room to come down on a strong offer.
Risks & watch-outs
- Climate carrying-cost: severe wind risk, 99% chance of damaging wind over 30y; extreme-heat days projected 4→15/yr by 2055 (HVAC capex compounding) — expect insurance premiums to compound above CPI over the hold.
Questions for the listing agent
- It's been on market 58 days. Have you received any prior offers? Is the seller open to a 3% concession, seller financing, or rate buy-down credit?
- Is there a deadline driving the sale (1031 exchange, divorce, estate, relocation)? That informs how much negotiation room exists.
- Schools are B-rated — typically a magnet for longer-tenancy family renters. What's the average tenant stay here, and is there a school-zone premium baked into asking?
- Crime grade is F in this area — have there been break-ins, vandalism, or insurance claims at this property in the last 3 years? What carrier currently insures it and at what premium?
- The area grade is low — what's the realistic commute time and amenity access for the typical tenant pool here? Any planned neighborhood developments (good or bad) we should know about?
- What's the average days-on-market for RENTAL listings here right now (not sales)? A rising rental-DOM trend means longer vacancies and softer asking-rent achievability than the comps imply.
- What's the recent tenant-quality profile in this submarket — average credit score on applications, eviction rate, late-payment / NSF rate, and stable-employment percentage? A property-management company in the area should have these aggregated.
- How much new apartment / multifamily construction is in the pipeline within 1–3 miles? Heavy new supply (>2% of stock underway) typically softens rents 12–24 months out; light construction supports rent growth.
Investment metrics
- 1% rule
- 0.97% ✗
- Cap rate
- 7.23%
- Cash-on-cash
- 3.34%
- DSCR
- 1.15
- GRM
- 8.6
CMA / ARV
No comps found within radius.
Projected returns pro-forma
-3.0% appreciation · 2.73% rent growth · sell at horizon
- IRR
- -11.3%
- Equity multiple
- 0.59×
- Total profit
- $-38,481
- Equity at exit
- $49,950
- IRR
- -2.5%
- Equity multiple
- 0.83×
- Total profit
- $-15,492
- Equity at exit
- $28,965
Cash invested: $93,800 (down + closing). Projections, not guarantees.
Landlord ↔ Tenant lean methodology
- Overall (STATE)
- 87 Strongly Landlord-Friendly
- State Florida
- 87 Strongly Landlord-Friendly · R+3
- County
- — inherits STATE
- City
- — inherits STATE
ZIP-level market 33145
- Rents YoY
- 2.7%
- Active inventory
- 225
- Price-to-rent
- 8.6×
Monthly cashflow live
- Estimated rent
- $3,261 medium interval (Pro) →
- Mortgage (P&I)
- −$1,757
- Tax est. 1.5%
- −$419 /mo · $5,025/yr
- Insurance
- −$140
- HOA
- −$0
- Vacancy / Maint / Mgmt
- −$685
- Net cashflow
- $261
Break-even live
UW: 25.0% down · 7.5% · 30yr · 1.5% tax · 5.0% vac · 8.0% maint · 8.0% mgmt
Financing live
Cash to close
- Down payment
- $83,750
- Closing costs
- $10,050
- Reserves months
- —
- Total cash needed
- —
Loan-product check · same deal, 3 products live
Conventional
25% down · 7.5% · 30yr
- Down + closing
- —
- Monthly P&I
- —
- Monthly cashflow
- —
- DSCR
- —
- Eligible?
- —
Personal DTI + credit; lowest rate.
DSCR
20% down · 8.5% · 30yr
- Down + closing
- —
- Monthly P&I
- —
- Monthly cashflow
- —
- DSCR
- —
- Eligible?
- —
No personal income docs; deal must DSCR.
Hard money
10% down · 12.0% · 12mo
- Down + closing
- —
- Monthly P&I
- —
- Monthly cashflow
- —
- DSCR
- —
- Eligible?
- —
Short-term bridge; refi at stabilization.
Rent comps 1 comps
| Address | Beds | Baths | Sqft | Rent | $/sqft | DOM | Units | Dist |
|---|---|---|---|---|---|---|---|---|
| 1710 SW 27th Ave Unit 1272101P Miami, FL | 1.0–5.0 | 1.0–4.0 | 1716 | $3,855 | $2.25 | 7d | 3 | 0.44mi |
Listing history 30 events
-
2026-06-18days on market $335,000 Active 58 DOM
-
2026-06-17days on market $335,000 Active 57 DOM
-
2026-06-16days on market $335,000 Active 56 DOM
-
2026-06-15days on market $335,000 Active 55 DOM
-
2026-06-13days on market $335,000 Active 53 DOM
-
2026-06-09days on market $335,000 Active 49 DOM
-
2026-06-08days on market $335,000 Active 48 DOM
-
2026-06-08days on market $335,000 Active 47 DOM
-
2026-06-04days on market $335,000 Active 44 DOM
-
2026-06-03days on market $335,000 Active 43 DOM
-
2026-06-02days on market $335,000 Active 42 DOM
-
2026-06-01days on market $335,000 Active 41 DOM
-
2026-05-31days on market $335,000 Active 40 DOM
-
2026-05-25historical $2,800
-
2026-04-22$335,000 Active
-
2026-04-16$2,800
-
2026-04-12historical $2,500
-
2026-04-02$2,500
-
2026-04-01historical $2,500
-
2026-04-01price $2,500
-
2026-03-03$2,650
-
2025-02-24historical $4,500
-
2025-01-29$4,500
-
2024-06-21status Active
-
2024-06-20$519,000 Active
-
2024-06-20price $519,000
-
2024-04-10historical $2,600
-
2023-10-28$2,600
-
2003-12-22soldstatus $217,000
-
2003-08-27soldstatus $218,000
ⓘ Source: listings_history table (triggers on properties + properties_extension) + one-shot
backfill from property_details.listing_events for pre-trigger history.
Climate risk First Street
- Flood 4/10 Moderate FEMA zone X (unshaded) · 22% chance over 30 yrs
- Wildfire 1/10 Low
- Heat 10/10 Extreme 4 d/yr ≥104°F today · 15 d/yr by 30 yrs out
- Wind 10/10 Extreme 99% chance of damaging wind over 30 yrs
- Air quality 2/10 Low 1 unhealthy d/yr today · 1 by 30 yrs out
Nearby sold comps map
Loading sold comps map…
Walkable amenities ~0.75 mi
Loading nearby amenities…
Taxation est. · year 1
- Rental income
- $39,134
- − Mortgage interest
- −$18,765
- − Property taxes
- −$5,025
- − Insurance
- −$1,675
- − Repairs & maintenance
- −$3,131
- − Management
- −$3,131
- − Depreciation
- −$9,745
- Taxable loss
- −$2,338
- Est. tax savings @ 24.0%
- +$561
- After-tax cash flow
- $3,696/yr
For passive investors: Depreciation is non-cash, so a rental often shows a tax loss while cash-flowing — sheltering income. Rental losses are passive: they offset passive income freely, and up to $25,000/yr can offset ordinary (W-2) income if you actively participate and your MAGI is under $100k (phasing out to $0 by $150k); unused losses carry forward. On sale, claimed depreciation is recaptured at up to 25%, and gains may owe capital-gains tax (a 1031 exchange can defer both). Figures are a year-1 estimate at your 24.0% rate — not tax advice; consult a CPA.
Schools (NCES district)
- District
- Miami-Dade
- NCES district ID
- 1200390
- Math proficiency
- 45% ▼ -16.00%
- Reading proficiency
- 54% ▼ -5.00%
- Median HH income
- $43,928
- Composite
- 41.76/100
- National rank
- #3397
- State rank
- #40 of 73 in FL
Livability — Miami
- Score
- 78/100
- State rank
- #177
- US rank
- #2724
Category grades
Schools grade is shown separately in the Schools card above.
Census & demographics
- Census place
- Miami, FL
- County
- Miami-Dade County · 2,697,751 people
- City population
- 827,308
- Metro
- Miami-Fort Lauderdale-Pompano Beach, FL
- Population (ZIP)
- 29,761
- Household income
- $73,995
- Rent vs Own
- Severe rent burden
- 1517.0
Population outlook (Miami-Dade County) Hauer SSP2
- Today (2025)
- 3,126,439 people
- By 2030
- 3,325,765 · +6.4%
- By 2040
- 3,697,561 · +18.3%
- By 2050
- 4,012,134 · +28.3%
- By 2075
- 4,605,612 · +47.3%
- By 2100
- 4,866,598 · +55.7%
Race, ethnicity, and origin ACS 2023
- Neighborhood character
- Predominantly Hispanic (79%)
- Race & ethnicity
- Hispanic / Latino 79% Two or more races 51% White 16% Asian 1% Black 1%
- Hispanic origin (detail)
- Mexican 1% Puerto Rican 2% Cuban 41% Dominican 2% Salvadoran 2%
- Common ancestry
- Estonian 2% Scotch-Irish 1% Italian 1%
- Foreign-born
- 59% · Canada, Jamaica, Dominican Republic
- Languages at home
- 13% English-only · Spanish 83% Other Indo-European 2% Russian/Polish/Slavic 1%
Political lean MEDSL · Miami-Dade
- 2024 margin
- R (+11.4) · D 43.9% · R 55.4%
- 2008→2024 swing
- -27.6pp toward R · 2008: 16.1pp · 2024: -11.4pp
- All cycles
- 2024: R+11.4 2020: D+7.3 2016: D+29.6 2012: D+23.7 2008: D+16.1
Not yet ingested
- Civics
- —
Market trends
- HPI YoY
- ▼ -657.80%
- Current HPI
- 485.4573
- Rent YoY
- ▲ 2.73%
- Metro
- Miami-Fort Lauderdale-Pompano Beach, FL
- State GDP YoY
- ▲ 3.28%
- F500 in state
- 36
Industry mix (Fortune 500 HQ in FL)
| Industry | F500 HQs | Revenue |
|---|---|---|
| Industrial Technology | 2 | $29B |
|
||
| Insurance | 2 | $17B |
|
||
| Retail | 1 | $60B |
|
||
| Technology Distribution | 1 | $58B |
|
||
| Homebuilding | 1 | $35B |
|
||
| Technology Manufacturing | 1 | $35B |
|
||
Price history
-98.7% since first listed17 events — show timeline
- 2026-05-25 Rental Removed $2,800 SHOWMOJO
- 2026-04-22 Listed $335,000 FSBO.com
- 2026-04-16 Listed for Rent $2,800 SHOWMOJO
- 2026-04-12 Rental Removed $2,500 REALLYO
- 2026-04-02 Listed for Rent $2,500 REALLYO
- 2026-04-01 Rental Removed $2,500 REALLYO
- 2026-04-01 Price Changed $2,500 REALLYO
- 2026-03-03 Listed for Rent $2,650 REALLYO
- 2025-02-24 Rental Removed $4,500 RENTALBEAST
- 2025-01-29 Listed for Rent $4,500 RENTALBEAST
- 2024-06-21 Relisted — MARMLS
- 2024-06-20 Price Changed $519,000 MARMLS
- 2024-06-20 Listed $519,000 MARMLS
- 2024-04-10 Rental Removed $2,600 APPFOLIO
- 2023-10-28 Listed for Rent $2,600 APPFOLIO
- 2003-12-22 Sold (Public Records) $217,000 Public Records
- 2003-08-27 Sold (Public Records) $218,000 Public Records
Cash-flow waterfall
monthlySold comps — $/sqft
last 12 mo · ≤1 miLoading sold comps…