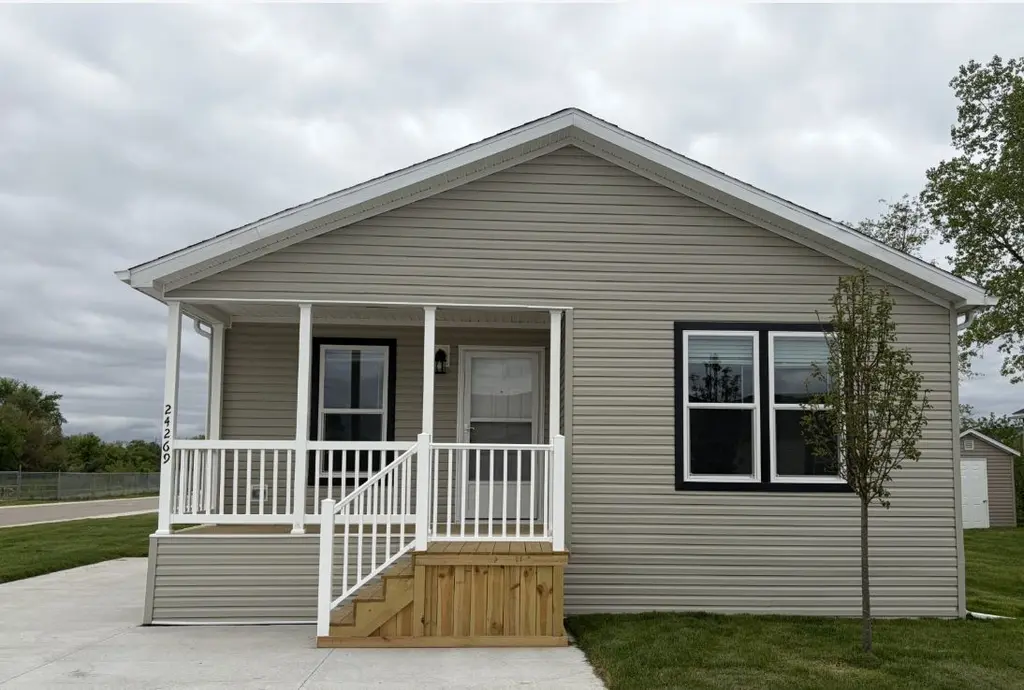
24269 Arrowhead Rd #269 · Sylvan, MI
Flood risk No data
- FEMA flood zone
- —
- Chance of flooding over 30 yrs
- —
- Est. flood insurance / yr
- —
Fire risk No data
- Est. fire insurance / yr
- —
Heat risk No data
- Hot days now (above threshold)
- —
- Hot days in 30 yrs
- —
Wind risk No data
- Chance of severe wind over 30 yrs
- —
Air-quality risk No data
- Unhealthy air days now
- —
- Unhealthy air days in 30 yrs
- —
Risk factors via First Street. Map © Google.
Why this score? — see what drove the B grade
The composite is a weighted blend of 9 inputs, each scored 0–100. Each bar is that input's sub-score; the figure is the points it added to the 100-point composite (weight × sub-score).
- Cash flow +30.0/30.0
- 1% rule +10.0/10.0
- DSCR +10.0/10.0
- ARV discount +7.5/15.0
- Condition / age +5.0/5.0
- Schools +4.9/10.0
- Rent growth +2.5/5.0
- Livability +2.5/5.0
- Appreciation +0.0/10.0
$143,995
🖨 Deal sheet (PDF) 📄 Offer letter ✓ Due diligence
Listing remarks
Beautiful 3 bedroom, 2 full bath home situated on a quiet corner site, with a beautiful newly sodded lawn. This home has an inviting covered front porch perfect for relaxing and enjoying the surroundings. Inside you will find an open concept home with an amazing kitchen that gives a contemporary feel with white upper 42" cabinets and a daker tone lower cabinets and a very large kitchen island with sink and dishwasher for easy loading and unloading. The kitchen is accented with a ceramic tile backsplash that blends perfectly with the counter tops. This home also has all black fixtures including door handles and hinges giving is a modern feel. The primary bedroom has a cordless ceiling f
Key facts
- Covered front porch
- Large kitchen island
- Black fixtures
Tags
Property features AI
Finance
- Other: Status: Active
- Financial info: List price $143,995
Exterior
- Home design: Spec new construction
- Construction: Address: 24269 Arrowhead Rd #269, Chelsea, MI 48118
- Exterior features: Living area approximately 1500
Interior
- Bedrooms: 3 bedrooms
- Bathrooms: 2 bathrooms (full)
- Interior features: Open living area
Neighborhood map
What this means for you Summary
Snapshot
- This is a 3-bed/2.0-bath manufactured listed at $144k. Condition is rated excellent.
Deal economics
- At list price, monthly cash flow is $725 ($9k/yr) — positive.
- The deal already cash-flows at list — no discount required.
- Meets the 1% rule at list price ($2k rent vs $144k).
- Recommended offer: $142k (1.5% below list) — sets the bar for market timing.
Location & tenants
- Location reads: area grade B — affects rentability + tenant quality, not the cash-flow math above.
- Chelsea School District (town): math 53% / reading 57% proficiency, ranked #59 of 540 in MI (top 11%) — acceptable for families but not a draw, mixed tenant base, ~2y average lease; only 10% free/reduced lunch — higher-income household profile.
- Zoned schools: North Creek Elementary School (477 students, 15% FRL); Beach Middle School (math 54% / reading 59%, grade B, #70 of 493 statewide, top 14%, 542 students, 10% FRL); Chelsea High School (math 56% / reading 70%, grade B-, #57 of 713 statewide, top 8%, 783 students, 15% FRL) — zoned schools at 13% FRL track the district average.
- Market conditions: 77 active listings in the ZIP; 996 units permitted in Washtenaw County in 2024 (492 in 5+ unit buildings).
Forward outlook
- Local home prices are declining (-3.0%/yr); year-one equity from $995 of loan paydown is wiped out by about $4k of value loss. Plan a longer hold.
- Washtenaw County population projected at +25% by 2050 — long-run rental-demand tailwind backs the buy-and-hold thesis.
- At projected returns (-3.0% appreciation + 3.0% rent growth), your $40k cash investment doubles in ~6 years — after that, you're playing with house money.
Negotiation context
- It's been on market 19 days — a 2% lower offer ($142k) is reasonable based on typical stale-listing flexibility.
Questions for the listing agent
- Is there a deadline driving the sale (1031 exchange, divorce, estate, relocation)? That informs how much negotiation room exists.
- What's the average days-on-market for RENTAL listings here right now (not sales)? A rising rental-DOM trend means longer vacancies and softer asking-rent achievability than the comps imply.
- What's the recent tenant-quality profile in this submarket — average credit score on applications, eviction rate, late-payment / NSF rate, and stable-employment percentage? A property-management company in the area should have these aggregated.
- How much new for-sale + rental construction is in the pipeline within 1–3 miles? Heavy new supply typically softens prices + rents 12–24 months out; constrained supply supports both.
Investment metrics
- 1% rule
- 1.51% ✓
- Cap rate
- 12.33%
- Cash-on-cash
- 21.57%
- DSCR
- 1.96
- GRM
- 5.5
CMA / ARV
No comps found within radius.
Projected returns pro-forma
-3.0% appreciation · 3.0% rent growth · sell at horizon
- IRR
- 14.2%
- Equity multiple
- 1.57×
- Total profit
- $22,858
- Equity at exit
- $21,470
- IRR
- 23.0%
- Equity multiple
- 2.97×
- Total profit
- $79,475
- Equity at exit
- $12,450
Cash invested: $40,319 (down + closing). Projections, not guarantees.
Landlord ↔ Tenant lean methodology
- Overall (STATE)
- 62 Landlord-Friendly
- State Michigan
- 62 Landlord-Friendly · EVEN
- County
- — inherits STATE
- City
- — inherits STATE
ZIP-level market 48118
- Active inventory
- 77
- Price-to-rent
- 5.5×
Monthly cashflow live
- Estimated rent
- $2,177 medium interval (Pro) →
- Mortgage (P&I)
- −$755
- Tax est. 1.5%
- −$180 /mo · $2,160/yr
- Insurance
- −$60
- HOA
- −$0
- Vacancy / Maint / Mgmt
- −$457
- Net cashflow
- $725
Break-even live
Sensitivity live
| Price | -10% $824 | -5% $774 | +0% $725 | +5% $675 | +10% $625 |
|---|---|---|---|---|---|
| Rent | -10% $553 | -5% $639 | +0% $725 | +5% $811 | +10% $897 |
| Rate | -1.0pp $797 | -0.5pp $761 | base $725 | +0.5pp $687 | +1.0pp $649 |
UW: 25.0% down · 7.5% · 30yr · 1.5% tax · 5.0% vac · 8.0% maint · 8.0% mgmt
Financing live
Cash to close
- Down payment
- $35,999
- Closing costs
- $4,320
- Reserves months
- —
- Total cash needed
- —
Loan-product check · same deal, 3 products live
Conventional
25% down · 7.5% · 30yr
- Down + closing
- —
- Monthly P&I
- —
- Monthly cashflow
- —
- DSCR
- —
- Eligible?
- —
Personal DTI + credit; lowest rate.
DSCR
20% down · 8.5% · 30yr
- Down + closing
- —
- Monthly P&I
- —
- Monthly cashflow
- —
- DSCR
- —
- Eligible?
- —
No personal income docs; deal must DSCR.
Hard money
10% down · 12.0% · 12mo
- Down + closing
- —
- Monthly P&I
- —
- Monthly cashflow
- —
- DSCR
- —
- Eligible?
- —
Short-term bridge; refi at stabilization.
Listing history 14 events
-
2026-06-21days on market $143,995 Active 19 DOM
-
2026-06-18days on market $143,995 Active 16 DOM
-
2026-06-17days on market $143,995 Active 15 DOM
-
2026-06-16days on market $143,995 Active 14 DOM
-
2026-06-15days on market $143,995 Active 13 DOM
-
2026-06-14days on market $143,995 Active 11 DOM
-
2026-06-13days on market $143,995 Active 10 DOM
-
2026-06-10days on market $143,995 Active 8 DOM
-
2026-06-09days on market $143,995 Active 7 DOM
-
2026-06-08days on market $143,995 Active 6 DOM
-
2026-06-07days on market $143,995 Active 5 DOM
-
2026-06-05days on market $143,995 Active 2 DOM
-
2026-06-03remarks 694-char remark
-
2026-06-03$143,995 Active 1 DOM
ⓘ Source: listings_history table (triggers on properties + properties_extension) + one-shot
backfill from property_details.listing_events for pre-trigger history.
Nearby sold comps map
Loading sold comps map…
Walkable amenities ~0.75 mi
Loading nearby amenities…
Taxation est. · year 1
- Rental income
- $26,124
- − Mortgage interest
- −$8,066
- − Property taxes
- −$2,160
- − Insurance
- −$720
- − Repairs & maintenance
- −$2,090
- − Management
- −$2,090
- − Depreciation
- −$4,189
- Taxable income
- $6,810
- Est. tax owed @ 24.0%
- −$1,634
- After-tax cash flow
- $7,063/yr
For passive investors: Depreciation is non-cash, so a rental often shows a tax loss while cash-flowing — sheltering income. Rental losses are passive: they offset passive income freely, and up to $25,000/yr can offset ordinary (W-2) income if you actively participate and your MAGI is under $100k (phasing out to $0 by $150k); unused losses carry forward. On sale, claimed depreciation is recaptured at up to 25%, and gains may owe capital-gains tax (a 1031 exchange can defer both). Figures are a year-1 estimate at your 24.0% rate — not tax advice; consult a CPA.
Condition & rehab AI · 13 photos
This home is in excellent condition with a freshly painted exterior, new siding, and a well-maintained lawn. It is move-in ready and would be an attractive option for both resale and rental.
Value-add opportunities
- Resale Painting the exterior — A fresh coat of paint can enhance the curb appeal and make the home more attractive to potential buyers.
- Resale Landscaping improvements — Enhancing the landscaping can make the home more appealing and increase its resale value.
Renovation cost estimate screening
Value-add ROI direction
- Resale Painting the exterior — A fresh coat of paint can enhance the curb appeal and make the home more attractive to potential buyers. ↑
- Resale Landscaping improvements — Enhancing the landscaping can make the home more appealing and increase its resale value. ↑
ⓘ Cost ranges are severity-bucket heuristics (US national rule-of-thumb). Get contractor quotes + a written scope before underwriting a rehab budget.
Schools (NCES district)
- District
- Chelsea School District
- NCES district ID
- 2608940
- Math proficiency
- 53% ▼ -13.00%
- Reading proficiency
- 57% ▼ -6.00%
- Median HH income
- $75,362
- Composite
- 49.34/100
- National rank
- #2018
- State rank
- #59 of 540 in MI
Livability — Sylvan
No livability data for this city. (Only ~50 U.S. cities are tracked.)
Census & demographics
- Population (ZIP)
- 13,088
Population outlook (Washtenaw County) Hauer SSP2
- Today (2025)
- 402,878 people
- By 2030
- 424,104 · +5.3%
- By 2040
- 464,633 · +15.3%
- By 2050
- 504,728 · +25.3%
- By 2075
- 614,463 · +52.5%
- By 2100
- 676,181 · +67.8%
Race, ethnicity, and origin ACS 2023
- Neighborhood character
- Predominantly White (93%)
- Race & ethnicity
- White 93% Two or more races 4% Hispanic / Latino 2% Black 1%
- Common ancestry
- Romanian 8% Slovak 4% Lithuanian 3%
- Foreign-born
- 2% · Canada
- Languages at home
- 97% English-only · Spanish 1% French/Haitian/Cajun 1%
Political lean MEDSL · Washtenaw
- 2024 margin
- Solid D (+44.4) · D 71.0% · R 26.6% · Other 2.4%
- 2008→2024 swing
- +3.5pp toward D · 2008: 41.0pp · 2024: 44.4pp
- All cycles
- 2024: D+44.4 2020: D+46.6 2016: D+41.5 2012: D+36.0 2008: D+41.0
Not yet ingested
- Civics
- —
Market trends
- HPI YoY
- ▼ -204.35%
- Current HPI
- 174.8761
- Rent YoY
- —
- Metro
- —
- State GDP YoY
- ▲ 1.37%
- F500 in state
- 28
Industry mix (Fortune 500 HQ in MI)
| Industry | F500 HQs | Revenue |
|---|---|---|
| Automotive Parts | 3 | $48B |
|
||
| Automotive | 2 | $372B |
|
||
| Chemicals | 1 | $45B |
|
||
| Automotive Retail | 1 | $29B |
|
||
| Healthcare / Medical Devices | 1 | $23B |
|
||
| Automotive Technology | 1 | $20B |
|
||
Cash-flow waterfall
monthlySold comps — $/sqft
last 12 mo · ≤1 miLoading sold comps…