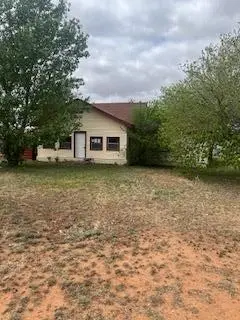
601 Edwards St · Merkel, TX
Flood risk 1/10 · Minimal
- FEMA flood zone
- X (unshaded)
- Chance of flooding over 30 yrs
- 0.0%
- Est. flood insurance / yr
- $507 – $1,088
Fire risk 6/10 · Moderate
- Est. fire insurance / yr
- $1,222 – $2,270
Heat risk 6/10 · Moderate
- Hot days now (above 105°F)
- 4 days/yr
- Hot days in 30 yrs
- 14 days/yr
Wind risk 4/10 · Minor
- Chance of severe wind over 30 yrs
- 12.0%
Air-quality risk 1/10 · Minimal
- Unhealthy air days now
- 0 days/yr
- Unhealthy air days in 30 yrs
- 0 days/yr
Risk factors via First Street. Map © Google.
Why this score? — see what drove the B- grade
The composite is a weighted blend of 9 inputs, each scored 0–100. Each bar is that input's sub-score; the figure is the points it added to the 100-point composite (weight × sub-score).
- Cash flow +30.0/30.0
- 1% rule +10.0/10.0
- DSCR +10.0/10.0
- ARV discount +7.5/15.0
- Livability +3.4/5.0
- Schools +3.2/10.0
- Rent growth +2.5/5.0
- Condition / age +2.5/5.0
- Appreciation +0.0/10.0
$63,479
🖨 Deal sheet 📄 Offer letter ✓ Due diligence
Listing remarks MLS
RECENTLY REDUCED! Older home has two bedrooms, dining area, bonus area open to living room could be a third bedroom or bonus area for extra living room space. Kitchen, one bath, pantry, mostly wood floors, enclosed porch patio. Corner treed lot, storage unit, carport included as value. Property will be sold "as is". This property is a USDA REO PROPERTY and is subject to be assigned to "My Next Bid". Call your local Realtors or listing Broker to view.
Key facts
- Wood floors
- Dining area
- Corner treed lot
Tags
Neighborhood map
What this means for you Summary
Snapshot
- This is a 3-bed/2.0-bath single-family listed at $63k.
Deal economics
- At list price, monthly cash flow is $246 ($3k/yr) — positive.
- The deal already cash-flows at list — no discount required.
- Meets the 1% rule at list price ($1k rent vs $63k).
- Recommended offer: $60k (6.0% below list) — sets the bar for market timing.
- Cap rate 10.9% vs local median 3.3% in Merkel — top-decile yield for the area; either an underpriced asset or a hidden risk that comps aren't pricing in. Stress-test before assuming the spread holds.
Location & tenants
- Location reads 67/100 on livability (#517 in TX) — a middle-class / working-renter tenant base. Strengths: crime A+, cost of living A+, housing A+; Watch: health & safety D+, schools D-, amenities F.
- Merkel ISD (rural): math 37% / reading 39% proficiency, ranked #460 of 826 in TX (top 56%) — families likely to look elsewhere, expect single-tenant / working-renter base with shorter leases.
- Market conditions: 70 active listings in the ZIP; 1 comparable units currently listed for rent nearby; 508 units permitted in Taylor County in 2024 (0 in 5+ unit buildings).
Forward outlook
- Local home prices are declining (-3.0%/yr); year-one equity from $439 of loan paydown is wiped out by about $2k of value loss. Plan a longer hold.
- Taylor County population projected at +16% by 2050 — long-run rental-demand tailwind backs the buy-and-hold thesis.
- At projected returns (-3.0% appreciation + 3.0% rent growth), your $18k cash investment doubles in ~8 years — after that, you're playing with house money.
Negotiation context
- It's been on market 67 days — a 6% lower offer ($60k) is reasonable based on typical stale-listing flexibility.
- 3 sale attempts since 15y ago; this cycle's ask has dropped $3k (5%) from the opening price — seller is motivated, your offer sets the floor, not the list.
Risks & watch-outs
- Watch-outs: property tax is 4.9% of price; built in 1934 — expect roof / HVAC / electrical / plumbing capex.
- Climate carrying-cost: major wildfire risk; extreme-heat days projected 4→14/yr by 2055 (HVAC capex compounding) — expect insurance premiums to compound above CPI over the hold.
Questions for the listing agent
- It's been on market 67 days. Have you received any prior offers? Is the seller open to a 6% concession, seller financing, or rate buy-down credit?
- Built in 1934 — when were the roof, HVAC, electrical panel, plumbing, and water heater last replaced?
- Property tax is high relative to price — has the assessment been appealed recently, and will the sale trigger a re-assessment?
- Why hasn't it sold? Are there any deal-killer items the seller is aware of (foundation, flood, title, zoning, code violations)?
- Is there a deadline driving the sale (1031 exchange, divorce, estate, relocation)? That informs how much negotiation room exists.
- Schools are D-rated, which usually means shorter tenancies and higher turnover. Who's the typical renter profile here, and what's been the actual vacancy rate?
- What's the average days-on-market for RENTAL listings here right now (not sales)? A rising rental-DOM trend means longer vacancies and softer asking-rent achievability than the comps imply.
- What's the recent tenant-quality profile in this submarket — average credit score on applications, eviction rate, late-payment / NSF rate, and stable-employment percentage? A property-management company in the area should have these aggregated.
- How much new for-sale + rental construction is in the pipeline within 1–3 miles? Heavy new supply typically softens prices + rents 12–24 months out; constrained supply supports both.
Investment metrics
- 1% rule
- 1.72% ✓
- Cap rate
- 10.94%
- Cash-on-cash
- 16.60%
- DSCR
- 1.74
- GRM
- 4.8
CMA / ARV
- ARV (median comp)
- $181,778
- List price
- $63,479
- Delta
- -65.08%
- Verdict
- UNDERPRICED
- Comps
- 20 within 1.0 mi
Show comp detail 3 sales within ~0.75 mi
| Address | Dist | Beds/Ba | Sqft | Sold | Price | $/sf | Match |
|---|---|---|---|---|---|---|---|
| 512 Taylor | 0.18mi | 3/1.0 | 1,510 (-4%) | 14mo | $210,000 | $139 | 69 |
| 205 Cherry | 0.53mi | 3/2.0 | 1,497 (-5%) | 10mo | $215,000 | $144 | 59 |
| 404 Cherry | 0.66mi | 3/2.0 | 1,405 (-11%) | 2mo | $189,900 | $135 | 50 |
Match score weights: distance 35% · size 25% · config 20% · recency 20%. Top-matched comps best support the ARV.
Projected returns pro-forma
-3.0% appreciation · 3.0% rent growth · sell at horizon
- IRR
- 7.9%
- Equity multiple
- 1.31×
- Total profit
- $5,503
- Equity at exit
- $9,465
- IRR
- 17.3%
- Equity multiple
- 2.43×
- Total profit
- $25,477
- Equity at exit
- $5,489
Cash invested: $17,774 (down + closing). Projections, not guarantees.
Landlord ↔ Tenant lean methodology
- Overall (STATE)
- 87 Strongly Landlord-Friendly
- State Texas
- 87 Strongly Landlord-Friendly · R+5
- County
- — inherits STATE
- City
- — inherits STATE
ZIP-level market 79536
- Home prices YoY
- -7.9%
- Active inventory
- 70
- Price-to-rent
- 4.8×
Monthly cashflow live
- Estimated rent
- $1,095 medium interval (Pro) →
- Mortgage (P&I)
- −$333
- Tax from tax record
- −$260 /mo · $3,118/yr
- Insurance
- −$26
- HOA
- −$0
- Vacancy / Maint / Mgmt
- −$230
- Net cashflow
- $246
Break-even live
UW: 25.0% down · 7.5% · 30yr · 1.5% tax · 5.0% vac · 8.0% maint · 8.0% mgmt
Financing live
Cash to close
- Down payment
- $15,870
- Closing costs
- $1,904
- Reserves months
- —
- Total cash needed
- —
Loan-product check · same deal, 3 products live
Conventional
25% down · 7.5% · 30yr
- Down + closing
- —
- Monthly P&I
- —
- Monthly cashflow
- —
- DSCR
- —
- Eligible?
- —
Personal DTI + credit; lowest rate.
DSCR
20% down · 8.5% · 30yr
- Down + closing
- —
- Monthly P&I
- —
- Monthly cashflow
- —
- DSCR
- —
- Eligible?
- —
No personal income docs; deal must DSCR.
Hard money
10% down · 12.0% · 12mo
- Down + closing
- —
- Monthly P&I
- —
- Monthly cashflow
- —
- DSCR
- —
- Eligible?
- —
Short-term bridge; refi at stabilization.
Rent comps 1 comps
| Address | Beds | Baths | Sqft | Rent | $/sqft | DOM | Units | Dist |
|---|---|---|---|---|---|---|---|---|
| 202 Cherry Merkel, TX | 2.0 | 1.0 | 1164 | $1,095 | $0.94 | 20d | 1 | 0.53mi |
Listing history 25 events
-
2026-06-19days on market $63,479 Active 67 DOM
-
2026-06-18days on market $63,479 Active 66 DOM
-
2026-06-17days on market $63,479 Active 65 DOM
-
2026-06-16days on market $63,479 Active 64 DOM
-
2026-06-15days on market $63,479 Active 63 DOM
-
2026-06-14days on market $63,479 Active 61 DOM
-
2026-06-13days on market $63,479 Active 60 DOM
-
2026-06-10days on market $63,479 Active 58 DOM
-
2026-06-09days on market $63,479 Active 57 DOM
-
2026-06-08days on market $63,479 Active 56 DOM
-
2026-06-07days on market $63,479 Active 55 DOM
-
2026-06-02days on market $63,479 Active 50 DOM
-
2026-06-01days on market $63,479 Active 49 DOM
-
2026-05-31days on market $63,479 Active 48 DOM
-
2026-05-30days on market $63,479 Active 47 DOM
-
2026-05-18price $63,479 474-char remark
Show marketing remark (474 chars)
RECENTLY REDUCED! Older home has two bedrooms, dining area, bonus area open to living room could be a third bedroom or bonus area for extra living room space. Kitchen, one bath, pantry, mostly wood floors, enclosed porch patio. Corner treed lot, storage unit, carport included as value. Property will be sold "as is". This property is a USDA REO PROPERTY and is subject to be assigned to "My Next Bid". Call your local Realtors or listing Broker to view.
-
2026-04-13$66,820 Active 474-char remark
Show marketing remark (474 chars)
RECENTLY REDUCED! Older home has two bedrooms, dining area, bonus area open to living room could be a third bedroom or bonus area for extra living room space. Kitchen, one bath, pantry, mostly wood floors, enclosed porch patio. Corner treed lot, storage unit, carport included as value. Property will be sold "as is". This property is a USDA REO PROPERTY and is subject to be assigned to "My Next Bid". Call your local Realtors or listing Broker to view.
-
2024-04-25historical
-
2024-04-18$117,500 Active
-
2011-12-21soldstatus
-
2011-09-02historical
-
2011-05-03$67,500
-
2008-12-18soldstatus
-
2007-08-02soldstatus
-
2006-06-02soldstatus
ⓘ Source: listings_history table (triggers on properties + properties_extension) + one-shot
backfill from property_details.listing_events for pre-trigger history.
Tax reassessment forecast TX · Resets to sale price
- Current annual tax
- $3,118 · $260/mo
- Projected year-2 tax
- $3,118 · $260/mo
- Expected delta
- $0/yr ($0/mo · 0.0%)
ⓘ Screening estimate from a state-policy table — verify with the county assessor before closing.
Climate risk First Street
- Flood 1/10 Low FEMA zone X (unshaded) · 0% chance over 30 yrs
- Wildfire 6/10 Major
- Heat 6/10 Major 4 d/yr ≥105°F today · 14 d/yr by 30 yrs out
- Wind 4/10 Moderate 12% chance of damaging wind over 30 yrs
- Air quality 1/10 Low 0 unhealthy d/yr today · 0 by 30 yrs out
Nearby sold comps map
Loading sold comps map…
Walkable amenities ~0.75 mi
Loading nearby amenities…
Taxation est. · year 1
- Rental income
- $13,140
- − Mortgage interest
- −$3,556
- − Property taxes
- −$3,118
- − Insurance
- −$317
- − Repairs & maintenance
- −$1,051
- − Management
- −$1,051
- − Depreciation
- −$1,847
- Taxable income
- $2,200
- Est. tax owed @ 24.0%
- −$528
- After-tax cash flow
- $2,423/yr
For passive investors: Depreciation is non-cash, so a rental often shows a tax loss while cash-flowing — sheltering income. Rental losses are passive: they offset passive income freely, and up to $25,000/yr can offset ordinary (W-2) income if you actively participate and your MAGI is under $100k (phasing out to $0 by $150k); unused losses carry forward. On sale, claimed depreciation is recaptured at up to 25%, and gains may owe capital-gains tax (a 1031 exchange can defer both). Figures are a year-1 estimate at your 24.0% rate — not tax advice; consult a CPA.
Schools (NCES district)
- District
- Merkel ISD
- NCES district ID
- 4830340
- Math proficiency
- 37% ▼ -7.00%
- Reading proficiency
- 39% ▼ -2.00%
- Median HH income
- $43,594
- Composite
- 32.22/100
- National rank
- #5774
- State rank
- #460 of 826 in TX
Livability — Merkel
- Score
- 67/100
- State rank
- #517
- US rank
- #10181
Category grades
Schools grade is shown separately in the Schools card above.
Census & demographics
- Census place
- Merkel, TX
- City population
- 6,080
- Population (ZIP)
- 6,080
Population outlook (Taylor County) Hauer SSP2
- Today (2025)
- 145,270 people
- By 2030
- 150,050 · +3.3%
- By 2040
- 159,417 · +9.7%
- By 2050
- 168,883 · +16.3%
- By 2075
- 194,436 · +33.8%
- By 2100
- 203,163 · +39.9%
Race, ethnicity, and origin ACS 2023
- Neighborhood character
- Predominantly White (80%)
- Race & ethnicity
- White 80% Hispanic / Latino 14% Two or more races 7% Black 1%
- Hispanic origin (detail)
- Mexican 11%
- Common ancestry
- Italian 3% Slovak 2% Romanian 1%
- Foreign-born
- 2% · Canada
- Languages at home
- 90% English-only · Spanish 8% Other Indo-European 2%
Political lean MEDSL · Taylor
- 2024 margin
- Solid R (+49.8) · D 24.6% · R 74.4% · Other 1.0%
- 2008→2024 swing
- -4.2pp toward R · 2008: -45.6pp · 2024: -49.8pp
- All cycles
- 2024: R+49.8 2020: R+45.3 2016: R+51.1 2012: R+53.6 2008: R+45.6
Not yet ingested
- Civics
- —
Market trends
- HPI YoY
- ▼ -17.40%
- Current HPI
- 203.6833
- Rent YoY
- —
- Metro
- —
- State GDP YoY
- ▲ 3.95%
- F500 in state
- 110
Industry mix (Fortune 500 HQ in TX)
| Industry | F500 HQs | Revenue |
|---|---|---|
| Energy | 16 | $1,198B |
|
||
| Technology | 5 | $198B |
|
||
| Engineering / Construction | 4 | $72B |
|
||
| Energy Services | 3 | $60B |
|
||
| Utilities | 3 | $41B |
|
||
| Healthcare | 2 | $330B |
|
||
Price history
-6.0% since first listed10 events — show timeline
- 2026-05-18 Price Changed $63,479 PBBOR
- 2026-04-13 Listed $66,820 PBBOR
- 2024-04-25 Listing Removed — NTREIS
- 2024-04-18 Listed $117,500 NTREIS
- 2011-12-21 Sold (Public Records) — Public Records
- 2011-09-02 Listing Removed — NTREIS
- 2011-05-03 Listed $67,500 NTREIS
- 2008-12-18 Sold (Public Records) — Public Records
- 2007-08-02 Sold (Public Records) — Public Records
- 2006-06-02 Sold (Public Records) — Public Records
Property tax history
+5.9%/yrLatest (2025): $3,118 · +10.4% YoY. Source: county tax records.
Cash-flow waterfall
monthlySold comps — $/sqft
last 12 mo · ≤1 miLoading sold comps…