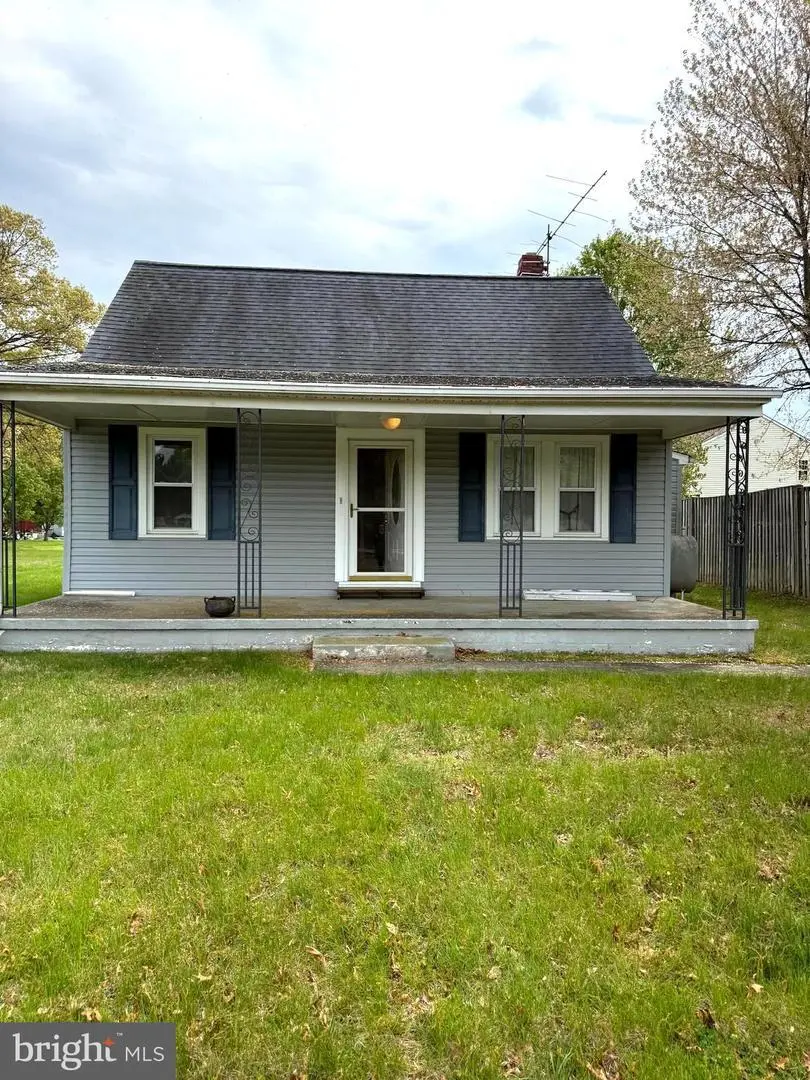
10475 Berry Rd · Waldorf, MD
Flood risk 1/10 · Minimal
- FEMA flood zone
- X (unshaded)
- Chance of flooding over 30 yrs
- 0.0%
- Est. flood insurance / yr
- $507 – $1,088
Fire risk 1/10 · Minimal
- Est. fire insurance / yr
- $755 – $1,403
Heat risk 7/10 · Major
- Hot days now (above 103°F)
- 7 days/yr
- Hot days in 30 yrs
- 16 days/yr
Wind risk 5/10 · Moderate
- Chance of severe wind over 30 yrs
- 25.0%
Air-quality risk 2/10 · Minimal
- Unhealthy air days now
- 1 days/yr
- Unhealthy air days in 30 yrs
- 2 days/yr
Risk factors via First Street. Map © Google.
Why this score? — see what drove the C grade
The composite is a weighted blend of 9 inputs, each scored 0–100. Each bar is that input's sub-score; the figure is the points it added to the 100-point composite (weight × sub-score).
- Cash flow +21.6/30.0
- ARV discount +15.0/15.0
- DSCR +6.9/10.0
- 1% rule +4.4/10.0
- Livability +3.6/5.0
- Rent growth +2.5/5.0
- Condition / age +2.5/5.0
- Schools +2.3/10.0
- Appreciation +0.0/10.0
$269,975
🖨 Deal sheet (PDF) 📄 Offer letter ✓ Due diligence
Listing remarks
Investor Special! Opportunity awaits at 10475 Berry Rd — perfect for investors, flippers, or buyers looking for a renovation project with strong upside potential. Property needs repairs and updates and is being sold as-is. Ideal for cash buyers, conventional rehab loans, or renovation financing. Previously associated with a HUD reverse mortgage. Great potential for fix-and-flip, rental income, or sweat equity. Convenient location with room to add value. Bring your vision and transform this property into something special!
Key facts
- 2 acre lot
- 8 parking spots
- Built 1948
Property features AI
Finance
- Other: Fee simple ownership; Property condition listed as below average to average; Above-grade finished area approximately 1,316 (assessor)
Exterior
- Parking: Paved driveway with 8 parking spaces
- Utilities: Public water; On-site septic system; Electric available; Water available
- Home design: Detached single-family home; Shingle roof; Entry level on main floor
- Construction: Vinyl siding; Block foundation with crawl space; Not winterized
- Exterior features: Porch(es); Shed and shed shop on property; Backs to trees; Cleared yard; Front yard; Level lot; Ramp to main level (accessibility)
Interior
- Kitchen: Refrigerator; Stove; Exhaust fan
- Bedrooms: Two main-level bedrooms; Attic
- Flooring: Wood floors
- Bathrooms: One full bathroom (main level)
- Heating & cooling: 90% forced air heating (oil-fired); Ceiling fans; Window air conditioning units; 100 amp electric service; Electric hot water
- Interior features: Crown molding; Ceiling fan(s); Six-panel doors; Drywall walls and ceilings; Wood flooring
- Laundry & utility: Washer in unit on main floor; Dryer
Neighborhood map
What this means for you Summary
Snapshot
- This is a 2-bed/1.0-bath single-family listed at $270k.
Deal economics
- At list price, monthly cash flow is $409 ($5k/yr) — positive.
- The deal already cash-flows at list — no discount required.
- To meet the 1% rule (rent ≥ 1% of price), the offer needs to be $254k (6.1% below list).
- Recommended offer: $254k (6.1% below list) — sets the bar for 1% rule.
- Cap rate 8.1% vs local median 4.8% in Waldorf — top-decile yield for the area; either an underpriced asset or a hidden risk that comps aren't pricing in. Stress-test before assuming the spread holds.
Location & tenants
- Location reads 72/100 on livability (#141 in MD) — a middle-class / working-renter tenant base. Strengths: commute A+, employment A+, housing A+; Watch: crime D-, amenities F, cost of living F.
- Charles County Public Schools (suburban): math 13% / reading 29% proficiency, ranked #14 of 24 in MD (top 58%) — low school quality limits family demand, transient renter base, plan for 1-2y turnover.
- Zoned schools: Berry Elementary School (math 9% / reading 17%, grade F, #526 of 860 statewide, top 62%, 721 students, 50% FRL); Mattawoman Middle School (math 8% / reading 29%, grade F, #159 of 225 statewide, top 73%, 934 students, 48% FRL); North Point High School (math 45% / reading 67%, grade C, #83 of 222 statewide, top 38%, 1,867 students, 30% FRL) — zoned schools average 43% FRL vs 28% district-wide (16 pts higher); higher-poverty schools than district average — tighter screening recommended.
- Market conditions: 157 active listings in the ZIP; 2 comparable units currently listed for rent nearby; high-income renter base; 1,542 units permitted in Charles County in 2024 (516 in 5+ unit buildings).
Forward outlook
- Local home prices are declining (-3.0%/yr); year-one equity from $2k of loan paydown is wiped out by about $8k of value loss. Plan a longer hold.
- Charles County population projected at +27% by 2050 — long-run rental-demand tailwind backs the buy-and-hold thesis.
Negotiation context
- It's been on market 29 days — a 2% lower offer ($266k) is reasonable based on typical stale-listing flexibility.
Risks & watch-outs
- Watch-outs: built in 1948 — expect roof / HVAC / electrical / plumbing capex.
- Climate carrying-cost: moderate wind risk, 25% chance of damaging wind over 30y; extreme-heat days projected 7→16/yr by 2055 (HVAC capex compounding) — expect insurance premiums to compound above CPI over the hold.
Questions for the listing agent
- Built in 1948 — when were the roof, HVAC, electrical panel, plumbing, and water heater last replaced?
- Is there a deadline driving the sale (1031 exchange, divorce, estate, relocation)? That informs how much negotiation room exists.
- Schools are D-rated, which usually means shorter tenancies and higher turnover. Who's the typical renter profile here, and what's been the actual vacancy rate?
- Crime grade is D in this area — have there been break-ins, vandalism, or insurance claims at this property in the last 3 years? What carrier currently insures it and at what premium?
- What's the average days-on-market for RENTAL listings here right now (not sales)? A rising rental-DOM trend means longer vacancies and softer asking-rent achievability than the comps imply.
- What's the recent tenant-quality profile in this submarket — average credit score on applications, eviction rate, late-payment / NSF rate, and stable-employment percentage? A property-management company in the area should have these aggregated.
- How much new for-sale + rental construction is in the pipeline within 1–3 miles? Heavy new supply typically softens prices + rents 12–24 months out; constrained supply supports both.
Investment metrics
- 1% rule
- 0.94% ✗
- Cap rate
- 8.11%
- Cash-on-cash
- 6.50%
- DSCR
- 1.29
- GRM
- 8.9
CMA / ARV
- ARV (on-the-fly)
- $367,164
- Comps found
- 5
Show comp detail 5 sales within ~0.75 mi
| Address | Dist | Beds/Ba | Sqft | Sold | Price | $/sf | Match |
|---|---|---|---|---|---|---|---|
| 2115 Greenwood Dr | 0.61mi | 3/2.0 (+1) | 1,272 (-3%) | 3mo | $335,000 | $263 | 54 |
| 2254 Sandalwood Dr | 0.47mi | 3/2.0 (+1) | 1,188 (-10%) | 7mo | $384,999 | $324 | 47 |
| 2117 Greenwood Dr | 0.61mi | 3/1.0 (+1) | 1,178 (-10%) | 8mo | $355,000 | $301 | 42 |
| 10654 Water Hickory Ct | 0.65mi | 3/2.0 (+1) | 1,432 (+9%) | 10mo | $365,000 | $255 | 38 |
| 10542 Beechwood Dr | 0.59mi | 3/2.0 (+1) | 1,432 (+9%) | 15mo | $400,000 | $279 | 36 |
Match score weights: distance 35% · size 25% · config 20% · recency 20%. Top-matched comps best support the ARV.
Projected returns pro-forma
-3.0% appreciation · 3.0% rent growth · sell at horizon
- IRR
- -6.4%
- Equity multiple
- 0.76×
- Total profit
- $-17,817
- Equity at exit
- $40,254
- IRR
- 3.2%
- Equity multiple
- 1.23×
- Total profit
- $17,520
- Equity at exit
- $23,343
Cash invested: $75,593 (down + closing). Projections, not guarantees.
Landlord ↔ Tenant lean methodology
- Overall (STATE)
- 27 Tenant-Leaning
- State Maryland
- 27 Tenant-Leaning · D+14
- County
- — inherits STATE
- City
- — inherits STATE
ZIP-level market 20603
- Home prices YoY
- -16.4%
- Active inventory
- 157
- Price-to-rent
- 8.9×
Monthly cashflow live
- Estimated rent
- $2,536 medium interval (Pro) →
- Mortgage (P&I)
- −$1,416
- Tax from tax record
- −$66 /mo · $796/yr
- Insurance
- −$112
- HOA
- −$0
- Vacancy / Maint / Mgmt
- −$533
- Net cashflow
- $409
Break-even live
Sensitivity live
| Price | -10% $562 | -5% $486 | +0% $409 | +5% $333 | +10% $256 |
|---|---|---|---|---|---|
| Rent | -10% $209 | -5% $309 | +0% $409 | +5% $509 | +10% $610 |
| Rate | -1.0pp $545 | -0.5pp $478 | base $409 | +0.5pp $339 | +1.0pp $268 |
UW: 25.0% down · 7.5% · 30yr · 1.5% tax · 5.0% vac · 8.0% maint · 8.0% mgmt
Financing live
Cash to close
- Down payment
- $67,494
- Closing costs
- $8,099
- Reserves months
- —
- Total cash needed
- —
Loan-product check · same deal, 3 products live
Conventional
25% down · 7.5% · 30yr
- Down + closing
- —
- Monthly P&I
- —
- Monthly cashflow
- —
- DSCR
- —
- Eligible?
- —
Personal DTI + credit; lowest rate.
DSCR
20% down · 8.5% · 30yr
- Down + closing
- —
- Monthly P&I
- —
- Monthly cashflow
- —
- DSCR
- —
- Eligible?
- —
No personal income docs; deal must DSCR.
Hard money
10% down · 12.0% · 12mo
- Down + closing
- —
- Monthly P&I
- —
- Monthly cashflow
- —
- DSCR
- —
- Eligible?
- —
Short-term bridge; refi at stabilization.
Rent comps 2 comps
| Address | Beds | Baths | Sqft | Rent | $/sqft | DOM | Units | Dist |
|---|---|---|---|---|---|---|---|---|
| 10542 Black Pine Ln Waldorf, MD | 1.0 | 1.0 | 923 | $1,750 | $1.90 | 25d | 1 | 1.45mi |
| 9445 Kilwinning Pl Waldorf, MD | 3.0 | 2.5 | 1800 | $3,245 | $1.80 | 4d | 4 | 1.45mi |
Listing history 15 events
-
2026-06-21days on market $269,975 Active 29 DOM
-
2026-06-18days on market $269,975 Active 26 DOM
-
2026-06-17days on market $269,975 Active 25 DOM
-
2026-06-16days on market $269,975 Active 24 DOM
-
2026-06-15days on market $269,975 Active 23 DOM
-
2026-06-13pricedays on market $269,975 Active 21 DOM
-
2026-06-09days on market $299,975 Active 17 DOM
-
2026-06-08days on market $299,975 Active 16 DOM
-
2026-06-07days on market $299,975 Active 15 DOM
-
2026-06-04days on market $299,975 Active 12 DOM
-
2026-06-03days on market $299,975 Active 11 DOM
-
2026-06-02days on market $299,975 Active 10 DOM
-
2026-06-01days on market $299,975 Active 9 DOM
-
2026-05-31days on market $299,975 Active 8 DOM
-
2026-05-23$299,975 Active
ⓘ Source: listings_history table (triggers on properties + properties_extension) + one-shot
backfill from property_details.listing_events for pre-trigger history.
Tax reassessment forecast MD · Partial reset (capped growth)
- Current annual tax
- $796 · $66/mo
- Projected year-2 tax
- $1,869 · $156/mo
- Expected delta
- +$1,074/yr (+$89/mo · 135.0%)
ⓘ Screening estimate from a state-policy table — verify with the county assessor before closing.
Climate risk First Street
- Flood 1/10 Low FEMA zone X (unshaded) · 0% chance over 30 yrs
- Wildfire 1/10 Low
- Heat 7/10 Severe 7 d/yr ≥103°F today · 16 d/yr by 30 yrs out
- Wind 5/10 Major 25% chance of damaging wind over 30 yrs
- Air quality 2/10 Low 1 unhealthy d/yr today · 2 by 30 yrs out
Nearby sold comps map
Loading sold comps map…
Walkable amenities ~0.75 mi
Loading nearby amenities…
Taxation est. · year 1
- Rental income
- $30,436
- − Mortgage interest
- −$15,123
- − Property taxes
- −$796
- − Insurance
- −$1,350
- − Repairs & maintenance
- −$2,435
- − Management
- −$2,435
- − Depreciation
- −$7,854
- Taxable income
- $444
- Est. tax owed @ 24.0%
- −$107
- After-tax cash flow
- $4,803/yr
For passive investors: Depreciation is non-cash, so a rental often shows a tax loss while cash-flowing — sheltering income. Rental losses are passive: they offset passive income freely, and up to $25,000/yr can offset ordinary (W-2) income if you actively participate and your MAGI is under $100k (phasing out to $0 by $150k); unused losses carry forward. On sale, claimed depreciation is recaptured at up to 25%, and gains may owe capital-gains tax (a 1031 exchange can defer both). Figures are a year-1 estimate at your 24.0% rate — not tax advice; consult a CPA.
Schools (NCES district)
- District
- Charles County Public Schools
- NCES district ID
- 2400270
- Math proficiency
- 13% ▼ -19.00%
- Reading proficiency
- 29% ▼ -13.00%
- Median HH income
- $90,389
- Composite
- 22.54/100
- National rank
- #8087
- State rank
- #14 of 24 in MD
Livability — Waldorf
- Score
- 72/100
- State rank
- #141
- US rank
- #6083
Category grades
Schools grade is shown separately in the Schools card above.
Census & demographics
- Census place
- Waldorf, MD
- County
- Charles County · 103,527 people
- City population
- 103,527
- Metro
- Washington-Arlington-Alexandria, DC-VA-MD-WV
- Population (ZIP)
- 31,844
- Household income
- $137,946
- Rent vs Own
- Severe rent burden
- 505.0
Population outlook (Charles County) Hauer SSP2
- Today (2025)
- 176,616 people
- By 2030
- 186,471 · +5.6%
- By 2040
- 206,472 · +16.9%
- By 2050
- 224,883 · +27.3%
- By 2075
- 272,101 · +54.1%
- By 2100
- 303,564 · +71.9%
Race, ethnicity, and origin ACS 2023
- Neighborhood character
- Diverse neighborhood (Simpson 0.59)
- Race & ethnicity
- Black 60% White 18% Hispanic / Latino 9% Two or more races 9% Asian 6%
- Hispanic origin (detail)
- Mexican 2% Puerto Rican 2%
- Common ancestry
- Romanian 1% Iranian 1% Slovak 0%
- Foreign-born
- 10% · Canada, China
- Languages at home
- 86% English-only · Spanish 6% Tagalog/Filipino 2% Other Indo-European 2%
Political lean MEDSL · Charles
- 2024 margin
- Solid D (+40.7) · D 69.2% · R 28.5% · Other 2.2%
- 2008→2024 swing
- +15.2pp toward D · 2008: 25.5pp · 2024: 40.7pp
- All cycles
- 2024: D+40.7 2020: D+40.9 2016: D+30.2 2012: D+31.3 2008: D+25.5
Not yet ingested
- Civics
- —
Market trends
- HPI YoY
- ▼ -48.22%
- Current HPI
- 245.9911
- Rent YoY
- —
- Metro
- Washington-Arlington-Alexandria, DC-VA-MD-WV
- State GDP YoY
- ▲ 2.97%
- F500 in state
- 12
Industry mix (Fortune 500 HQ in MD)
| Industry | F500 HQs | Revenue |
|---|---|---|
| Aerospace / Defense | 1 | $71B |
|
||
| Utilities | 1 | $25B |
|
||
| Hotels | 1 | $24B |
|
||
| Consumer Goods | 1 | $7B |
|
||
| Real Estate | 1 | $6B |
|
||
| Chemicals | 1 | $2B |
|
||
Price history
1 event — show timeline
- 2026-05-23 Listed $299,975 BRIGHT MLS
Property tax history
-5.3%/yrLatest (2025): $796 · +7.2% YoY. Source: county tax records.
Cash-flow waterfall
monthlySold comps — $/sqft
last 12 mo · ≤1 miLoading sold comps…