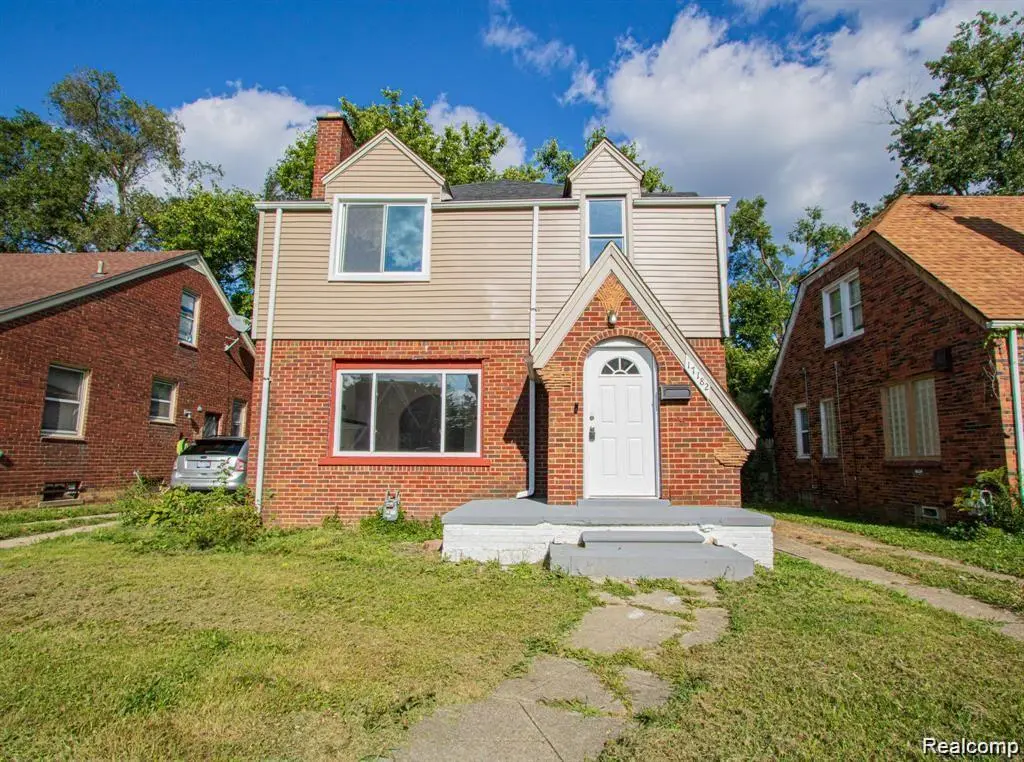
17182 Murray Hill St · Detroit, MI
Flood risk 1/10 · Minimal
- FEMA flood zone
- X (unshaded)
- Chance of flooding over 30 yrs
- 0.0%
- Est. flood insurance / yr
- $507 – $1,088
Fire risk 1/10 · Minimal
- Est. fire insurance / yr
- $784 – $1,456
Heat risk 3/10 · Minor
- Hot days now (above 98°F)
- 7 days/yr
- Hot days in 30 yrs
- 15 days/yr
Wind risk 2/10 · Minimal
- Chance of severe wind over 30 yrs
- —
Air-quality risk 3/10 · Minor
- Unhealthy air days now
- 2 days/yr
- Unhealthy air days in 30 yrs
- 5 days/yr
Risk factors via First Street. Map © Google.
Why this score? — see what drove the D grade
The composite is a weighted blend of 9 inputs, each scored 0–100. Each bar is that input's sub-score; the figure is the points it added to the 100-point composite (weight × sub-score).
- Cash flow +12.8/30.0
- ARV discount +10.8/15.0
- 1% rule +4.3/10.0
- DSCR +3.8/10.0
- Livability +3.7/5.0
- Rent growth +3.3/5.0
- Condition / age +2.5/5.0
- Schools +1.3/10.0
- Appreciation +0.0/10.0
$157,900
🖨 Deal sheet (PDF) 📄 Offer letter ✓ Due diligence
Listing remarks MLS
Well-maintained 3-bedroom, 1.5-bath home offers over 1,400 sq ft of comfortable living space. Recently updated with modern finishes, the property features a functional layout and an inviting living area. Currently tenant-occupied and generating steady rental income at $1,600/month, this is an ideal turnkey investment. Located in a growing neighborhood with convenient access to schools, shopping, and major highways. A solid addition to any rental portfolio!
Key facts
- 4,356 sq ft lot
- Built 1929
- Listed 291 days
Neighborhood map
What this means for you Summary
Snapshot
- This is a 3-bed/1.0-bath single-family listed at $158k.
Deal economics
- At list price, monthly cash flow is $-15 ($-183/yr) — negative.
- To cash-flow at today's rent, offer at most $155k (1.7% below list).
- To meet the 1% rule (rent ≥ 1% of price), the offer needs to be $146k (7.3% below list).
- Recommended offer: $139k (12.0% below list) — sets the bar for market timing.
- Cap rate 6.2% vs local median 10.0% in Detroit — below-typical yield; the buyer is paying a premium for something (appreciation thesis, condition, location) that the cap rate doesn't capture.
Location & tenants
- Location reads 73/100 on livability (#218 in MI) — a middle-class / working-renter tenant base. Strengths: amenities A+, commute A+, cost of living A+; Watch: crime F, employment F.
- Detroit Public Schools Community District (urban): math 10% / reading 24% proficiency, ranked #499 of 540 in MI (top 92%) — low school quality limits family demand, transient renter base, plan for 1-2y turnover; 90% free/reduced lunch — lower-income household profile, screen leases tightly.
- Zoned schools: John R King Academic And Performing Arts Academy (math 2% / reading 8%, grade F, #1,325 of 1,397 statewide, top 99%, 814 students, 92% FRL); Henry Ford High School (math 24% / reading 24%, grade F, #481 of 713 statewide, top 81%, 712 students, 86% FRL) — zoned schools at 89% FRL track the district average.
- Market conditions: Rents rising (+3.2%/yr); 291 active listings in the ZIP; 40 comparable units currently listed for rent nearby; rentals at typical pace (median 19d on market — plan ~3-4 weeks tenant-placement turnaround); lower-income renter base — watch delinquency; 2,639 units permitted in Wayne County in 2024 (1,216 in 5+ unit buildings).
- This rent runs 45% of the median local income ($39k/yr) — at the standard rent-burdened threshold; future hikes will face affordability resistance.
Forward outlook
- Local home prices are declining (-3.0%/yr); year-one equity from $1k of loan paydown is wiped out by about $5k of value loss. Plan a longer hold.
- Wayne County population projected at -17% by 2050 — secular population decline; favor cash flow + early exit over multi-decade hold.
Negotiation context
- It's been on market 291 days — a 12% lower offer ($139k) is reasonable based on typical stale-listing flexibility.
- 21 sale attempts since 28y ago; this cycle's ask has dropped $12k (7%) from the opening price — seller is motivated, your offer sets the floor, not the list.
- Current owner paid $70k; list at $158k implies a 126% gain — meaningful room to come down on a strong offer.
Risks & watch-outs
- Watch-outs: built in 1929 — expect roof / HVAC / electrical / plumbing capex.
Questions for the listing agent
- What do current leases actually rent for vs. the listed asking? Can we see a recent rent roll and the last 12 months of T-12 income?
- It's been on market 291 days. Have you received any prior offers? Is the seller open to a 12% concession, seller financing, or rate buy-down credit?
- Built in 1929 — when were the roof, HVAC, electrical panel, plumbing, and water heater last replaced?
- Why hasn't it sold? Are there any deal-killer items the seller is aware of (foundation, flood, title, zoning, code violations)?
- Is there a deadline driving the sale (1031 exchange, divorce, estate, relocation)? That informs how much negotiation room exists.
- Schools are F-rated, which usually means shorter tenancies and higher turnover. Who's the typical renter profile here, and what's been the actual vacancy rate?
- Crime grade is F in this area — have there been break-ins, vandalism, or insurance claims at this property in the last 3 years? What carrier currently insures it and at what premium?
- The area grade is low — what's the realistic commute time and amenity access for the typical tenant pool here? Any planned neighborhood developments (good or bad) we should know about?
- What's the average days-on-market for RENTAL listings here right now (not sales)? A rising rental-DOM trend means longer vacancies and softer asking-rent achievability than the comps imply.
- What's the recent tenant-quality profile in this submarket — average credit score on applications, eviction rate, late-payment / NSF rate, and stable-employment percentage? A property-management company in the area should have these aggregated.
- How much new for-sale + rental construction is in the pipeline within 1–3 miles? Heavy new supply typically softens prices + rents 12–24 months out; constrained supply supports both.
Investment metrics
- 1% rule
- 0.93% ✗
- Cap rate
- 6.18%
- Cash-on-cash
- -0.41%
- DSCR
- 0.98
- GRM
- 9.0
CMA / ARV
- ARV (median comp)
- $170,391
- List price
- $157,900
- Delta
- -7.33%
- Verdict
- FAIR
- Comps
- 20 within 1.0 mi
Show comp detail 12 sales within ~0.75 mi
| Address | Dist | Beds/Ba | Sqft | Sold | Price | $/sf | Match |
|---|---|---|---|---|---|---|---|
| 17130 Mansfield St | 0.12mi | 3/2.0 | 1,559 (+11%) | 0mo | $185,000 | $119 | 71 |
| 16839 Prevost St | 0.26mi | 3/1.0 | 1,272 (-9%) | 6mo | $135,000 | $106 | 68 |
| 16533 Harlow St | 0.60mi | 3/1.5 | 1,385 (-1%) | 2mo | $83,989 | $61 | 67 |
| 16837 Winthrop St | 0.38mi | 3/2.0 | 1,500 (+7%) | 5mo | $44,000 | $29 | 62 |
| 18052 Prevost St | 0.40mi | 3/1.5 | 1,270 (-9%) | 6mo | $90,000 | $71 | 59 |
| 16818 Gilchrist St | 0.28mi | 3/1.0 | 1,190 (-15%) | 3mo | $83,000 | $70 | 59 |
| 16546 Sussex St St | 0.74mi | 3/2.0 | 1,400 (0%) | 4mo | $203,000 | $145 | 58 |
| 16727 Mansfield St | 0.31mi | 3/1.5 | 1,207 (-14%) | 3mo | $165,000 | $137 | 58 |
| 16709 Lindsay St | 0.44mi | 3/1.0 | 1,218 (-13%) | 2mo | $124,888 | $103 | 56 |
| 16199 Ferguson St | 0.51mi | 3/1.0 | 1,192 (-15%) | 4mo | $85,000 | $71 | 48 |
| 18477 Prevost St | 0.64mi | 3/2.0 | 1,234 (-12%) | 2mo | $163,695 | $133 | 45 |
| 17207 Archdale St | 0.47mi | 4/2.0 (+1) | 1,600 (+14%) | 2mo | $151,000 | $94 | 44 |
Match score weights: distance 35% · size 25% · config 20% · recency 20%. Top-matched comps best support the ARV.
Projected returns pro-forma
-3.0% appreciation · 3.25% rent growth · sell at horizon
- IRR
- -16.6%
- Equity multiple
- 0.41×
- Total profit
- $-26,119
- Equity at exit
- $23,543
- IRR
- -7.9%
- Equity multiple
- 0.50×
- Total profit
- $-22,183
- Equity at exit
- $13,652
Cash invested: $44,212 (down + closing). Projections, not guarantees.
Landlord ↔ Tenant lean methodology
- Overall (STATE)
- 62 Landlord-Friendly
- State Michigan
- 62 Landlord-Friendly · EVEN
- County
- — inherits STATE
- City
- — inherits STATE
ZIP-level market 48235
- Rents YoY
- 3.2%
- Active inventory
- 291
- Price-to-rent
- 9.0×
Monthly cashflow live
- Estimated rent
- $1,464 high interval (Pro) →
- Mortgage (P&I)
- −$828
- Tax from tax record
- −$278 /mo · $3,340/yr
- Insurance
- −$66
- HOA
- −$0
- Vacancy / Maint / Mgmt
- −$308
- Net cashflow
- $-15
Break-even live
Sensitivity live
| Price | -10% $74 | -5% $29 | +0% $-15 | +5% $-60 | +10% $-105 |
|---|---|---|---|---|---|
| Rent | -10% $-131 | -5% $-73 | +0% $-15 | +5% $43 | +10% $100 |
| Rate | -1.0pp $64 | -0.5pp $25 | base $-15 | +0.5pp $-56 | +1.0pp $-98 |
UW: 25.0% down · 7.5% · 30yr · 1.5% tax · 5.0% vac · 8.0% maint · 8.0% mgmt
Financing live
Cash to close
- Down payment
- $39,475
- Closing costs
- $4,737
- Reserves months
- —
- Total cash needed
- —
Loan-product check · same deal, 3 products live
Conventional
25% down · 7.5% · 30yr
- Down + closing
- —
- Monthly P&I
- —
- Monthly cashflow
- —
- DSCR
- —
- Eligible?
- —
Personal DTI + credit; lowest rate.
DSCR
20% down · 8.5% · 30yr
- Down + closing
- —
- Monthly P&I
- —
- Monthly cashflow
- —
- DSCR
- —
- Eligible?
- —
No personal income docs; deal must DSCR.
Hard money
10% down · 12.0% · 12mo
- Down + closing
- —
- Monthly P&I
- —
- Monthly cashflow
- —
- DSCR
- —
- Eligible?
- —
Short-term bridge; refi at stabilization.
Rent comps 40 comps
| Address | Beds | Baths | Sqft | Rent | $/sqft | DOM | Units | Dist |
|---|---|---|---|---|---|---|---|---|
| 17201 Saint Marys St Detroit, MI | 2.0 | 1.0 | 1200 | $1,200 | $1.00 | 0d | 1 | 0.05mi |
| 17201 Saint Marys St Detroit, MI | 2.0 | 1.0 | 1200 | $1,200 | $1.00 | 4d | 1 | 0.05mi |
| 17165 Prevost St Detroit, MI | 3.0 | 1.0 | 1060 | $2,400 | $2.26 | 3d | 1 | 0.21mi |
| 17573 Asbury Park Detroit, MI | 3.0 | 2.0 | 990 | $1,400 | $1.41 | 0d | 1 | 0.26mi |
| 16876 Harlow Ave Unit (NO) Detroit, MI | 3.0 | 1.0 | 1250 | $1,350 | $1.08 | 45d | 1 | 0.39mi |
| 16535 Asbury Park Detroit, MI | 3.0 | 1.5 | 1152 | $1,450 | $1.26 | 26d | 1 | 0.42mi |
| 16210 Ferguson St Detroit, MI | 4.0 | 2.0 | 1493 | $1,750 | $1.17 | 5d | 1 | 0.48mi |
| 18400 Rutherford St Detroit, MI | 3.0 | 1.0 | 1050 | $1,400 | $1.33 | 5d | 1 | 0.58mi |
| 15866 Mansfield St Detroit, MI | 3.0 | 1.0 | 1324 | $1,425 | $1.08 | 26d | 1 | 0.65mi |
| 18427 Greenfield Rd Detroit, MI | 2.0 | 1.0 | 952 | $980 | $1.03 | 6d | 1 | 0.71mi |
| 18481 Prest St Detroit, MI | 3.0 | 1.5 | 1100 | $1,300 | $1.18 | 21d | 1 | 0.79mi |
| 15752 Rutherford St Detroit, MI | 3.0 | 2.0 | 1174 | $1,386 | $1.18 | 6d | 1 | 0.79mi |
| 18675 Forrer St Detroit, MI | 3.0 | 1.0 | 1200 | $1,225 | $1.02 | 6d | 1 | 0.79mi |
| 15736 Biltmore St Detroit, MI | 3.0 | 1.5 | 1000 | $1,200 | $1.20 | 18d | 1 | 0.80mi |
| 16757 Greenview Ave Unit 1A Detroit, MI | 3.0 | 1.5 | 1600 | $1,500 | $0.94 | 6d | 1 | 0.89mi |
| 18494 Ashton Ave Detroit, MI | 3.0 | 1.0 | 1000 | $1,600 | $1.60 | 18d | 1 | 0.89mi |
| 17654 Greenview Ave Detroit, MI | 4.0 | 1.0 | 1377 | $1,350 | $0.98 | 18d | 1 | 0.91mi |
| 16151 Robson St Detroit, MI | 3.0 | 1.0 | 1300 | $1,525 | $1.17 | 16d | 1 | 0.91mi |
| 16823 Stahelin Ave Detroit, MI | 3.0 | 2.5 | 1500 | $1,600 | $1.07 | 19d | 1 | 0.99mi |
| 15375 Prevost St Detroit, MI | 4.0 | 1.0 | 907 | $1,300 | $1.43 | 18d | 1 | 0.99mi |
| 15810 Robson St Detroit, MI | 3.0 | 1.0 | 1142 | $1,500 | $1.31 | 26d | 1 | 1.03mi |
| 15332 Saint Marys St Detroit, MI | 3.0 | 1.0 | 1200 | $1,200 | $1.00 | 18d | 1 | 1.03mi |
| 17654 Sunderland Rd Detroit, MI | 3.0 | 1.0 | 1100 | $1,500 | $1.36 | 45d | 1 | 1.06mi |
| 19307 Lindsay St Detroit, MI | 2.0 | 1.0 | 900 | $1,100 | $1.22 | 0d | 1 | 1.09mi |
| 15468 Sussex St #2 Detroit, MI | 2.0 | 1.0 | 900 | $1,250 | $1.39 | 45d | 1 | 1.10mi |
| 18964 Coyle St Detroit, MI | 3.0 | 1.0 | 1300 | $1,350 | $1.04 | 4d | 1 | 1.11mi |
| 15065 Gilchrist St Detroit, MI | 3.0 | 1.0 | 1100 | $1,250 | $1.14 | 45d | 1 | 1.11mi |
| 17238 Shaftsbury Ave Detroit, MI | 3.0 | 1.0 | 1200 | $1,550 | $1.29 | 45d | 1 | 1.13mi |
| 18257 Mark Twain St Detroit, MI | 3.0 | 1.0 | 1185 | $1,507 | $1.27 | 18d | 1 | 1.16mi |
| 19440 Rutherford St Detroit, MI | 3.0 | 1.0 | 1000 | $1,400 | $1.40 | 26d | 1 | 1.22mi |
| 19400 Harlow St Detroit, MI | 4.0 | 1.0 | 1298 | $1,275 | $0.98 | 18d | 1 | 1.23mi |
| 19467 Rutherford St Detroit, MI | 3.0 | 1.0 | 1002 | $1,200 | $1.20 | 18d | 1 | 1.25mi |
| 15330 Coyle St Unit 1 Detroit, MI | 3.0 | 1.0 | 1000 | $1,425 | $1.43 | 14d | 1 | 1.25mi |
| 15330 Coyle St Unit 2 Detroit, MI | 3.0 | 1.0 | 1000 | $1,450 | $1.45 | 26d | 1 | 1.25mi |
| 15330 Coyle St Unit 1 Detroit, MI | 3.0 | 1.0 | 1000 | $1,375 | $1.38 | 26d | 1 | 1.25mi |
| 15328 Coyle St Detroit, MI | 3.0 | 1.0 | 1000 | $1,450 | $1.45 | 19d | 1 | 1.25mi |
| 19503 Mansfield St Detroit, MI | 3.0 | 1.0 | 1200 | $1,350 | $1.12 | 18d | 1 | 1.27mi |
| 14800 Woodmont Ave Detroit, MI | 3.0 | 2.0 | 1612 | $1,525 | $0.95 | 16d | 1 | 1.28mi |
| 18452 Shaftsbury Ave Detroit, MI | 3.0 | 1.0 | 927 | $1,500 | $1.62 | 18d | 1 | 1.29mi |
| 15341 Lauder St Detroit, MI | 4.0 | 1.5 | 1080 | $1,475 | $1.37 | 18d | 1 | 1.30mi |
Listing history 50 events
-
2026-06-21days on market $157,900 Active 291 DOM
-
2026-06-18days on market $157,900 Active 288 DOM
-
2026-06-17days on market $157,900 Active 287 DOM
-
2026-06-15days on market $157,900 Active 285 DOM
-
2026-06-13days on market $157,900 Active 283 DOM
-
2026-06-13days on market $157,900 Active 282 DOM
-
2026-06-09days on market $157,900 Active 279 DOM
-
2026-06-08days on market $157,900 Active 278 DOM
-
2026-06-07days on market $157,900 Active 277 DOM
-
2026-06-04days on market $157,900 Active 274 DOM
-
2026-06-03days on market $157,900 Active 273 DOM
-
2026-06-01days on market $157,900 Active 271 DOM
-
2026-05-31days on market $157,900 Active 270 DOM
-
2025-11-19price $159,900 460-char remark
Show marketing remark (460 chars)
Well-maintained 3-bedroom, 1.5-bath home offers over 1,400 sq ft of comfortable living space. Recently updated with modern finishes, the property features a functional layout and an inviting living area. Currently tenant-occupied and generating steady rental income at $1,600/month, this is an ideal turnkey investment. Located in a growing neighborhood with convenient access to schools, shopping, and major highways. A solid addition to any rental portfolio!
-
2025-11-18price $159,900 460-char remark
Show marketing remark (460 chars)
Well-maintained 3-bedroom, 1.5-bath home offers over 1,400 sq ft of comfortable living space. Recently updated with modern finishes, the property features a functional layout and an inviting living area. Currently tenant-occupied and generating steady rental income at $1,600/month, this is an ideal turnkey investment. Located in a growing neighborhood with convenient access to schools, shopping, and major highways. A solid addition to any rental portfolio!
-
2025-08-29$170,000 Active 460-char remark
Show marketing remark (460 chars)
Well-maintained 3-bedroom, 1.5-bath home offers over 1,400 sq ft of comfortable living space. Recently updated with modern finishes, the property features a functional layout and an inviting living area. Currently tenant-occupied and generating steady rental income at $1,600/month, this is an ideal turnkey investment. Located in a growing neighborhood with convenient access to schools, shopping, and major highways. A solid addition to any rental portfolio!
-
2025-02-24historical
-
2025-02-24historical
-
2025-02-16historical $1,600
-
2025-02-01price $1,600
-
2025-01-15price $1,700
-
2025-01-15price $174,900
-
2025-01-14price $174,900
-
2025-01-01$1,750
-
2024-12-23historical $1,750
-
2024-12-21price $164,900
-
2024-12-20status Active
-
2024-12-20status Active
-
2024-12-20price $164,900
-
2024-11-12historical
-
2024-11-12historical
-
2024-10-12price $1,750
-
2024-08-28$1,795
-
2024-08-23$179,900 Active
-
2024-08-23$179,900 Active
-
2024-06-14soldstatus $70,000 Sold
-
2024-06-14soldstatus $70,000 Closed
-
2024-06-13status Pending
-
2024-06-13status Pending
-
2024-04-24price $99,999
-
2024-04-24price $99,999
-
2024-04-01$129,999 Active
-
2024-04-01$129,999 Active
-
2024-01-01historical
-
2024-01-01historical
-
2023-11-30price $159,999
-
2023-11-30price $159,999
-
2023-11-02$160,000 Active
-
2023-11-02$160,000 Active
ⓘ Source: listings_history table (triggers on properties + properties_extension) + one-shot
backfill from property_details.listing_events for pre-trigger history.
Tax reassessment forecast MI · Partial reset (capped growth)
- Current annual tax
- $3,340 · $278/mo
- Projected year-2 tax
- $3,340 · $278/mo
- Expected delta
- $0/yr ($0/mo · 0.0%)
ⓘ Screening estimate from a state-policy table — verify with the county assessor before closing.
Climate risk First Street
- Flood 1/10 Low FEMA zone X (unshaded) · 0% chance over 30 yrs
- Wildfire 1/10 Low
- Heat 3/10 Moderate 7 d/yr ≥98°F today · 15 d/yr by 30 yrs out
- Wind 2/10 Low
- Air quality 3/10 Moderate 2 unhealthy d/yr today · 5 by 30 yrs out
Nearby sold comps map
Loading sold comps map…
Walkable amenities ~0.75 mi
Loading nearby amenities…
Taxation est. · year 1
- Rental income
- $17,572
- − Mortgage interest
- −$8,845
- − Property taxes
- −$3,340
- − Insurance
- −$790
- − Repairs & maintenance
- −$1,406
- − Management
- −$1,406
- − Depreciation
- −$4,593
- Taxable loss
- −$2,807
- Est. tax savings @ 24.0%
- +$674
- After-tax cash flow
- $490/yr
For passive investors: Depreciation is non-cash, so a rental often shows a tax loss while cash-flowing — sheltering income. Rental losses are passive: they offset passive income freely, and up to $25,000/yr can offset ordinary (W-2) income if you actively participate and your MAGI is under $100k (phasing out to $0 by $150k); unused losses carry forward. On sale, claimed depreciation is recaptured at up to 25%, and gains may owe capital-gains tax (a 1031 exchange can defer both). Figures are a year-1 estimate at your 24.0% rate — not tax advice; consult a CPA.
Schools (NCES district)
- District
- Detroit Public Schools Community District
- NCES district ID
- 2601103
- Math proficiency
- 10% ▼ -2.00%
- Reading proficiency
- 24% ▲ 6.00%
- Median HH income
- $25,815
- Composite
- 13.06/100
- National rank
- #9564
- State rank
- #499 of 540 in MI
Livability — Detroit
- Score
- 73/100
- State rank
- #218
- US rank
- #5427
Category grades
Schools grade is shown separately in the Schools card above.
Census & demographics
- Census place
- Detroit, MI
- County
- Wayne County · 1,562,939 people
- City population
- 572,865
- Metro
- Detroit-Warren-Dearborn, MI
- Population (ZIP)
- 45,600
- Household income
- $39,265
- Rent vs Own
- Severe rent burden
- 3064.0
Population outlook (Wayne County) Hauer SSP2
- Today (2025)
- 1,675,273 people
- By 2030
- 1,620,300 · -3.3%
- By 2040
- 1,502,341 · -10.3%
- By 2050
- 1,384,039 · -17.4%
- By 2075
- 1,124,592 · -32.9%
- By 2100
- 881,193 · -47.4%
Race, ethnicity, and origin ACS 2023
- Neighborhood character
- Predominantly Black (94%)
- Race & ethnicity
- Black 94% White 3% Two or more races 2% Hispanic / Latino 1%
- Foreign-born
- 1% · Canada
- Languages at home
- 98% English-only · Spanish 1%
Political lean MEDSL · Wayne
- 2024 margin
- Strong D (+29.0) · D 62.7% · R 33.7% · Other 3.6%
- 2008→2024 swing
- -20.5pp toward R · 2008: 49.5pp · 2024: 29.0pp
- All cycles
- 2024: D+29.0 2020: D+38.1 2016: D+37.3 2012: D+46.9 2008: D+49.5
Not yet ingested
- Civics
- —
Market trends
- HPI YoY
- ▼ -153.02%
- Current HPI
- 263.6326
- Rent YoY
- ▲ 3.25%
- Metro
- Detroit-Warren-Dearborn, MI
- State GDP YoY
- ▲ 1.37%
- F500 in state
- 28
Industry mix (Fortune 500 HQ in MI)
| Industry | F500 HQs | Revenue |
|---|---|---|
| Automotive Parts | 3 | $48B |
|
||
| Automotive | 2 | $372B |
|
||
| Chemicals | 1 | $45B |
|
||
| Automotive Retail | 1 | $29B |
|
||
| Healthcare / Medical Devices | 1 | $23B |
|
||
| Automotive Technology | 1 | $20B |
|
||
Price history
+116.1% since first listed59 events — show timeline
- 2025-11-19 Price Changed $159,900 MiRealSource-MiMLS
- 2025-11-18 Price Changed $159,900 REALCOMP
- 2025-08-29 Listed $170,000 REALCOMP
- 2025-08-29 Listed $170,000 MiRealSource-MiMLS
- 2025-02-24 Listing Removed — REALCOMP
- 2025-02-24 Listing Removed — MiRealSource-MiMLS
- 2025-02-16 Rental Removed $1,600 APPFOLIO
- 2025-02-01 Price Changed $1,600 APPFOLIO
- 2025-01-15 Price Changed $1,700 APPFOLIO
- 2025-01-15 Price Changed $174,900 MiRealSource-MiMLS
- 2025-01-14 Price Changed $174,900 REALCOMP
- 2025-01-01 Listed for Rent $1,750 APPFOLIO
- 2024-12-23 Rental Removed $1,750 APPFOLIO
- 2024-12-21 Price Changed $164,900 MiRealSource-MiMLS
- 2024-12-20 Relisted — MiRealSource-MiMLS
- 2024-12-20 Relisted — REALCOMP
- 2024-12-20 Price Changed $164,900 REALCOMP
- 2024-11-12 Listing Removed — MiRealSource-MiMLS
- 2024-11-12 Listing Removed — REALCOMP
- 2024-10-12 Price Changed $1,750 APPFOLIO
- 2024-08-28 Listed for Rent $1,795 APPFOLIO
- 2024-08-23 Listed $179,900 MiRealSource-MiMLS
- 2024-08-23 Listed $179,900 REALCOMP
- 2024-06-14 Sold (MLS) $70,000 MiRealSource-MiMLS
- 2024-06-14 Sold (MLS) $70,000 REALCOMP
- 2024-06-13 Pending — MiRealSource-MiMLS
- 2024-06-13 Pending — REALCOMP
- 2024-04-24 Price Changed $99,999 MiRealSource-MiMLS
- 2024-04-24 Price Changed $99,999 REALCOMP
- 2024-04-01 Listed $129,999 MiRealSource-MiMLS
- 2024-04-01 Listed $129,999 REALCOMP
- 2024-01-01 Listing Removed — MiRealSource-MiMLS
- 2024-01-01 Listing Removed — REALCOMP
- 2023-11-30 Price Changed $159,999 MiRealSource-MiMLS
- 2023-11-30 Price Changed $159,999 REALCOMP
- 2023-11-02 Listed $160,000 MiRealSource-MiMLS
- 2023-11-02 Listed $160,000 REALCOMP
- 2023-03-20 Listing Removed — MiRealSource-MiMLS
- 2023-03-20 Listing Removed — REALCOMP
- 2022-12-29 Listed $119,000 MiRealSource-MiMLS
- 2022-12-29 Listed $119,000 REALCOMP
- 2021-11-15 Listing Removed — REALCOMP
- 2021-11-15 Listing Removed — MiRealSource-MiMLS
- 2021-03-15 Contingent — MiRealSource-MiMLS
- 2021-03-15 Contingent — REALCOMP
- 2021-03-10 Listed $29,900 MiRealSource-MiMLS
- 2021-03-10 Listed $29,900 REALCOMP
- 2004-06-09 Sold (Public Records) $130,000 Public Records
- 2003-12-23 Listing Removed — REALCOMP
- 2003-09-30 Listed $125,000 REALCOMP
- 2003-06-10 Listing Removed — REALCOMP
- 2002-12-10 Listed $121,000 REALCOMP
- 2001-02-21 Sold (Public Records) $103,000 Public Records
- 2000-09-15 Sold (MLS) $110,000 REALCOMP
- 2000-03-06 Listed $110,000 REALCOMP
- 1999-01-16 Listing Removed — REALCOMP
- 1998-07-16 Listed $74,000 REALCOMP
- 1998-06-06 Listing Removed — REALCOMP
- 1998-03-06 Listed $74,000 REALCOMP
Property tax history
+3.5%/yrLatest (2025): $3,340 · +34.3% YoY. Source: county tax records.
Cash-flow waterfall
monthlySold comps — $/sqft
last 12 mo · ≤1 miLoading sold comps…