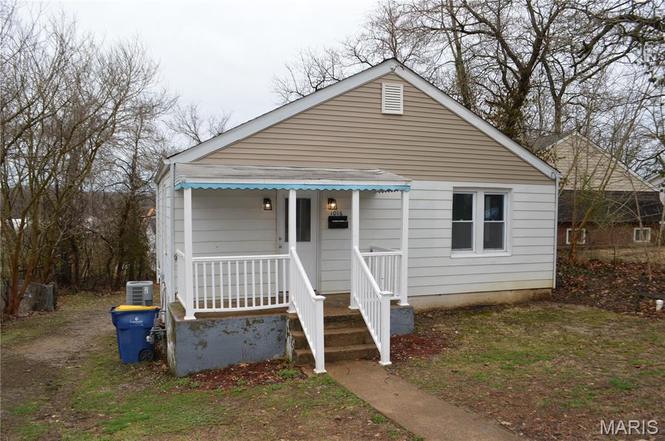
1016 Ann St · Festus, MO
Flood risk 1/10 · Minimal
- FEMA flood zone
- X (unshaded)
- Chance of flooding over 30 yrs
- 0.0%
- Est. flood insurance / yr
- $473 – $860
Fire risk 3/10 · Minor
- Est. fire insurance / yr
- $1,054 – $1,958
Heat risk 5/10 · Moderate
- Hot days now (above 107°F)
- 7 days/yr
- Hot days in 30 yrs
- 20 days/yr
Wind risk 2/10 · Minimal
- Chance of severe wind over 30 yrs
- 1.0%
Air-quality risk 1/10 · Minimal
- Unhealthy air days now
- 0 days/yr
- Unhealthy air days in 30 yrs
- 0 days/yr
Risk factors via First Street. Map © Google.
Why this score? — see what drove the C- grade
The composite is a weighted blend of 9 inputs, each scored 0–100. Each bar is that input's sub-score; the figure is the points it added to the 100-point composite (weight × sub-score).
- Cash flow +19.7/30.0
- ARV discount +7.5/15.0
- DSCR +6.2/10.0
- Schools +5.1/10.0
- 1% rule +4.1/10.0
- Livability +3.4/5.0
- Rent growth +2.5/5.0
- Condition / age +2.5/5.0
- Appreciation +0.0/10.0
$165,000
🖨 Deal sheet (PDF) 📄 Offer letter ✓ Due diligence
Listing remarks
GREAT HOME IN A SUPER LOCATION. Situated right in the heart of town near schools and shopping, this updated 3 bedroom ranch home perfect. Eat-in kitchen boasts white cabinets, tile backsplash and luxury vinyl flooring. Other updates include: New roof, plumbing, A/C, roof and electric. Full walkout basement adds for additional storage and off street parking. Covered back porch is the perfect place to sip your morning coffee. Don’t miss out! This home is move-in ready. Call today to take a look inside.
Key facts
- New plumbing
- New a/c
- New electric
Tags
Neighborhood map
What this means for you Summary
Snapshot
- This is a 3-bed/1.0-bath other listed at $165k.
Deal economics
- At list price, monthly cash flow is $194 ($2k/yr) — positive.
- The deal already cash-flows at list — no discount required.
- To meet the 1% rule (rent ≥ 1% of price), the offer needs to be $150k (9.1% below list).
- Recommended offer: $150k (9.1% below list) — sets the bar for 1% rule.
- Cap rate 7.7% vs local median 3.6% in Festus — top-decile yield for the area; either an underpriced asset or a hidden risk that comps aren't pricing in. Stress-test before assuming the spread holds.
Location & tenants
- Location reads 68/100 on livability (#182 in MO) — a middle-class / working-renter tenant base. Strengths: cost of living A+, housing A+, crime A-; Watch: amenities F, commute F, health & safety F.
- Festus R-VI (suburban): math 55% / reading 64% proficiency, ranked #16 of 324 in MO (top 5%) — acceptable for families but not a draw, mixed tenant base, ~2y average lease.
- Zoned schools: Festus Elem. (math 73% / reading 73%, grade A, #16 of 1,115 statewide, top 2%, 1,039 students, 36% FRL); Festus Sr. High (math 37% / reading 60%, grade D, #147 of 521 statewide, top 29%, 979 students, 36% FRL) — zoned schools at 36% FRL track the district average.
- Market conditions: 172 active listings in the ZIP; 1 comparable units currently listed for rent nearby; 807 units permitted in Jefferson County in 2024 (104 in 5+ unit buildings).
Forward outlook
- Local home prices are declining (-3.0%/yr); year-one equity from $1k of loan paydown is wiped out by about $5k of value loss. Plan a longer hold.
Negotiation context
- It's been on market 42 days — a 3% lower offer ($160k) is reasonable based on typical stale-listing flexibility.
- 3 sale attempts; this cycle's ask has dropped $10k (6%) from the opening price — seller is motivated, your offer sets the floor, not the list.
Risks & watch-outs
- Watch-outs: built in 1950 — expect roof / HVAC / electrical / plumbing capex.
- Climate carrying-cost: extreme-heat days projected 7→20/yr by 2055 (HVAC capex compounding) — expect insurance premiums to compound above CPI over the hold.
Questions for the listing agent
- It's been on market 42 days. Have you received any prior offers? Is the seller open to a 9% concession, seller financing, or rate buy-down credit?
- Built in 1950 — when were the roof, HVAC, electrical panel, plumbing, and water heater last replaced?
- Is there a deadline driving the sale (1031 exchange, divorce, estate, relocation)? That informs how much negotiation room exists.
- Schools are B-rated — typically a magnet for longer-tenancy family renters. What's the average tenant stay here, and is there a school-zone premium baked into asking?
- What's the average days-on-market for RENTAL listings here right now (not sales)? A rising rental-DOM trend means longer vacancies and softer asking-rent achievability than the comps imply.
- What's the recent tenant-quality profile in this submarket — average credit score on applications, eviction rate, late-payment / NSF rate, and stable-employment percentage? A property-management company in the area should have these aggregated.
- How much new for-sale + rental construction is in the pipeline within 1–3 miles? Heavy new supply typically softens prices + rents 12–24 months out; constrained supply supports both.
Investment metrics
- 1% rule
- 0.91% ✗
- Cap rate
- 7.71%
- Cash-on-cash
- 5.05%
- DSCR
- 1.22
- GRM
- 9.2
CMA / ARV
No comps found within radius.
Projected returns pro-forma
-3.0% appreciation · 3.0% rent growth · sell at horizon
- IRR
- -8.5%
- Equity multiple
- 0.69×
- Total profit
- $-14,434
- Equity at exit
- $24,602
- IRR
- 0.9%
- Equity multiple
- 1.07×
- Total profit
- $3,080
- Equity at exit
- $14,266
Cash invested: $46,200 (down + closing). Projections, not guarantees.
Landlord ↔ Tenant lean methodology
- Overall (STATE)
- 81 Strongly Landlord-Friendly
- State Missouri
- 81 Strongly Landlord-Friendly · R+10
- County
- — inherits STATE
- City
- — inherits STATE
ZIP-level market 63028
- Home prices YoY
- -29.9%
- Active inventory
- 172
- Price-to-rent
- 9.2×
Monthly cashflow live
- Estimated rent
- $1,500 medium interval (Pro) →
- Mortgage (P&I)
- −$865
- Tax from tax record
- −$57 /mo · $681/yr
- Insurance
- −$69
- HOA
- −$0
- Vacancy / Maint / Mgmt
- −$315
- Net cashflow
- $194
Break-even live
Sensitivity live
| Price | -10% $288 | -5% $241 | +0% $194 | +5% $148 | +10% $101 |
|---|---|---|---|---|---|
| Rent | -10% $76 | -5% $135 | +0% $194 | +5% $254 | +10% $313 |
| Rate | -1.0pp $277 | -0.5pp $236 | base $194 | +0.5pp $151 | +1.0pp $108 |
UW: 25.0% down · 7.5% · 30yr · 1.5% tax · 5.0% vac · 8.0% maint · 8.0% mgmt
Financing live
Cash to close
- Down payment
- $41,250
- Closing costs
- $4,950
- Reserves months
- —
- Total cash needed
- —
Loan-product check · same deal, 3 products live
Conventional
25% down · 7.5% · 30yr
- Down + closing
- —
- Monthly P&I
- —
- Monthly cashflow
- —
- DSCR
- —
- Eligible?
- —
Personal DTI + credit; lowest rate.
DSCR
20% down · 8.5% · 30yr
- Down + closing
- —
- Monthly P&I
- —
- Monthly cashflow
- —
- DSCR
- —
- Eligible?
- —
No personal income docs; deal must DSCR.
Hard money
10% down · 12.0% · 12mo
- Down + closing
- —
- Monthly P&I
- —
- Monthly cashflow
- —
- DSCR
- —
- Eligible?
- —
Short-term bridge; refi at stabilization.
Rent comps 1 comps
| Address | Beds | Baths | Sqft | Rent | $/sqft | DOM | Units | Dist |
|---|---|---|---|---|---|---|---|---|
| 100 Ozark Dr Crystal City, MO | 3.0 | 1.0 | 1064 | $1,500 | $1.41 | 24d | 1 | 0.80mi |
Listing history 8 events
-
2026-04-28status Pending
-
2026-04-13status Active
-
2026-04-08status Active
-
2026-04-08price $165,000
-
2026-04-01status Pending
-
2026-03-09$175,000 Active
-
2026-03-09historical $175,000
-
2020-11-23soldstatus
ⓘ Source: listings_history table (triggers on properties + properties_extension) + one-shot
backfill from property_details.listing_events for pre-trigger history.
Tax reassessment forecast MO · Resets to sale price
- Current annual tax
- $681 · $57/mo
- Projected year-2 tax
- $1,600 · $133/mo
- Expected delta
- +$920/yr (+$77/mo · 135.1%)
ⓘ Screening estimate from a state-policy table — verify with the county assessor before closing.
Climate risk First Street
- Flood 1/10 Low FEMA zone X (unshaded) · 0% chance over 30 yrs
- Wildfire 3/10 Moderate
- Heat 5/10 Major 7 d/yr ≥107°F today · 20 d/yr by 30 yrs out
- Wind 2/10 Low 100% chance of damaging wind over 30 yrs
- Air quality 1/10 Low 0 unhealthy d/yr today · 0 by 30 yrs out
Nearby sold comps map
Loading sold comps map…
Walkable amenities ~0.75 mi
Loading nearby amenities…
Taxation est. · year 1
- Rental income
- $18,000
- − Mortgage interest
- −$9,243
- − Property taxes
- −$681
- − Insurance
- −$825
- − Repairs & maintenance
- −$1,440
- − Management
- −$1,440
- − Depreciation
- −$4,800
- Taxable loss
- −$428
- Est. tax savings @ 24.0%
- +$103
- After-tax cash flow
- $2,434/yr
For passive investors: Depreciation is non-cash, so a rental often shows a tax loss while cash-flowing — sheltering income. Rental losses are passive: they offset passive income freely, and up to $25,000/yr can offset ordinary (W-2) income if you actively participate and your MAGI is under $100k (phasing out to $0 by $150k); unused losses carry forward. On sale, claimed depreciation is recaptured at up to 25%, and gains may owe capital-gains tax (a 1031 exchange can defer both). Figures are a year-1 estimate at your 24.0% rate — not tax advice; consult a CPA.
Schools (NCES district)
- District
- Festus R-VI
- NCES district ID
- 2912030
- Math proficiency
- 55% ▼ -7.00%
- Reading proficiency
- 64% ▼ -1.00%
- Median HH income
- $51,632
- Composite
- 50.79/100
- National rank
- #1808
- State rank
- #16 of 324 in MO
Livability — Festus
- Score
- 68/100
- State rank
- #182
- US rank
- #9543
Category grades
Schools grade is shown separately in the Schools card above.
Census & demographics
- Census place
- Festus, MO
- Population (ZIP)
- 27,913
Population outlook (Jefferson County) Hauer SSP2
- Today (2025)
- 235,088 people
- By 2030
- 238,365 · +1.4%
- By 2040
- 240,156 · +2.2%
- By 2050
- 234,651 · -0.2%
- By 2075
- 214,569 · -8.7%
- By 2100
- 179,697 · -23.6%
Race, ethnicity, and origin ACS 2023
- Neighborhood character
- Predominantly White (89%)
- Race & ethnicity
- White 89% Two or more races 6% Hispanic / Latino 2% Black 2% Asian 1%
- Common ancestry
- Lithuanian 6% Slovak 1% Romanian 1%
- Foreign-born
- 1%
- Languages at home
- 98% English-only · Spanish 1%
Political lean MEDSL · Jefferson
- 2024 margin
- Solid R (+36.7) · D 31.0% · R 67.7% · Other 1.3%
- 2008→2024 swing
- -39.3pp toward R · 2008: 2.5pp · 2024: -36.7pp
- All cycles
- 2024: R+36.7 2020: R+33.9 2016: R+35.3 2012: R+12.7 2008: D+2.5
Not yet ingested
- Civics
- —
Market trends
- HPI YoY
- ▼ -93.59%
- Current HPI
- 219.9705
- Rent YoY
- —
- Metro
- —
- State GDP YoY
- ▲ 1.84%
- F500 in state
- 20
Industry mix (Fortune 500 HQ in MO)
| Industry | F500 HQs | Revenue |
|---|---|---|
| Healthcare | 1 | $163B |
|
||
| Insurance | 1 | $21B |
|
||
| Industrial Technology | 1 | $17B |
|
||
| Retail | 1 | $16B |
|
||
| Industrial Distribution | 1 | $10B |
|
||
| Utilities | 1 | $9B |
|
||
Price history
-5.7% since first listed8 events — show timeline
- 2026-04-28 Pending — MARIS as Distributed by MLS Grid
- 2026-04-13 Relisted — MARIS as Distributed by MLS Grid
- 2026-04-08 Relisted — MARIS as Distributed by MLS Grid
- 2026-04-08 Price Changed $165,000 MARIS as Distributed by MLS Grid
- 2026-04-01 Pending — MARIS as Distributed by MLS Grid
- 2026-03-09 Listed $175,000 MARIS as Distributed by MLS Grid
- 2026-03-09 Coming Soon $175,000 MARIS as Distributed by MLS Grid
- 2020-11-23 Sold (Public Records) — Public Records
Property tax history
+3.1%/yrLatest (2025): $681 · +2.8% YoY. Source: county tax records.
Cash-flow waterfall
monthlySold comps — $/sqft
last 12 mo · ≤1 miLoading sold comps…