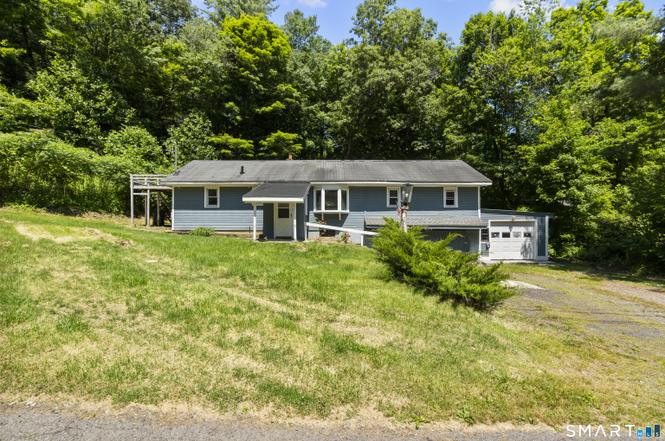
201 Berkshire Rd · Southbury, CT
Flood risk 9/10 · Severe
- FEMA flood zone
- X (unshaded)
- Chance of flooding over 30 yrs
- 0.99%
- Est. flood insurance / yr
- $473 – $860
Fire risk 3/10 · Minor
- Est. fire insurance / yr
- $829 – $1,539
Heat risk 5/10 · Moderate
- Hot days now (above 99°F)
- 7 days/yr
- Hot days in 30 yrs
- 15 days/yr
Wind risk 6/10 · Moderate
- Chance of severe wind over 30 yrs
- 27.0%
Air-quality risk 4/10 · Minor
- Unhealthy air days now
- 3 days/yr
- Unhealthy air days in 30 yrs
- 5 days/yr
Risk factors via First Street. Map © Google.
Why this score? — see what drove the B grade
The composite is a weighted blend of 9 inputs, each scored 0–100. Each bar is that input's sub-score; the figure is the points it added to the 100-point composite (weight × sub-score).
- Cash flow +26.9/30.0
- ARV discount +15.0/15.0
- DSCR +9.3/10.0
- 1% rule +7.1/10.0
- Schools +5.4/10.0
- Rent growth +2.5/5.0
- Livability +2.5/5.0
- Condition / age +2.5/5.0
- Appreciation +0.0/10.0
$225,000
🖨 Deal sheet (PDF) 📄 Offer letter ✓ Due diligence
Listing remarks
* * HIGHEST AND BEST DUE MONDAY 6/22 AT 12PM * * Opportunity knocks at 201 Berkshire Road in desirable Southbury! This 3-bedroom, 1-bath ranch offers an incredible opportunity for homeowners, investors, or builders looking to make their mark in one of Connecticut's most sought-after towns. Whether you're looking to update the existing home and make it your own or explore the potential to build larger, this property offers plenty of possibilities. Located on Berkshire Road and facing Aspetuck Trail, the home enjoys an added sense of privacy while remaining close to everything Southbury has to offer. Known for its highly regarded schools, scenic beauty, and convenient location along I-84, S
Key facts
- Outdoor recreation
- Nearby attractions
- Convenient location
Tags
Property features AI
Finance
- Other: Assessors' value available
Exterior
- Parking: Attached garage (1 car)
- Utilities: Private well water; Septic sewer
- Home design: Single-family home
- Construction: Frame construction; Vinyl siding; Asphalt shingle roof; Block and concrete foundation; Built with living area of approximately 1312
- Exterior features: Sloping lot; Blue exterior siding
Interior
- Kitchen: Dishwasher
- Bedrooms: 3 bedrooms
- Bathrooms: 1 full bathroom
- Heating & cooling: Hot water heat; Oil-fired heating; fuel tank located in the basement; Domestic hot water
- Interior features: 6 total rooms; Partial, unfinished basement with partial walk-out; Has attic
Neighborhood map
What this means for you Summary
Snapshot
- This is a 3-bed/1.0-bath single-family listed at $225k.
Deal economics
- At list price, monthly cash flow is $566 ($7k/yr) — positive.
- The deal already cash-flows at list — no discount required.
- Meets the 1% rule at list price ($3k rent vs $225k).
Location & tenants
- Location reads: area grade B — affects rentability + tenant quality, not the cash-flow math above.
- Regional School District 15 (suburban): math 56% / reading 64% proficiency, ranked #46 of 153 in CT (top 30%) — acceptable for families but not a draw, mixed tenant base, ~2y average lease; only 4% free/reduced lunch — higher-income household profile.
- Zoned schools: Gainfield Elementary School (math 67% / reading 67%, grade B+, #99 of 553 statewide, top 19%, 351 students, 13% FRL); Rochambeau Middle School (math 56% / reading 69%, grade B+, #36 of 175 statewide, top 21%, 384 students, 12% FRL); Pomperaug Regional High School (math 54% / reading 74%, grade B-, #37 of 194 statewide, top 19%, 1,039 students, 14% FRL).
- Market conditions: 159 active listings in the ZIP; 502 units permitted in Naugatuck Valley Planning Region in 2024 (171 in 5+ unit buildings).
Forward outlook
- Local home prices are declining (-3.0%/yr); year-one equity from $2k of loan paydown is wiped out by about $7k of value loss. Plan a longer hold.
Negotiation context
- Only 5 days on market — expect competitive offers; lowballing is unlikely to land.
Risks & watch-outs
- Watch-outs: flood insurance adds $56/mo; built in 1950 — expect roof / HVAC / electrical / plumbing capex.
- Climate carrying-cost: severe flood risk; major wind risk, 27% chance of damaging wind over 30y; extreme-heat days projected 7→15/yr by 2055 (HVAC capex compounding) — expect insurance premiums to compound above CPI over the hold.
Questions for the listing agent
- Built in 1950 — when were the roof, HVAC, electrical panel, plumbing, and water heater last replaced?
- What's the actual annual flood-insurance premium (NFIP or private), and is the property in a SFHA with mandatory coverage?
- Is there a deadline driving the sale (1031 exchange, divorce, estate, relocation)? That informs how much negotiation room exists.
- What's the average days-on-market for RENTAL listings here right now (not sales)? A rising rental-DOM trend means longer vacancies and softer asking-rent achievability than the comps imply.
- What's the recent tenant-quality profile in this submarket — average credit score on applications, eviction rate, late-payment / NSF rate, and stable-employment percentage? A property-management company in the area should have these aggregated.
- How much new for-sale + rental construction is in the pipeline within 1–3 miles? Heavy new supply typically softens prices + rents 12–24 months out; constrained supply supports both.
Investment metrics
- 1% rule
- 1.21% ✓
- Cap rate
- 9.61%
- Cash-on-cash
- 11.83%
- DSCR
- 1.53
- GRM
- 6.9
CMA / ARV
- ARV (on-the-fly)
- $414,592
- Comps found
- 10
Show comp detail 10 sales within ~0.75 mi
| Address | Dist | Beds/Ba | Sqft | Sold | Price | $/sf | Match |
|---|---|---|---|---|---|---|---|
| 297 Manor Rd | 0.32mi | 3/2.0 | 1,386 (+6%) | 5mo | $354,750 | $256 | 68 |
| 102 Hillside Rd | 0.37mi | 3/2.0 | 1,393 (+6%) | 8mo | $440,000 | $316 | 62 |
| 75 Manor Rd | 0.45mi | 3/2.0 | 1,356 (+3%) | 20mo | $301,000 | $222 | 53 |
| 218 Fish Rock Rd | 0.63mi | 3/3.0 | 1,344 (+2%) | 7mo | $505,000 | $376 | 53 |
| 72 Chain Trl | 0.17mi | 3/2.0 | 1,118 (-15%) | 13mo | $435,000 | $389 | 52 |
| 355 Berkshire Rd | 0.19mi | 3/2.5 | 1,496 (+14%) | 17mo | $405,000 | $271 | 48 |
| 199 Riverside Rd | 0.61mi | 3/2.0 | 1,230 (-6%) | 14mo | $410,000 | $333 | 46 |
| 66 Narragansett Trl | 0.64mi | 3/1.0 | 1,148 (-12%) | 8mo | $350,000 | $305 | 43 |
| 5 Fleetwood Dr | 0.58mi | 3/2.0 | 1,504 (+15%) | 6mo | $510,000 | $339 | 39 |
| 578 Berkshire Rd | 0.65mi | 3/2.0 | 1,216 (-7%) | 19mo | $380,000 | $313 | 38 |
Match score weights: distance 35% · size 25% · config 20% · recency 20%. Top-matched comps best support the ARV.
Projected returns pro-forma
-3.0% appreciation · 3.0% rent growth · sell at horizon
- IRR
- -0.2%
- Equity multiple
- 0.99×
- Total profit
- $-382
- Equity at exit
- $33,548
- IRR
- 9.5%
- Equity multiple
- 1.73×
- Total profit
- $46,282
- Equity at exit
- $19,454
Cash invested: $63,000 (down + closing). Projections, not guarantees.
Landlord ↔ Tenant lean methodology
- Overall (STATE)
- 27 Tenant-Leaning
- State Connecticut
- 27 Tenant-Leaning · D+7
- County
- — inherits STATE
- City
- — inherits STATE
ZIP-level market 06488
- Active inventory
- 159
- Price-to-rent
- 6.9×
Monthly cashflow live
- Estimated rent
- $2,718 medium interval (Pro) →
- Mortgage (P&I)
- −$1,180
- Tax from tax record
- −$252 /mo · $3,030/yr
- Insurance
- −$94
- Flood insurance flood zone
- −$56 /mo · $666/yr
- HOA
- −$0
- Vacancy / Maint / Mgmt
- −$571
- Net cashflow
- $566
Break-even live
Sensitivity live
| Price | -10% $693 | -5% $629 | +0% $566 | +5% $502 | +10% $438 |
|---|---|---|---|---|---|
| Rent | -10% $351 | -5% $458 | +0% $566 | +5% $673 | +10% $780 |
| Rate | -1.0pp $679 | -0.5pp $623 | base $566 | +0.5pp $507 | +1.0pp $448 |
UW: 25.0% down · 7.5% · 30yr · 1.5% tax · 5.0% vac · 8.0% maint · 8.0% mgmt
Financing live
Cash to close
- Down payment
- $56,250
- Closing costs
- $6,750
- Reserves months
- —
- Total cash needed
- —
Loan-product check · same deal, 3 products live
Conventional
25% down · 7.5% · 30yr
- Down + closing
- —
- Monthly P&I
- —
- Monthly cashflow
- —
- DSCR
- —
- Eligible?
- —
Personal DTI + credit; lowest rate.
DSCR
20% down · 8.5% · 30yr
- Down + closing
- —
- Monthly P&I
- —
- Monthly cashflow
- —
- DSCR
- —
- Eligible?
- —
No personal income docs; deal must DSCR.
Hard money
10% down · 12.0% · 12mo
- Down + closing
- —
- Monthly P&I
- —
- Monthly cashflow
- —
- DSCR
- —
- Eligible?
- —
Short-term bridge; refi at stabilization.
Listing history 6 events
-
2026-06-22days on market $225,000 Active 5 DOM
-
2026-06-18days on market $225,000 Active 2 DOM
-
2026-06-17statusdays on market $225,000 Active 1 DOM
-
2026-06-16days on market $225,000 Coming Soon 2 DOM
-
2026-06-15remarks 699-char remark
-
2026-06-15$225,000 Coming Soon 1 DOM
ⓘ Source: listings_history table (triggers on properties + properties_extension) + one-shot
backfill from property_details.listing_events for pre-trigger history.
Tax reassessment forecast CT · Partial reset (capped growth)
- Current annual tax
- $3,030 · $252/mo
- Projected year-2 tax
- $3,922 · $327/mo
- Expected delta
- +$892/yr (+$74/mo · 29.5%)
ⓘ Screening estimate from a state-policy table — verify with the county assessor before closing.
Climate risk First Street
- Flood 9/10 Extreme FEMA zone X (unshaded) · 99% chance over 30 yrs
- Wildfire 3/10 Moderate
- Heat 5/10 Major 7 d/yr ≥99°F today · 15 d/yr by 30 yrs out
- Wind 6/10 Major 27% chance of damaging wind over 30 yrs
- Air quality 4/10 Moderate 3 unhealthy d/yr today · 5 by 30 yrs out
Nearby sold comps map
Loading sold comps map…
Walkable amenities ~0.75 mi
Loading nearby amenities…
Taxation est. · year 1
- Rental income
- $32,617
- − Mortgage interest
- −$12,603
- − Property taxes
- −$3,030
- − Insurance
- −$1,792
- − Repairs & maintenance
- −$2,609
- − Management
- −$2,609
- − Depreciation
- −$6,545
- Taxable income
- $3,427
- Est. tax owed @ 24.0%
- −$823
- After-tax cash flow
- $5,964/yr
For passive investors: Depreciation is non-cash, so a rental often shows a tax loss while cash-flowing — sheltering income. Rental losses are passive: they offset passive income freely, and up to $25,000/yr can offset ordinary (W-2) income if you actively participate and your MAGI is under $100k (phasing out to $0 by $150k); unused losses carry forward. On sale, claimed depreciation is recaptured at up to 25%, and gains may owe capital-gains tax (a 1031 exchange can defer both). Figures are a year-1 estimate at your 24.0% rate — not tax advice; consult a CPA.
Schools (NCES district)
- District
- Regional School District 15
- NCES district ID
- 0903537
- Math proficiency
- 56% ▼ -15.00%
- Reading proficiency
- 64% ▼ -11.00%
- Median HH income
- $84,697
- Composite
- 54.36/100
- National rank
- #1361
- State rank
- #46 of 153 in CT
Livability — Southbury
No livability data for this city. (Only ~50 U.S. cities are tracked.)
Census & demographics
- Population (ZIP)
- 19,973
Population outlook (Naugatuck Valley County) Hauer SSP2
- By 2040
- 496,846
Race, ethnicity, and origin ACS 2023
- Neighborhood character
- Predominantly White (83%)
- Race & ethnicity
- White 83% Hispanic / Latino 9% Two or more races 7% Asian 3% Black 2%
- Hispanic origin (detail)
- Puerto Rican 4%
- Common ancestry
- Romanian 5% Lithuanian 3% Scotch-Irish 2%
- Foreign-born
- 8% · China, Canada, Jamaica
- Languages at home
- 89% English-only · Spanish 4% Chinese 2% Other Indo-European 2%
Political lean MEDSL · Naugatuck Valley
- 2024 margin
- Lean R (+7.4) · D 45.6% · R 53.0% · Other 1.4%
- All cycles
- 2024: R+7.4
Not yet ingested
- Civics
- —
Market trends
- HPI YoY
- ▼ -124.35%
- Current HPI
- 165.0514
- Rent YoY
- —
- Metro
- —
- State GDP YoY
- ▲ 1.06%
- F500 in state
- 38
Industry mix (Fortune 500 HQ in CT)
| Industry | F500 HQs | Revenue |
|---|---|---|
| Industrial Machinery | 4 | $38B |
|
||
| Insurance | 3 | $71B |
|
||
| Financial Services | 2 | $25B |
|
||
| Transportation / Logistics | 2 | $18B |
|
||
| Healthcare | 1 | $247B |
|
||
| Telecommunications | 1 | $55B |
|
||
Price history
1 event — show timeline
- 2026-06-14 Coming Soon $225,000 Smart MLS
Property tax history
+4.2%/yrLatest (2023): $3,030 · +58.1% YoY. Source: county tax records.
Cash-flow waterfall
monthlySold comps — $/sqft
last 12 mo · ≤1 miLoading sold comps…