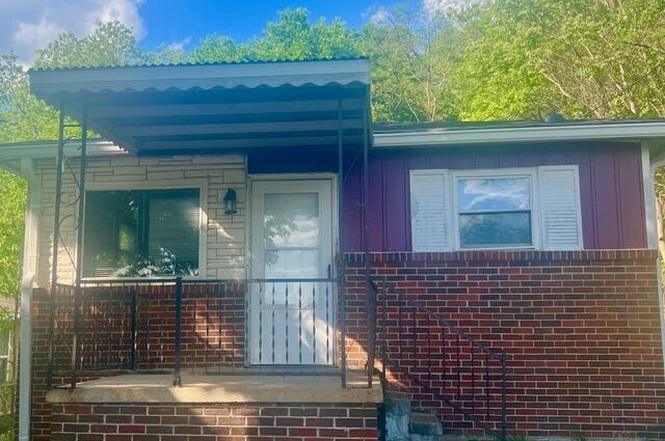
3619 Rogers Rd · Chattanooga, TN
Flood risk 1/10 · Minimal
- FEMA flood zone
- X (unshaded)
- Chance of flooding over 30 yrs
- 0.0%
- Est. flood insurance / yr
- $507 – $1,088
Fire risk 1/10 · Minimal
- Est. fire insurance / yr
- $949 – $1,763
Heat risk 6/10 · Moderate
- Hot days now (above 105°F)
- 7 days/yr
- Hot days in 30 yrs
- 18 days/yr
Wind risk 4/10 · Minor
- Chance of severe wind over 30 yrs
- 11.0%
Air-quality risk 3/10 · Minor
- Unhealthy air days now
- 2 days/yr
- Unhealthy air days in 30 yrs
- 2 days/yr
Risk factors via First Street. Map © Google.
Why this score? — see what drove the C grade
The composite is a weighted blend of 9 inputs, each scored 0–100. Each bar is that input's sub-score; the figure is the points it added to the 100-point composite (weight × sub-score).
- Cash flow +21.9/30.0
- ARV discount +14.7/15.0
- DSCR +7.0/10.0
- 1% rule +4.4/10.0
- Livability +3.9/5.0
- Rent growth +2.7/5.0
- Schools +2.7/10.0
- Condition / age +2.5/5.0
- Appreciation +0.0/10.0
$149,000
🖨 Deal sheet 📄 Offer letter ✓ Due diligence
Listing remarks
Lots of potential in this 3 br, 1 & 1/2 bath home. Level Yard , close to bus line, convenient to interstate, schools, and shopping. Ranch style home with original hardwood floors. Great investment property. Property is being sold as is.
Key facts
- Level yard
- Close to bus line
- 5,850 sq ft lot
Tags
Property features AI
Exterior
- Parking: Off-street parking
- Utilities: Public water; Public sewer; Electricity connected; Water connected; Sewer connected
- Home design: Single-family house; One story; Vinyl siding; Block foundation; Shingle roof; Residential property
- Construction: Vinyl siding construction; Block foundation; Built with a shingle roof
- Exterior features: Level lot; Paved public road access
Interior
- Kitchen: Refrigerator; Free-standing electric range; Free-standing electric oven
- Bedrooms: Master on main level
- Flooring: Hardwood floors
- Bathrooms: 1 full bathroom; 1 half bathroom
- Heating & cooling: Central heating; Central air conditioning
- Interior features: Eat-in kitchen; Master bedroom on the main level
Neighborhood map
What this means for you Summary
Snapshot
- This is a 3-bed/1.5-bath single-family listed at $149k.
Deal economics
- At list price, monthly cash flow is $233 ($3k/yr) — positive.
- The deal already cash-flows at list — no discount required.
- To meet the 1% rule (rent ≥ 1% of price), the offer needs to be $140k (6.2% below list).
- Recommended offer: $140k (6.2% below list) — sets the bar for 1% rule.
- Cap rate 8.2% vs local median 3.4% in Chattanooga — top-decile yield for the area; either an underpriced asset or a hidden risk that comps aren't pricing in. Stress-test before assuming the spread holds.
Location & tenants
- Location reads 78/100 on livability (#3 in TN, #2,582 nationally) — a middle-class / working-renter tenant base. Strengths: amenities A+, commute A+, cost of living A+; Watch: employment D+, crime F.
- Hamilton County (urban): math 31% / reading 31% proficiency, ranked #42 of 139 in TN (top 30%) — families likely to look elsewhere, expect single-tenant / working-renter base with shorter leases.
- Zoned schools: Woodmore Elementary (math 22% / reading 17%, grade F, #654 of 952 statewide, top 72%, 301 students, 0% FRL); Dalewood Middle School (math 7% / reading 7%, grade F, #278 of 333 statewide, top 85%, 258 students, 0% FRL); Brainerd High School (math 2% / reading 12%, grade F, #294 of 332 statewide, top 91%, 635 students, 0% FRL) — zoned schools average 0% FRL vs 52% district-wide (52 pts lower); this property's tenant base skews higher-income than the district average.
- Zoned-school proficiency averages 11% at this address vs 31% district-wide (-20 pts) — the specific schools serving this property underperform the Hamilton County average; the district grade overstates school quality for this exact location.
- Market conditions: Rents flat; 127 active listings in the ZIP; 19 comparable units currently listed for rent nearby; rentals at typical pace (median 24d on market — plan ~3-4 weeks tenant-placement turnaround); 2,133 units permitted in Hamilton County in 2024 (405 in 5+ unit buildings).
Forward outlook
- Local home prices are declining (-3.0%/yr); year-one equity from $1k of loan paydown is wiped out by about $4k of value loss. Plan a longer hold.
- Hamilton County population projected at +23% by 2050 — long-run rental-demand tailwind backs the buy-and-hold thesis.
Negotiation context
- It's been on market 23 days — a 2% lower offer ($147k) is reasonable based on typical stale-listing flexibility.
- 4 sale attempts; this cycle's ask is 16% above the opening price — seller raised mid-cycle; expect resistance to lowballs.
Risks & watch-outs
- Watch-outs: built in 1940 — expect roof / HVAC / electrical / plumbing capex.
- Climate carrying-cost: extreme-heat days projected 7→18/yr by 2055 (HVAC capex compounding) — expect insurance premiums to compound above CPI over the hold.
Questions for the listing agent
- Built in 1940 — when were the roof, HVAC, electrical panel, plumbing, and water heater last replaced?
- Is there a deadline driving the sale (1031 exchange, divorce, estate, relocation)? That informs how much negotiation room exists.
- Schools are F-rated, which usually means shorter tenancies and higher turnover. Who's the typical renter profile here, and what's been the actual vacancy rate?
- Crime grade is F in this area — have there been break-ins, vandalism, or insurance claims at this property in the last 3 years? What carrier currently insures it and at what premium?
- What's the average days-on-market for RENTAL listings here right now (not sales)? A rising rental-DOM trend means longer vacancies and softer asking-rent achievability than the comps imply.
- What's the recent tenant-quality profile in this submarket — average credit score on applications, eviction rate, late-payment / NSF rate, and stable-employment percentage? A property-management company in the area should have these aggregated.
- How much new for-sale + rental construction is in the pipeline within 1–3 miles? Heavy new supply typically softens prices + rents 12–24 months out; constrained supply supports both.
Investment metrics
- 1% rule
- 0.94% ✗
- Cap rate
- 8.17%
- Cash-on-cash
- 6.71%
- DSCR
- 1.30
- GRM
- 8.9
CMA / ARV
- ARV (on-the-fly)
- $177,210
- Comps found
- 4
Show comp detail 4 sales within ~0.75 mi
| Address | Dist | Beds/Ba | Sqft | Sold | Price | $/sf | Match |
|---|---|---|---|---|---|---|---|
| 220 Tunnel Blvd | 0.31mi | 3/1.0 | 1,098 (+11%) | 9mo | $175,000 | $159 | 58 |
| 822 Sylvan Dr | 0.62mi | 3/1.0 | 960 (-3%) | 23mo | $171,745 | $179 | 45 |
| 716 Larkin Ave | 0.58mi | 2/1.0 (-1) | 1,112 (+12%) | 11mo | $214,000 | $192 | 36 |
| 607 Over St | 0.70mi | 2/1.0 (-1) | 876 (-12%) | 22mo | $79,000 | $90 | 23 |
Match score weights: distance 35% · size 25% · config 20% · recency 20%. Top-matched comps best support the ARV.
Projected returns pro-forma
-3.0% appreciation · 0.73% rent growth · sell at horizon
- IRR
- -8.3%
- Equity multiple
- 0.70×
- Total profit
- $-12,486
- Equity at exit
- $22,216
- IRR
- -1.7%
- Equity multiple
- 0.90×
- Total profit
- $-4,289
- Equity at exit
- $12,883
Cash invested: $41,720 (down + closing). Projections, not guarantees.
Landlord ↔ Tenant lean methodology
- Overall (STATE)
- 87 Strongly Landlord-Friendly
- State Tennessee
- 87 Strongly Landlord-Friendly · R+13
- County
- — inherits STATE
- City
- — inherits STATE
ZIP-level market 37411
- Rents YoY
- 0.7%
- Active inventory
- 127
- Price-to-rent
- 8.9×
Monthly cashflow live
- Estimated rent
- $1,397 high interval (Pro) →
- Mortgage (P&I)
- −$781
- Tax from tax record
- −$27 /mo · $323/yr
- Insurance
- −$62
- HOA
- −$0
- Vacancy / Maint / Mgmt
- −$293
- Net cashflow
- $233
Break-even live
UW: 25.0% down · 7.5% · 30yr · 1.5% tax · 5.0% vac · 8.0% maint · 8.0% mgmt
Financing live
Cash to close
- Down payment
- $37,250
- Closing costs
- $4,470
- Reserves months
- —
- Total cash needed
- —
Loan-product check · same deal, 3 products live
Conventional
25% down · 7.5% · 30yr
- Down + closing
- —
- Monthly P&I
- —
- Monthly cashflow
- —
- DSCR
- —
- Eligible?
- —
Personal DTI + credit; lowest rate.
DSCR
20% down · 8.5% · 30yr
- Down + closing
- —
- Monthly P&I
- —
- Monthly cashflow
- —
- DSCR
- —
- Eligible?
- —
No personal income docs; deal must DSCR.
Hard money
10% down · 12.0% · 12mo
- Down + closing
- —
- Monthly P&I
- —
- Monthly cashflow
- —
- DSCR
- —
- Eligible?
- —
Short-term bridge; refi at stabilization.
Rent comps 19 comps
| Address | Beds | Baths | Sqft | Rent | $/sqft | DOM | Units | Dist |
|---|---|---|---|---|---|---|---|---|
| 619 Shannon Ave Chattanooga, TN | 2.0 | 1.0 | 962 | $1,250 | $1.30 | 23d | 1 | 0.29mi |
| 719 Belle Vista Ave Chattanooga, TN | 3.0 | 1.0 | 840 | $1,299 | $1.55 | 21d | 1 | 0.38mi |
| 822 Gillespie Rd Chattanooga, TN | 2.0 | 1.0 | 1000 | $1,550 | $1.55 | 13d | 1 | 0.44mi |
| 30 Woodlawn Dr Unit C Chattanooga, TN | 2.0 | 2.0 | 1000 | $1,200 | $1.20 | 23d | 1 | 0.56mi |
| 3916 Blanchard St Chattanooga, TN | 3.0 | 2.0 | 1056 | $1,445 | $1.37 | 23d | 1 | 0.61mi |
| 3301 Pinewood Ave Chattanooga, TN | 2.0 | 1.0 | 900 | $1,094 | $1.22 | 23d | 3 | 0.64mi |
| 925 Shallowford Rd Chattanooga, TN | 1.0–2.0 | 1.0 | 720 | $950 | $1.32 | 23d | 3 | 0.67mi |
| 3621 Monte Vista Dr Chattanooga, TN | 2.0 | 1.0 | 725 | $1,200 | $1.66 | 23d | 1 | 0.72mi |
| 708 Henderson Dr Chattanooga, TN | 3.0 | 1.0 | 1100 | $1,250 | $1.14 | 13d | 1 | 0.82mi |
| 506 Sequoia Dr Unit 506 Chattanooga, TN | 3.0 | 2.0 | 945 | $1,400 | $1.48 | 23d | 1 | 0.86mi |
| 1205 Tunnel Blvd Chattanooga, TN | 3.0 | 1.0 | 1044 | $1,350 | $1.29 | 23d | 1 | 0.89mi |
| 1203 Rockway Dr Unit 2 Chattanooga, TN | 2.0 | 1.0 | 940 | $1,250 | $1.33 | 13d | 1 | 0.95mi |
| 3632 Idlewild Cir Chattanooga, TN | 2.0 | 1.5 | 850 | $1,150 | $1.35 | 23d | 1 | 1.04mi |
| 1010 N Larchmont Dr Unit B Chattanooga, TN | 2.0 | 1.0 | 900 | $1,200 | $1.33 | 13d | 1 | 1.12mi |
| 405 Donaldson Rd Unit B Chattanooga, TN | 2.0 | 2.0 | 936 | $1,400 | $1.50 | 23d | 1 | 1.15mi |
| 700 N Moore Rd Chattanooga, TN | 2.0 | 1.0 | 800 | $1,399 | $1.75 | 13d | 1 | 1.16mi |
| 2709 Citico Ave Chattanooga, TN | 2.0–3.0 | 1.0 | 1038 | $1,400 | $1.35 | 23d | 1 | 1.20mi |
| 1635 Dogwood Dr Chattanooga, TN | 3.0 | 1.0 | 1024 | $1,600 | $1.56 | 13d | 1 | 1.29mi |
| 5019 Greenview Dr Chattanooga, TN | 2.0 | 1.0 | 768 | $1,200 | $1.56 | 21d | 1 | 1.36mi |
Listing history 9 events
-
2026-05-06status Pending
-
2026-04-26status Active
-
2026-04-23status Pending
-
2026-04-20status Active
-
2026-04-20price $149,000
-
2026-03-10status Active
-
2026-03-02status Pending
-
2026-02-20$129,000 Active
-
2013-07-15soldstatus $3,727,608
ⓘ Source: listings_history table (triggers on properties + properties_extension) + one-shot
backfill from property_details.listing_events for pre-trigger history.
Tax reassessment forecast TN · Resets to sale price
- Current annual tax
- $323 · $27/mo
- Projected year-2 tax
- $1,058 · $88/mo
- Expected delta
- +$735/yr (+$61/mo · 227.3%)
ⓘ Screening estimate from a state-policy table — verify with the county assessor before closing.
Climate risk First Street
- Flood 1/10 Low FEMA zone X (unshaded) · 0% chance over 30 yrs
- Wildfire 1/10 Low
- Heat 6/10 Major 7 d/yr ≥105°F today · 18 d/yr by 30 yrs out
- Wind 4/10 Moderate 11% chance of damaging wind over 30 yrs
- Air quality 3/10 Moderate 2 unhealthy d/yr today · 2 by 30 yrs out
Nearby sold comps map
Loading sold comps map…
Walkable amenities ~0.75 mi
Loading nearby amenities…
Taxation est. · year 1
- Rental income
- $16,764
- − Mortgage interest
- −$8,346
- − Property taxes
- −$323
- − Insurance
- −$745
- − Repairs & maintenance
- −$1,341
- − Management
- −$1,341
- − Depreciation
- −$4,335
- Taxable income
- $333
- Est. tax owed @ 24.0%
- −$80
- After-tax cash flow
- $2,719/yr
For passive investors: Depreciation is non-cash, so a rental often shows a tax loss while cash-flowing — sheltering income. Rental losses are passive: they offset passive income freely, and up to $25,000/yr can offset ordinary (W-2) income if you actively participate and your MAGI is under $100k (phasing out to $0 by $150k); unused losses carry forward. On sale, claimed depreciation is recaptured at up to 25%, and gains may owe capital-gains tax (a 1031 exchange can defer both). Figures are a year-1 estimate at your 24.0% rate — not tax advice; consult a CPA.
Schools (NCES district)
- District
- Hamilton County
- NCES district ID
- 4701590
- Math proficiency
- 31% ▼ -10.00%
- Reading proficiency
- 31% ▼ -3.00%
- Median HH income
- $47,456
- Composite
- 26.8/100
- National rank
- #7122
- State rank
- #42 of 139 in TN
Livability — Chattanooga
- Score
- 78/100
- State rank
- #3
- US rank
- #2582
Category grades
Schools grade is shown separately in the Schools card above.
Census & demographics
- Census place
- Chattanooga, TN
- County
- Hamilton County · 312,777 people
- City population
- 131,999
- Metro
- Chattanooga, TN-GA
- Population (ZIP)
- 18,997
- Household income
- $56,579
- Rent vs Own
- Severe rent burden
- 685.0
Population outlook (Hamilton County) Hauer SSP2
- Today (2025)
- 393,784 people
- By 2030
- 412,983 · +4.9%
- By 2040
- 449,502 · +14.1%
- By 2050
- 484,341 · +23.0%
- By 2075
- 565,746 · +43.7%
- By 2100
- 618,394 · +57.0%
Race, ethnicity, and origin ACS 2023
- Neighborhood character
- Diverse neighborhood (Simpson 0.63)
- Race & ethnicity
- Black 48% White 37% Hispanic / Latino 8% Two or more races 7%
- Hispanic origin (detail)
- Mexican 3% Puerto Rican 2%
- Common ancestry
- Italian 2% Slovak 2% Romanian 1%
- Foreign-born
- 4% · Canada, Vietnam
- Languages at home
- 92% English-only · Spanish 6% Arabic 0%
Political lean MEDSL · Hamilton
- 2024 margin
- R (+13.1) · D 42.7% · R 55.7% · Other 1.6%
- 2008→2024 swing
- -1.2pp toward R · 2008: -11.8pp · 2024: -13.1pp
- All cycles
- 2024: R+13.1 2020: R+9.7 2016: R+16.6 2012: R+14.8 2008: R+11.8
Not yet ingested
- Civics
- —
Market trends
- HPI YoY
- ▼ -190.85%
- Current HPI
- 240.2557
- Rent YoY
- ▲ 0.73%
- Metro
- Chattanooga, TN-GA
- State GDP YoY
- ▲ 2.78%
- F500 in state
- 22
Industry mix (Fortune 500 HQ in TN)
| Industry | F500 HQs | Revenue |
|---|---|---|
| Healthcare | 3 | $91B |
|
||
| Retail | 3 | $72B |
|
||
| Transportation / Logistics | 1 | $88B |
|
||
| Paper / Packaging | 1 | $19B |
|
||
| Insurance | 1 | $13B |
|
||
| Energy | 1 | $12B |
|
||
Price history
-96.0% since first listed9 events — show timeline
- 2026-05-06 Pending — GCAR
- 2026-04-26 Relisted — GCAR
- 2026-04-23 Pending — GCAR
- 2026-04-20 Relisted — GCAR
- 2026-04-20 Price Changed $149,000 GCAR
- 2026-03-10 Relisted — GCAR
- 2026-03-02 Pending — GCAR
- 2026-02-20 Listed $129,000 GCAR
- 2013-07-15 Sold (Public Records) $3,727,608 Public Records
Property tax history
+1.2%/yrLatest (2025): $323 · +8.4% YoY. Source: county tax records.
Cash-flow waterfall
monthlySold comps — $/sqft
last 12 mo · ≤1 miLoading sold comps…