4604 Woodpecker Rd · Seaford, DE
Flood risk 1/10 · Minimal
- FEMA flood zone
- X (unshaded)
- Chance of flooding over 30 yrs
- 0.0%
- Est. flood insurance / yr
- $473 – $860
Fire risk 2/10 · Minimal
- Est. fire insurance / yr
- $476 – $884
Heat risk 8/10 · Major
- Hot days now (above 105°F)
- 7 days/yr
- Hot days in 30 yrs
- 16 days/yr
Wind risk 6/10 · Moderate
- Chance of severe wind over 30 yrs
- 75.0%
Air-quality risk 3/10 · Minor
- Unhealthy air days now
- 2 days/yr
- Unhealthy air days in 30 yrs
- 3 days/yr
Risk factors via First Street. Map © Google.
Why this score? — see what drove the D+ grade
The composite is a weighted blend of 9 inputs, each scored 0–100. Each bar is that input's sub-score; the figure is the points it added to the 100-point composite (weight × sub-score).
- ARV discount +15.0/15.0
- Cash flow +14.3/30.0
- DSCR +4.4/10.0
- Livability +3.2/5.0
- 1% rule +2.9/10.0
- Schools +2.8/10.0
- Rent growth +2.5/5.0
- Condition / age +1.0/5.0
- Appreciation +0.0/10.0
$224,999
🖨 Deal sheet (PDF) 📄 Offer letter ✓ Due diligence
Listing remarks
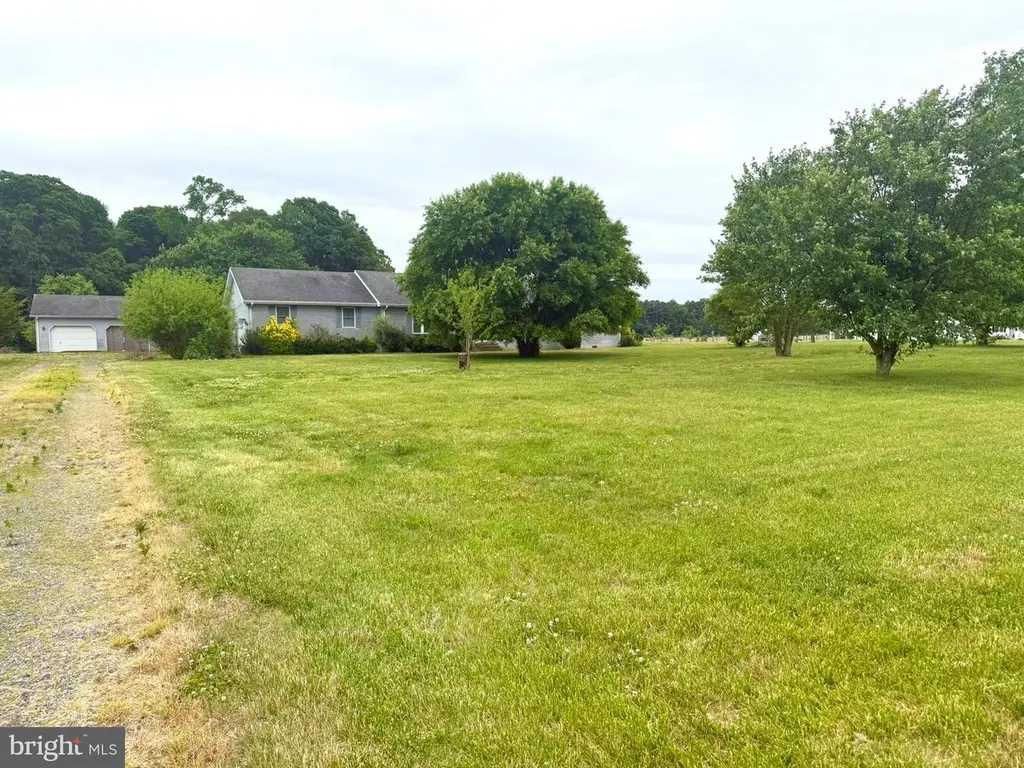
BEST AND FINALS DUE MAY 22ND AT MIDNIGHT!!! Investor Opportunity – Fix & Flip Potential Single-story 4 bed, 2 bath rancher offering 1,624 sq ft of one-level living in a quiet, country setting. Property includes a 1-car attached garage plus an oversized 2-car detached garage lot is approximately 3.67 acres. Adjacent lot was originally all one until it was parceled off and sold. HVAC and water heater replaced within the last 5 years. Interior requires a full renovation throughout. Layout is straightforward and well-suited for an efficient rehab. Septic report attached showing minor repairs only, estimated $1,500–$3,000 Strong resale fundamentals with one-floor living, multi
Key facts
- Large-lot potential
- Multiple garages
- One-level living
Tags
Property features AI
Exterior
- Parking: Attached 1-car garage (front and side entry options noted); Detached 2-car garage (oversized); Total of 3 garage spaces; Driveway with about 18 spaces; Off-street parking for about 4 vehicles; Multiple parking options with about 25 total parking spaces
- Utilities: Well water; Septic system (septic exists); No municipal trash service
- Home design: Detached single-story home; Crawl space foundation; Property is outside city limits and in a rural location
- Construction: Frame construction with aluminum siding; Building is not winterized
- Exterior features: Backs to trees with wooded rear yard; Adjoins open space; Front yard; Second detached garage on the property
Interior
- Bedrooms: Four bedrooms on the main level
- Bathrooms: Two full bathrooms (both on the main level)
- Heating & cooling: Central heating and electric baseboard; Electric hot water; Central air conditioning (electric)
- Interior features: Water heater included; Not furnished; Two or more access exits
Neighborhood map
What this means for you Summary
Snapshot
- This is a 3-bed/2.0-bath single-family listed at $225k. Condition is rated poor.
Deal economics
- At list price, monthly cash flow is $42 ($500/yr) — positive.
- The deal already cash-flows at list — no discount required.
- To meet the 1% rule (rent ≥ 1% of price), the offer needs to be $177k (21.2% below list).
- Recommended offer: $177k (21.2% below list) — sets the bar for 1% rule.
- Cap rate 6.5% vs local median 4.3% in Seaford — top-decile yield for the area; either an underpriced asset or a hidden risk that comps aren't pricing in. Stress-test before assuming the spread holds.
Location & tenants
- Location reads 64/100 on livability (#54 in DE) — a middle-class / working-renter tenant base. Strengths: cost of living A+, housing A+, health & safety A+; Watch: employment D, crime F, amenities F.
- Seaford School District (suburban): math 25% / reading 40% proficiency, ranked #15 of 26 in DE (top 58%) — families likely to look elsewhere, expect single-tenant / working-renter base with shorter leases; 65% free/reduced lunch — lower-income household profile, screen leases tightly.
- Zoned schools: Seaford Central Elementary School (math 36% / reading 45%, grade F, #25 of 105 statewide, top 26%, 452 students, 0% FRL); Seaford Middle School (math 13% / reading 36%, grade F, #24 of 36 statewide, top 69%, 828 students, 0% FRL); Seaford Senior High School (math 12% / reading 27%, grade F, #32 of 40 statewide, top 85%, 879 students, 0% FRL) — zoned schools average 0% FRL vs 65% district-wide (65 pts lower); this property's tenant base skews higher-income than the district average.
- Market conditions: 216 active listings in the ZIP; 4,354 units permitted in Sussex County in 2024 (344 in 5+ unit buildings).
Forward outlook
- Local home prices are declining (-3.0%/yr); year-one equity from $2k of loan paydown is wiped out by about $7k of value loss. Plan a longer hold.
- Sussex County population projected at +25% by 2050 — long-run rental-demand tailwind backs the buy-and-hold thesis.
Negotiation context
- Only 2 days on market — expect competitive offers; lowballing is unlikely to land.
Risks & watch-outs
- Climate carrying-cost: major wind risk, 75% chance of damaging wind over 30y; extreme-heat days projected 7→16/yr by 2055 (HVAC capex compounding) — expect insurance premiums to compound above CPI over the hold.
Questions for the listing agent
- Have any recent inspections been done? Can we get a copy of the seller's disclosures and any deferred-maintenance estimates?
- Is there a deadline driving the sale (1031 exchange, divorce, estate, relocation)? That informs how much negotiation room exists.
- Crime grade is F in this area — have there been break-ins, vandalism, or insurance claims at this property in the last 3 years? What carrier currently insures it and at what premium?
- The area grade is low — what's the realistic commute time and amenity access for the typical tenant pool here? Any planned neighborhood developments (good or bad) we should know about?
- What's the average days-on-market for RENTAL listings here right now (not sales)? A rising rental-DOM trend means longer vacancies and softer asking-rent achievability than the comps imply.
- What's the recent tenant-quality profile in this submarket — average credit score on applications, eviction rate, late-payment / NSF rate, and stable-employment percentage? A property-management company in the area should have these aggregated.
- How much new for-sale + rental construction is in the pipeline within 1–3 miles? Heavy new supply typically softens prices + rents 12–24 months out; constrained supply supports both.
Investment metrics
- 1% rule
- 0.79% ✗
- Cap rate
- 6.52%
- Cash-on-cash
- 0.79%
- DSCR
- 1.04
- GRM
- 10.6
CMA / ARV
- ARV (on-the-fly)
- $445,280
- Comps found
- 4
Show comp detail 4 sales within ~0.75 mi
| Address | Dist | Beds/Ba | Sqft | Sold | Price | $/sf | Match |
|---|---|---|---|---|---|---|---|
| 25672 Brookside Dr | 0.75mi | 3/2.5 | 1,922 (-1%) | 1mo | $384,000 | $200 | 61 |
| 25648 Green Briar Rd | 0.68mi | 3/2.5 | 1,900 (-2%) | 7mo | $395,000 | $208 | 58 |
| 20 Woodland Dr | 0.60mi | 3/2.0 | 2,100 (+8%) | 14mo | $515,000 | $245 | 46 |
| 25601 Brookside Dr | 0.57mi | 3/2.0 | 1,672 (-14%) | 6mo | $385,000 | $230 | 45 |
Match score weights: distance 35% · size 25% · config 20% · recency 20%. Top-matched comps best support the ARV.
Projected returns pro-forma
-3.0% appreciation · 3.0% rent growth · sell at horizon
- IRR
- -15.1%
- Equity multiple
- 0.46×
- Total profit
- $-33,898
- Equity at exit
- $33,548
- IRR
- -6.6%
- Equity multiple
- 0.58×
- Total profit
- $-26,477
- Equity at exit
- $19,454
Cash invested: $63,000 (down + closing). Projections, not guarantees.
Landlord ↔ Tenant lean methodology
- Overall (STATE)
- 70 Landlord-Friendly
- State Delaware
- 70 Landlord-Friendly · D+7
- County
- — inherits STATE
- City
- — inherits STATE
ZIP-level market 19973
- Home prices YoY
- -17.8%
- Active inventory
- 216
- Price-to-rent
- 10.6×
Monthly cashflow live
- Estimated rent
- $1,774 medium interval (Pro) →
- Mortgage (P&I)
- −$1,180
- Tax from tax record
- −$86 /mo · $1,031/yr
- Insurance
- −$94
- HOA
- −$0
- Vacancy / Maint / Mgmt
- −$372
- Net cashflow
- $42
Break-even live
Sensitivity live
| Price | -10% $169 | -5% $105 | +0% $42 | +5% $-22 | +10% $-86 |
|---|---|---|---|---|---|
| Rent | -10% $-98 | -5% $-28 | +0% $42 | +5% $112 | +10% $182 |
| Rate | -1.0pp $155 | -0.5pp $99 | base $42 | +0.5pp $-17 | +1.0pp $-76 |
UW: 25.0% down · 7.5% · 30yr · 1.5% tax · 5.0% vac · 8.0% maint · 8.0% mgmt
Financing live
Cash to close
- Down payment
- $56,250
- Closing costs
- $6,750
- Reserves months
- —
- Total cash needed
- —
Loan-product check · same deal, 3 products live
Conventional
25% down · 7.5% · 30yr
- Down + closing
- —
- Monthly P&I
- —
- Monthly cashflow
- —
- DSCR
- —
- Eligible?
- —
Personal DTI + credit; lowest rate.
DSCR
20% down · 8.5% · 30yr
- Down + closing
- —
- Monthly P&I
- —
- Monthly cashflow
- —
- DSCR
- —
- Eligible?
- —
No personal income docs; deal must DSCR.
Hard money
10% down · 12.0% · 12mo
- Down + closing
- —
- Monthly P&I
- —
- Monthly cashflow
- —
- DSCR
- —
- Eligible?
- —
Short-term bridge; refi at stabilization.
Listing history 1 events
-
2026-05-21$224,999 Active
ⓘ Source: listings_history table (triggers on properties + properties_extension) + one-shot
backfill from property_details.listing_events for pre-trigger history.
Tax reassessment forecast DE · Partial reset (capped growth)
- Current annual tax
- $1,031 · $86/mo
- Projected year-2 tax
- $1,168 · $97/mo
- Expected delta
- +$137/yr (+$11/mo · 13.3%)
ⓘ Screening estimate from a state-policy table — verify with the county assessor before closing.
Climate risk First Street
- Flood 1/10 Low FEMA zone X (unshaded) · 0% chance over 30 yrs
- Wildfire 2/10 Low
- Heat 8/10 Severe 7 d/yr ≥105°F today · 16 d/yr by 30 yrs out
- Wind 6/10 Major 75% chance of damaging wind over 30 yrs
- Air quality 3/10 Moderate 2 unhealthy d/yr today · 3 by 30 yrs out
Nearby sold comps map
Loading sold comps map…
Walkable amenities ~0.75 mi
Loading nearby amenities…
Taxation est. · year 1
- Rental income
- $21,285
- − Mortgage interest
- −$12,603
- − Property taxes
- −$1,031
- − Insurance
- −$1,125
- − Repairs & maintenance
- −$1,703
- − Management
- −$1,703
- − Depreciation
- −$6,545
- Taxable loss
- −$3,425
- Est. tax savings @ 24.0%
- +$822
- After-tax cash flow
- $1,322/yr
For passive investors: Depreciation is non-cash, so a rental often shows a tax loss while cash-flowing — sheltering income. Rental losses are passive: they offset passive income freely, and up to $25,000/yr can offset ordinary (W-2) income if you actively participate and your MAGI is under $100k (phasing out to $0 by $150k); unused losses carry forward. On sale, claimed depreciation is recaptured at up to 25%, and gains may owe capital-gains tax (a 1031 exchange can defer both). Figures are a year-1 estimate at your 24.0% rate — not tax advice; consult a CPA.
Condition & rehab AI · 1 photo
This single-story rancher requires extensive renovation and landscaping to become move-in ready. Immediate focus should be on improving the exterior and interior spaces to increase its resale and rental value.
Repairs flagged
- Major Landscaping — Overgrown grass and weeds
- Major Exterior — Overgrown grass and weeds
- Major Interior — No interior photos provided
Value-add opportunities
- Both Landscaping and exterior improvements — Enhances curb appeal and property value
- Both Interior renovation — Improves living space and functionality
- Both Kitchen and bathroom updates — Modernizes the home and increases appeal
Renovation cost estimate screening
| Repair item | Severity | Est. cost |
|---|---|---|
| Landscaping · Overgrown grass and weeds | Major | $15,000–50,000 |
| Exterior · Overgrown grass and weeds | Major | $15,000–50,000 |
| Interior · No interior photos provided | Major | $15,000–50,000 |
| Total estimated repair cost · 3 items | $45,000–150,000 |
Value-add ROI direction
- Both Landscaping and exterior improvements — Enhances curb appeal and property value ↑
- Both Interior renovation — Improves living space and functionality ↑
- Both Kitchen and bathroom updates — Modernizes the home and increases appeal ↑
ⓘ Cost ranges are severity-bucket heuristics (US national rule-of-thumb). Get contractor quotes + a written scope before underwriting a rehab budget.
Schools (NCES district)
- District
- Seaford School District
- NCES district ID
- 1001530
- Math proficiency
- 25% ▼ -18.00%
- Reading proficiency
- 40% ▼ -12.00%
- Median HH income
- $48,427
- Composite
- 28.07/100
- National rank
- #6835
- State rank
- #15 of 26 in DE
Livability — Seaford
- Score
- 64/100
- State rank
- #54
- US rank
- #14448
Category grades
Schools grade is shown separately in the Schools card above.
Census & demographics
- Population (ZIP)
- 25,786
Population outlook (Sussex County) Hauer SSP2
- Today (2025)
- 248,853 people
- By 2030
- 264,464 · +6.3%
- By 2040
- 290,980 · +16.9%
- By 2050
- 311,259 · +25.1%
- By 2075
- 352,488 · +41.6%
- By 2100
- 367,406 · +47.6%
Race, ethnicity, and origin ACS 2023
- Neighborhood character
- Diverse neighborhood (Simpson 0.61)
- Race & ethnicity
- White 58% Black 20% Two or more races 13% Hispanic / Latino 11%
- Hispanic origin (detail)
- Mexican 5% Puerto Rican 1% Dominican 2%
- Common ancestry
- Hispanic 4% Romanian 3% Italian 2%
- Foreign-born
- 9% · Canada, Vietnam
- Languages at home
- 85% English-only · Spanish 8% French/Haitian/Cajun 5% Vietnamese 1%
Political lean MEDSL · Sussex
- 2024 margin
- R (+11.0) · D 43.9% · R 54.9% · Other 1.2%
- 2008→2024 swing
- -2.4pp toward R · 2008: -8.6pp · 2024: -11.0pp
- All cycles
- 2024: R+11.0 2020: R+11.2 2016: R+22.0 2012: R+13.0 2008: R+8.6
Not yet ingested
- Civics
- —
Market trends
- HPI YoY
- ▼ -62.40%
- Current HPI
- 288.5652
- Rent YoY
- —
- Metro
- —
- State GDP YoY
- —
- F500 in state
- 0
Price history
+14.1% since first listed3 events — show timeline
- 2026-06-05 Sold (MLS) $256,830 BRIGHT MLS
- 2026-05-23 Pending — BRIGHT MLS
- 2026-05-21 Listed $224,999 BRIGHT MLS
Property tax history
-13.2%/yrLatest (2025): $1,031 · -13.2% YoY. Source: county tax records.
Cash-flow waterfall
monthlySold comps — $/sqft
last 12 mo · ≤1 miLoading sold comps…