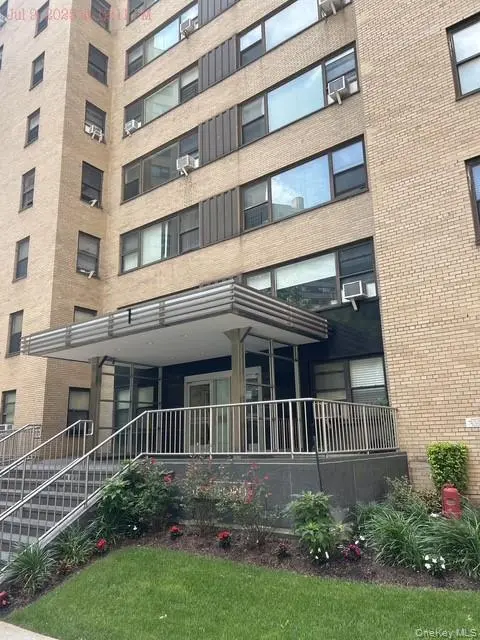
1 Fordham Hill Oval Unit 12D · New York, NY
Flood risk 1/10 · Minimal
- FEMA flood zone
- X (unshaded)
- Chance of flooding over 30 yrs
- 0.0%
- Est. flood insurance / yr
- $507 – $1,088
Fire risk 1/10 · Minimal
- Est. fire insurance / yr
- $691 – $1,283
Heat risk 6/10 · Moderate
- Hot days now (above 99°F)
- 7 days/yr
- Hot days in 30 yrs
- 14 days/yr
Wind risk 6/10 · Moderate
- Chance of severe wind over 30 yrs
- 27.0%
Air-quality risk 3/10 · Minor
- Unhealthy air days now
- 3 days/yr
- Unhealthy air days in 30 yrs
- 4 days/yr
Risk factors via First Street. Map © Google.
Why this score? — see what drove the D grade
The composite is a weighted blend of 9 inputs, each scored 0–100. Each bar is that input's sub-score; the figure is the points it added to the 100-point composite (weight × sub-score).
- 1% rule +10.0/10.0
- ARV discount +7.5/15.0
- Appreciation +5.3/10.0
- Schools +5.0/10.0
- Rent growth +4.2/5.0
- Condition / age +4.0/5.0
- Livability +3.8/5.0
- Cash flow +3.0/30.0
- DSCR +0.0/10.0
$135,000
🖨 Deal sheet 📄 Offer letter ✓ Due diligence
Listing remarks
Auction Property, Submit offers on , Auction. con . Fordham Hill Oval, a freshly renovated one-bedroom gem in the heart of The Bronx Welcome to 1 Fordham Hill Oval, a freshly renovated one-bedroom gem in the heart of The Bronx. This residence offers a blend of comfort, style, and convenience, creating an impeccable urban living experience. Genuine hardwood floors with an intricate herringbone A culinary haven, the kitchen is appointed with pristine white cabinetry offering ample storage. Coupled with the sleek countertops and subway tile backsplash. New appliances, including a gas stove and a stainless-steel sink with a professional faucet, make meal preparation both convenient and enjoy
Key facts
- Sleek countertops
- Freshly renovated
- Ample storage
Tags
Property features AI
Finance
- HOA & community: Association managed by First Service; Building amenities include a park and elevators; Association fees include gas, heat, hot water, sewer, and water
Exterior
- Parking: Off-street parking; No carport
- Utilities: Con Edison electric service; Public sewer; Private trash collection
- Home design: Stock cooperative; High-rise building with 17 total stories; Unit located on the 12th entry level; Not waterfront
- Construction: Brick and other construction materials; Other foundation details; Built (year not provided)
- Exterior features: Courtyard; Near public transit; Near shops; Near schools; Cul-de-sac
Interior
- Kitchen: Galley-style layout; Granite counters
- Bedrooms: Located on entry level 12
- Bathrooms: 1 full bathroom
- Heating & cooling: Oil heating; Radiant heat; No central cooling
- Interior features: Elevator; Galley-style kitchen; Granite counters; Dining area
- Laundry & utility: Common area laundry; Oil water heater
Neighborhood map
What this means for you Summary
Snapshot
- This is a 1-bed/1.0-bath condo listed at $135k. Condition is rated good.
Deal economics
- At list price, monthly cash flow is $-439 ($-5k/yr) — negative.
- The deal already cash-flows at list — no discount required.
- Meets the 1% rule at list price ($2k rent vs $135k).
- Recommended offer: $133k (1.5% below list) — sets the bar for market timing.
Location & tenants
- Location reads 75/100 on livability (#268 in NY, #4,188 nationally) — a middle-class / working-renter tenant base. Strengths: amenities A+, commute A+, health & safety A; Watch: crime F, cost of living F.
- Market conditions: Rents rising fast (+6.7%/yr); 122 active listings in the ZIP; 1 comparable units currently listed for rent nearby; 6,929 units permitted in Bronx County in 2024 (6,829 in 5+ unit buildings).
- At $2,150/mo this rent would consume 56% of the median local household income ($46k/yr) (locally 9659% of renters already pay >50% of income on rent) — very limited rent-growth headroom before tenants either downsize or default.
Forward outlook
- In year one you build about $2k of equity ($933 loan paydown + $680 appreciation (0.5% local appreciation)).
- Bronx County population projected at +21% by 2050 — long-run rental-demand tailwind backs the buy-and-hold thesis.
Negotiation context
- It's been on market 27 days — a 2% lower offer ($133k) is reasonable based on typical stale-listing flexibility.
- 8 sale attempts since 2y ago with the ask held roughly flat each time — persistent listings suggest the price (not the market) is what's stuck; bring a comps-based counter.
Risks & watch-outs
- Watch-outs: HOA is 56% of rent; built in 1950 — expect roof / HVAC / electrical / plumbing capex.
- Climate carrying-cost: major wind risk, 27% chance of damaging wind over 30y; extreme-heat days projected 7→14/yr by 2055 (HVAC capex compounding) — expect insurance premiums to compound above CPI over the hold.
Questions for the listing agent
- What do current leases actually rent for vs. the listed asking? Can we see a recent rent roll and the last 12 months of T-12 income?
- Built in 1950 — when were the roof, HVAC, electrical panel, plumbing, and water heater last replaced?
- What does the HOA fee cover, when was the last increase, and are there any pending special assessments or reserve-fund shortfalls?
- Any open or pending special assessments — roof, HVAC, plumbing, elevator, façade? What's the per-unit balance and payoff schedule, and is the seller paying it off at close or rolling it to the buyer?
- Is there a deadline driving the sale (1031 exchange, divorce, estate, relocation)? That informs how much negotiation room exists.
- Schools are B-rated — typically a magnet for longer-tenancy family renters. What's the average tenant stay here, and is there a school-zone premium baked into asking?
- Crime grade is F in this area — have there been break-ins, vandalism, or insurance claims at this property in the last 3 years? What carrier currently insures it and at what premium?
- The area grade is low — what's the realistic commute time and amenity access for the typical tenant pool here? Any planned neighborhood developments (good or bad) we should know about?
- What's the average days-on-market for RENTAL listings here right now (not sales)? A rising rental-DOM trend means longer vacancies and softer asking-rent achievability than the comps imply.
- What's the recent tenant-quality profile in this submarket — average credit score on applications, eviction rate, late-payment / NSF rate, and stable-employment percentage? A property-management company in the area should have these aggregated.
- How much new apartment / multifamily construction is in the pipeline within 1–3 miles? Heavy new supply (>2% of stock underway) typically softens rents 12–24 months out; light construction supports rent growth.
Investment metrics
- 1% rule
- 1.59% ✓
- Cap rate
- 2.39%
- Cash-on-cash
- -13.93%
- DSCR
- 0.38
- GRM
- 5.2
CMA / ARV
No comps found within radius.
Projected returns pro-forma
0.5% appreciation · 6.7% rent growth · sell at horizon
- IRR
- -10.2%
- Equity multiple
- 0.48×
- Total profit
- $-19,587
- Equity at exit
- $42,634
- IRR
- 1.6%
- Equity multiple
- 1.22×
- Total profit
- $8,302
- Equity at exit
- $54,076
Cash invested: $37,800 (down + closing). Projections, not guarantees.
Landlord ↔ Tenant lean methodology
- Overall (CITY)
- 0 Strongly Tenant-Friendly
- State New York
- 15 Strongly Tenant-Friendly · D+10
- County
- — inherits STATE
- City New York
- 0 Strongly Tenant-Friendly · D+34
ZIP-level market 10468
- Home prices YoY
- 0.2%
- Rents YoY
- 6.7%
- Active inventory
- 122
- Price-to-rent
- 5.2×
Monthly cashflow live
- Estimated rent
- $2,150 medium interval (Pro) →
- Mortgage (P&I)
- −$708
- Tax est. 1.5%
- −$169 /mo · $2,025/yr
- Insurance
- −$56
- HOA est. from 2 same-building comps
- −$1,204
- Vacancy / Maint / Mgmt
- −$451
- Net cashflow
- $-439
Break-even live
UW: 25.0% down · 7.5% · 30yr · 1.5% tax · 5.0% vac · 8.0% maint · 8.0% mgmt
Financing live
Cash to close
- Down payment
- $33,750
- Closing costs
- $4,050
- Reserves months
- —
- Total cash needed
- —
Loan-product check · same deal, 3 products live
Conventional
25% down · 7.5% · 30yr
- Down + closing
- —
- Monthly P&I
- —
- Monthly cashflow
- —
- DSCR
- —
- Eligible?
- —
Personal DTI + credit; lowest rate.
DSCR
20% down · 8.5% · 30yr
- Down + closing
- —
- Monthly P&I
- —
- Monthly cashflow
- —
- DSCR
- —
- Eligible?
- —
No personal income docs; deal must DSCR.
Hard money
10% down · 12.0% · 12mo
- Down + closing
- —
- Monthly P&I
- —
- Monthly cashflow
- —
- DSCR
- —
- Eligible?
- —
Short-term bridge; refi at stabilization.
Rent comps 1 comps
| Address | Beds | Baths | Sqft | Rent | $/sqft | DOM | Units | Dist |
|---|---|---|---|---|---|---|---|---|
| 2600 Netherland Ave Bronx, NY | 1.0–3.0 | 1.0–2.5 | 1132 | $2,775 | $2.45 | 22d | 3 | 1.08mi |
HOA detail condo
- Monthly dues
- $0 · $0/yr
- Likely covers
- gascable
- Assessments
- None detected in remarks — confirm with the listing agent.
Listing history 34 events
-
2026-06-18days on market $135,000 Active 27 DOM
-
2026-06-17days on market $135,000 Active 26 DOM
-
2026-06-16days on market $135,000 Active 25 DOM
-
2026-06-15days on market $135,000 Active 24 DOM
-
2026-06-13days on market $135,000 Active 22 DOM
-
2026-06-10days on market $135,000 Active 18 DOM
-
2026-06-08days on market $135,000 Active 17 DOM
-
2026-06-08days on market $135,000 Active 16 DOM
-
2026-06-04days on market $135,000 Active 13 DOM
-
2026-06-03days on market $135,000 Active 12 DOM
-
2026-06-02days on market $135,000 Active 11 DOM
-
2026-06-01days on market $135,000 Active 10 DOM
-
2026-05-31days on market $135,000 Active 9 DOM
-
2026-05-22$135,000 Active
-
2026-03-15historical
-
2026-01-28status Active
-
2026-01-24historical
-
2025-12-26status Active
-
2025-12-25historical
-
2025-12-15price $145,000
-
2025-12-02status Active
-
2025-08-26status Pending
-
2025-07-14status Active
-
2025-06-27historical
-
2025-03-19status Active
-
2025-02-28status Pending
-
2024-10-29status Active
-
2024-10-27historical
-
2024-10-11price $149,900
-
2024-09-13price $148,900
-
2024-08-16price $154,900
-
2024-07-15price $159,900
-
2024-06-17price $169,900
-
2024-05-18$179,900 Active
ⓘ Source: listings_history table (triggers on properties + properties_extension) + one-shot
backfill from property_details.listing_events for pre-trigger history.
Climate risk First Street
- Flood 1/10 Low FEMA zone X (unshaded) · 0% chance over 30 yrs
- Wildfire 1/10 Low
- Heat 6/10 Major 7 d/yr ≥99°F today · 14 d/yr by 30 yrs out
- Wind 6/10 Major 27% chance of damaging wind over 30 yrs
- Air quality 3/10 Moderate 3 unhealthy d/yr today · 4 by 30 yrs out
Nearby sold comps map
Loading sold comps map…
Walkable amenities ~0.75 mi
Loading nearby amenities…
Taxation est. · year 1
- Rental income
- $25,797
- − Mortgage interest
- −$7,562
- − Property taxes
- −$2,025
- − Insurance
- −$675
- − Repairs & maintenance
- −$2,064
- − Management
- −$2,064
- − HOA
- −$14,448
- − Depreciation
- −$3,927
- Taxable loss
- −$6,968
- Est. tax savings @ 24.0%
- +$1,672
- After-tax cash flow
- $-3,592/yr
For passive investors: Depreciation is non-cash, so a rental often shows a tax loss while cash-flowing — sheltering income. Rental losses are passive: they offset passive income freely, and up to $25,000/yr can offset ordinary (W-2) income if you actively participate and your MAGI is under $100k (phasing out to $0 by $150k); unused losses carry forward. On sale, claimed depreciation is recaptured at up to 25%, and gains may owe capital-gains tax (a 1031 exchange can defer both). Figures are a year-1 estimate at your 24.0% rate — not tax advice; consult a CPA.
Condition & rehab AI · 3 photos
This freshly renovated one-bedroom condo in Fordham Hill Oval is in excellent condition with no visible repairs needed. It offers a blend of comfort, style, and convenience, making it an impeccable urban living experience.
Value-add opportunities
- Both New flooring — Hardwood flooring enhances the aesthetic and value of the home.
- Both Painting — Fresh paint can make the home look more inviting and increase its value.
- Both Landscaping — Well-maintained landscaping can improve curb appeal and attract potential buyers/tenants.
Renovation cost estimate screening
Value-add ROI direction
- Both New flooring — Hardwood flooring enhances the aesthetic and value of the home. ↑
- Both Painting — Fresh paint can make the home look more inviting and increase its value. ↑
- Both Landscaping — Well-maintained landscaping can improve curb appeal and attract potential buyers/tenants. ↑
ⓘ Cost ranges are severity-bucket heuristics (US national rule-of-thumb). Get contractor quotes + a written scope before underwriting a rehab budget.
Schools (NCES district)
No district data.
Livability — New York
- Score
- 75/100
- State rank
- #268
- US rank
- #4188
Category grades
Schools grade is shown separately in the Schools card above.
Census & demographics
- Census place
- New York, NY
- County
- Bronx County · 1,197,324 people
- City population
- 7,731,280
- Metro
- New York-Newark-Jersey City, NY-NJ-PA
- Population (ZIP)
- 75,557
- Household income
- $46,233
- Rent vs Own
- Severe rent burden
- 9659.0
Population outlook (Bronx County) Hauer SSP2
- Today (2025)
- 1,607,353 people
- By 2030
- 1,681,852 · +4.6%
- By 2040
- 1,824,421 · +13.5%
- By 2050
- 1,945,470 · +21.0%
- By 2075
- 2,187,887 · +36.1%
- By 2100
- 2,244,136 · +39.6%
Race, ethnicity, and origin ACS 2023
- Neighborhood character
- Predominantly Hispanic (76%)
- Race & ethnicity
- Hispanic / Latino 76% Black 17% Two or more races 15% White 3% Asian 2% Native American 2%
- Hispanic origin (detail)
- Mexican 10% Puerto Rican 11% Dominican 45%
- Common ancestry
- Hispanic 1%
- Foreign-born
- 46% · Canada, Vietnam, Jamaica
- Languages at home
- 22% English-only · Spanish 69% French/Haitian/Cajun 1% Other Indo-European 1%
Political lean MEDSL · Bronx
- 2024 margin
- Solid D (+45.4) · D 72.7% · R 27.3%
- 2008→2024 swing
- -32.3pp toward R · 2008: 77.8pp · 2024: 45.4pp
- All cycles
- 2024: D+45.4 2020: D+67.6 2016: D+79.1 2012: D+82.9 2008: D+77.8
Not yet ingested
- Civics
- —
Market trends
- HPI YoY
- ▲ 0.50%
- Current HPI
- 249.8923
- Rent YoY
- ▲ 6.70%
- Metro
- New York-Newark-Jersey City, NY-NJ-PA
- State GDP YoY
- ▲ 2.60%
- F500 in state
- 92
Industry mix (Fortune 500 HQ in NY)
| Industry | F500 HQs | Revenue |
|---|---|---|
| Financial Services | 10 | $950B |
|
||
| Consumer Goods | 9 | $162B |
|
||
| Insurance | 4 | $225B |
|
||
| Telecommunications | 2 | $144B |
|
||
| Pharmaceuticals | 2 | $112B |
|
||
| Media / Entertainment | 2 | $69B |
|
||
Price history
-25.0% since first listed21 events — show timeline
- 2026-05-22 Listed $135,000 OneKey® MLS as Distributed by MLS Grid
- 2026-03-15 Listing Removed — OneKey® MLS as Distributed by MLS Grid
- 2026-01-28 Relisted — OneKey® MLS as Distributed by MLS Grid
- 2026-01-24 Listing Removed — OneKey® MLS as Distributed by MLS Grid
- 2025-12-26 Relisted — OneKey® MLS as Distributed by MLS Grid
- 2025-12-25 Listing Removed — OneKey® MLS as Distributed by MLS Grid
- 2025-12-15 Price Changed $145,000 OneKey® MLS as Distributed by MLS Grid
- 2025-12-02 Relisted — OneKey® MLS as Distributed by MLS Grid
- 2025-08-26 Pending — OneKey® MLS as Distributed by MLS Grid
- 2025-07-14 Relisted — OneKey® MLS as Distributed by MLS Grid
- 2025-06-27 Listing Removed — OneKey® MLS as Distributed by MLS Grid
- 2025-03-19 Relisted — OneKey® MLS as Distributed by MLS Grid
- 2025-02-28 Pending — OneKey® MLS as Distributed by MLS Grid
- 2024-10-29 Relisted — OneKey® MLS as Distributed by MLS Grid
- 2024-10-27 Listing Removed — OneKey® MLS as Distributed by MLS Grid
- 2024-10-11 Price Changed $149,900 OneKey® MLS as Distributed by MLS Grid
- 2024-09-13 Price Changed $148,900 OneKey® MLS as Distributed by MLS Grid
- 2024-08-16 Price Changed $154,900 OneKey® MLS as Distributed by MLS Grid
- 2024-07-15 Price Changed $159,900 OneKey® MLS as Distributed by MLS Grid
- 2024-06-17 Price Changed $169,900 OneKey® MLS as Distributed by MLS Grid
- 2024-05-18 Listed $179,900 OneKey® MLS as Distributed by MLS Grid
Cash-flow waterfall
monthlySold comps — $/sqft
last 12 mo · ≤1 miLoading sold comps…