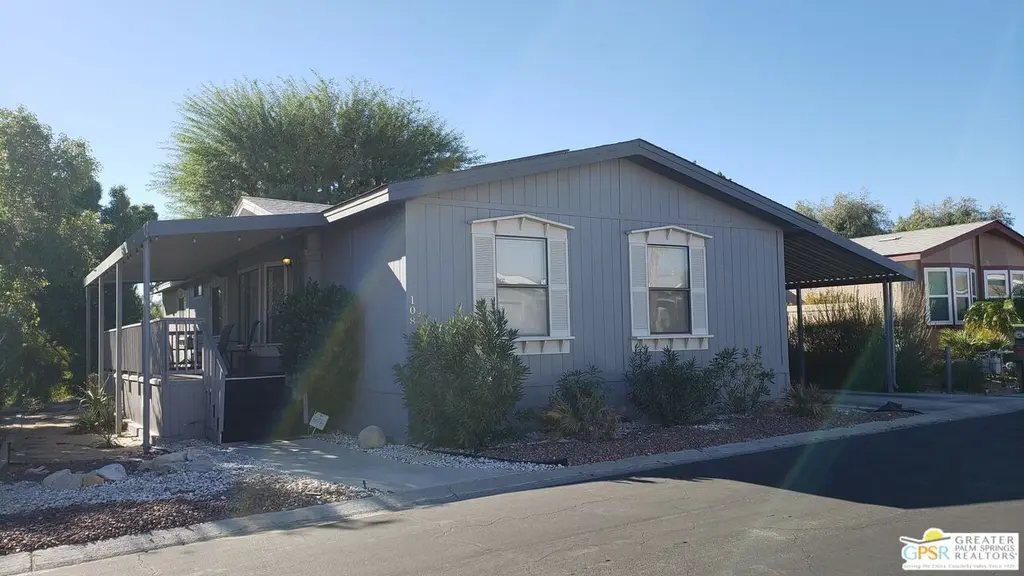
15300 Palm Dr #108 · Desert Hot Springs, CA
Flood risk 1/10 · Minimal
- FEMA flood zone
- X (shaded)
- Chance of flooding over 30 yrs
- 0.0%
- Est. flood insurance / yr
- $507 – $1,088
Fire risk 6/10 · Moderate
- Est. fire insurance / yr
- $659 – $1,223
Heat risk 9/10 · Severe
- Hot days now (above 111°F)
- 6 days/yr
- Hot days in 30 yrs
- 17 days/yr
Wind risk 1/10 · Minimal
- Chance of severe wind over 30 yrs
- —
Air-quality risk 5/10 · Moderate
- Unhealthy air days now
- 8 days/yr
- Unhealthy air days in 30 yrs
- 11 days/yr
Risk factors via First Street. Map © Google.
Why this score? — see what drove the C grade
The composite is a weighted blend of 9 inputs, each scored 0–100. Each bar is that input's sub-score; the figure is the points it added to the 100-point composite (weight × sub-score).
- Cash flow +22.2/30.0
- ARV discount +9.3/15.0
- 1% rule +7.8/10.0
- DSCR +7.1/10.0
- Condition / age +3.8/5.0
- Rent growth +3.4/5.0
- Schools +2.7/10.0
- Livability +2.5/5.0
- Appreciation +0.0/10.0
$215,000
🖨 Deal sheet 📄 Offer letter ✓ Due diligence
Listing remarks
This spacious 1989 3-bedroom, 2-bath home offering near 1,600 sq. ft. is priced to SELL NOW! (It was recently appraised at $245k--you have instant equity with purchase!!). Don't miss this exceptional opportunity to own in Vista Montana, one of the valley's premier 55+ fee-simple manufactured home communities where you own the land (433A certified). Enjoy resort-style living in this guard-gated community featuring low HOA dues and outstanding amenities including a beautifully appointed clubhouse with large TV lounge, fitness room, meeting space, full kitchen for private events, main pool and spa, satellite pool/spa, pickle ball court, billiards and card rooms, greenbelts, social activities,
Key facts
- Dog park
- Pickle ball court
- Fitness room
Tags
Property features AI
Finance
- Other: Located in a senior community
- HOA & community: HOA amenities include clubhouse, guarded gate, pool, spa, greenbelt/park, meeting room, and guest parking; Association allows pets; Homeowner dues apply
Exterior
- Parking: Attached carport; 2 covered parking spaces
- Security: Gated community with guard
- Utilities: Standard utilities available
- Home design: Residential mobile home; Single-story
- Construction: Solar panels
- Exterior features: Community pool; Planned urban development; Greenbelt and mountain views
Interior
- Kitchen: Dishwasher; Microwave; Garbage disposal; Refrigerator; Range/Oven; Hood fan; Water line to refrigerator
- Flooring: Laminate floors
- Bathrooms: 2 full bathrooms
- Heating & cooling: Central heating; Central cooling; Evaporative cooling; Wall/window unit cooling
- Interior features: Ceiling fan(s); Family room; Living room; Breakfast bar; Dining area; Covered patio; Utility room; Has view of greenbelt and mountains; Satellite service
- Laundry & utility: In-unit laundry area with washer and dryer
Neighborhood map
What this means for you Summary
Snapshot
- This is a 3-bed/2.0-bath single-family listed at $215k. Condition is rated good.
Deal economics
- At list price, monthly cash flow is $352 ($4k/yr) — positive.
- The deal already cash-flows at list — no discount required.
- Meets the 1% rule at list price ($3k rent vs $215k).
- Recommended offer: $209k (3.0% below list) — sets the bar for market timing.
- Cap rate 8.3% vs local median 4.0% in Desert Hot Springs — top-decile yield for the area; either an underpriced asset or a hidden risk that comps aren't pricing in. Stress-test before assuming the spread holds.
Location & tenants
- Location reads 49/100 on livability (#1,149 in CA) — a working-class tenant base; expect higher turnover. Strengths: housing B+; Watch: crime D+, schools F, amenities F.
- Palm Springs Unified (suburban): math 21% / reading 42% proficiency, ranked #328 of 517 in CA (top 63%) — families likely to look elsewhere, expect single-tenant / working-renter base with shorter leases; 73% free/reduced lunch — lower-income household profile, screen leases tightly.
- Market conditions: Rents rising (+3.7%/yr); 515 active listings in the ZIP; 16 comparable units currently listed for rent nearby; rentals lingering (median 44d on market — plan ~5-8 weeks vacancy on turnover, expect pricing pressure); 56% of comp listings sitting > 30 days — soft ceiling on asking rent; 9,195 units permitted in Riverside County in 2024 (1,512 in 5+ unit buildings).
- At $2,743/mo this rent would consume 61% of the median local household income ($54k/yr) (locally 2095% of renters already pay >50% of income on rent) — very limited rent-growth headroom before tenants either downsize or default.
Forward outlook
- Local home prices are declining (-3.0%/yr); year-one equity from $1k of loan paydown is wiped out by about $6k of value loss. Plan a longer hold.
- Riverside County population projected at +22% by 2050 — long-run rental-demand tailwind backs the buy-and-hold thesis.
Negotiation context
- It's been on market 41 days — a 3% lower offer ($209k) is reasonable based on typical stale-listing flexibility.
- 2 sale attempts with the ask held roughly flat each time — persistent listings suggest the price (not the market) is what's stuck; bring a comps-based counter.
Risks & watch-outs
- Climate carrying-cost: major wildfire risk; extreme-heat days projected 6→17/yr by 2055 (HVAC capex compounding) — expect insurance premiums to compound above CPI over the hold.
Questions for the listing agent
- It's been on market 41 days. Have you received any prior offers? Is the seller open to a 3% concession, seller financing, or rate buy-down credit?
- What does the HOA fee cover, when was the last increase, and are there any pending special assessments or reserve-fund shortfalls?
- Is there a deadline driving the sale (1031 exchange, divorce, estate, relocation)? That informs how much negotiation room exists.
- Schools are F-rated, which usually means shorter tenancies and higher turnover. Who's the typical renter profile here, and what's been the actual vacancy rate?
- Crime grade is D in this area — have there been break-ins, vandalism, or insurance claims at this property in the last 3 years? What carrier currently insures it and at what premium?
- What's the average days-on-market for RENTAL listings here right now (not sales)? A rising rental-DOM trend means longer vacancies and softer asking-rent achievability than the comps imply.
- What's the recent tenant-quality profile in this submarket — average credit score on applications, eviction rate, late-payment / NSF rate, and stable-employment percentage? A property-management company in the area should have these aggregated.
- How much new for-sale + rental construction is in the pipeline within 1–3 miles? Heavy new supply typically softens prices + rents 12–24 months out; constrained supply supports both.
Investment metrics
- 1% rule
- 1.28% ✓
- Cap rate
- 8.26%
- Cash-on-cash
- 7.02%
- DSCR
- 1.31
- GRM
- 6.5
CMA / ARV
- ARV (median comp)
- $223,910
- List price
- $215,000
- Delta
- -3.98%
- Verdict
- FAIR
- Comps
- 20 within 1.0 mi
Show comp detail 12 sales within ~0.75 mi
| Address | Dist | Beds/Ba | Sqft | Sold | Price | $/sf | Match |
|---|---|---|---|---|---|---|---|
| 15140 Via Vis | 0.24mi | 4/2.0 (+1) | 1,571 (-3%) | 5mo | $385,000 | $245 | 74 |
| 65232 Avenida De Paz | 0.16mi | 4/2.0 (+1) | 1,747 (+8%) | 1mo | $430,000 | $246 | 74 |
| 65259 Avenida De Paz | 0.20mi | 4/2.0 (+1) | 1,747 (+8%) | 1mo | $445,463 | $255 | 72 |
| 65271 Avenida De Paz | 0.20mi | 4/2.0 (+1) | 1,747 (+8%) | 2mo | $445,550 | $255 | 71 |
| 15041 Via Quedo | 0.29mi | 3/2.0 | 1,466 (-10%) | 2mo | $420,000 | $286 | 69 |
| 65103 Avenida De Nuves | 0.24mi | 4/2.0 (+1) | 1,747 (+8%) | 2mo | $443,000 | $254 | 69 |
| 15485 Avenida De Soledad | 0.21mi | 4/2.0 (+1) | 1,747 (+8%) | 6mo | $442,630 | $253 | 67 |
| 15462 Avenida De Cielo | 0.22mi | 4/2.0 (+1) | 1,747 (+8%) | 7mo | $430,000 | $246 | 65 |
| 15438 Avenida De Cielo | 0.21mi | 4/2.0 (+1) | 1,747 (+8%) | 10mo | $455,585 | $261 | 64 |
| 65184 Avenida De Nuves | 0.23mi | 4/2.0 (+1) | 1,747 (+8%) | 9mo | $440,990 | $252 | 64 |
| 15315 Avenida Mirola | 0.71mi | 3/2.0 | 1,584 (-2%) | 8mo | $420,000 | $265 | 57 |
| 66681 Thunderbird Ln | 0.33mi | 3/3.0 | 1,857 (+15%) | 8mo | $444,900 | $240 | 50 |
Match score weights: distance 35% · size 25% · config 20% · recency 20%. Top-matched comps best support the ARV.
Projected returns pro-forma
-3.0% appreciation · 3.66% rent growth · sell at horizon
- IRR
- -4.6%
- Equity multiple
- 0.83×
- Total profit
- $-10,336
- Equity at exit
- $32,057
- IRR
- 6.1%
- Equity multiple
- 1.47×
- Total profit
- $28,492
- Equity at exit
- $18,589
Cash invested: $60,200 (down + closing). Projections, not guarantees.
Landlord ↔ Tenant lean methodology
- Overall (STATE)
- 18 Strongly Tenant-Friendly
- State California
- 18 Strongly Tenant-Friendly · D+13
- County
- — inherits STATE
- City
- — inherits STATE
ZIP-level market 92240
- Home prices YoY
- -19.6%
- Rents YoY
- 3.7%
- Active inventory
- 515
- Price-to-rent
- 6.5×
Monthly cashflow live
- Estimated rent
- $2,743 high interval (Pro) →
- Mortgage (P&I)
- −$1,127
- Tax est. 1.5%
- −$269 /mo · $3,225/yr
- Insurance
- −$90
- HOA
- −$329
- Vacancy / Maint / Mgmt
- −$576
- Net cashflow
- $352
Break-even live
UW: 25.0% down · 7.5% · 30yr · 1.5% tax · 5.0% vac · 8.0% maint · 8.0% mgmt
Financing live
Cash to close
- Down payment
- $53,750
- Closing costs
- $6,450
- Reserves months
- —
- Total cash needed
- —
Loan-product check · same deal, 3 products live
Conventional
25% down · 7.5% · 30yr
- Down + closing
- —
- Monthly P&I
- —
- Monthly cashflow
- —
- DSCR
- —
- Eligible?
- —
Personal DTI + credit; lowest rate.
DSCR
20% down · 8.5% · 30yr
- Down + closing
- —
- Monthly P&I
- —
- Monthly cashflow
- —
- DSCR
- —
- Eligible?
- —
No personal income docs; deal must DSCR.
Hard money
10% down · 12.0% · 12mo
- Down + closing
- —
- Monthly P&I
- —
- Monthly cashflow
- —
- DSCR
- —
- Eligible?
- —
Short-term bridge; refi at stabilization.
Rent comps 16 comps
| Address | Beds | Baths | Sqft | Rent | $/sqft | DOM | Units | Dist |
|---|---|---|---|---|---|---|---|---|
| 15300 Palm Dr Desert Hot Springs, CA | 3.0 | 2.0 | 1458 | $2,800 | $1.92 | 43d | 1 | 0.07mi |
| 14777 Palm Dr Desert Hot Springs, CA | 4.0 | 2.0 | 1573 | $1,995 | $1.27 | 43d | 1 | 0.38mi |
| 15123 Avenida Ramada Desert Hot Springs, CA | 4.0 | 2.0 | 1745 | $3,200 | $1.83 | 17d | 1 | 0.51mi |
| 16111 Avenida Ramada Desert Hot Springs, CA | 4.0 | 2.0 | 1773 | $3,000 | $1.69 | 43d | 1 | 0.59mi |
| 13987 El Cajon Dr Desert Hot Springs, CA | 3.0 | 2.0 | 1215 | $2,600 | $2.14 | 7d | 1 | 0.75mi |
| 15490 Avenue Rambla Unit NA Desert Hot Springs, CA | 3.0 | 2.0 | 1088 | $2,600 | $2.39 | 24d | 1 | 0.86mi |
| 15490 Avenida Rambla Desert Hot Springs, CA | 3.0 | 2.0 | 1088 | $2,600 | $2.39 | 43d | 1 | 0.86mi |
| 66629 Joseph Way Unit B Desert Hot Springs, CA | 4.0 | 2.0 | 1200 | $2,900 | $2.42 | 24d | 1 | 0.86mi |
| 16087 Bubbling Wells Rd Desert Hot Springs, CA | 3.0 | 2.0 | 1850 | $5,000 | $2.70 | 43d | 1 | 0.94mi |
| 13244 El Cajon Dr Desert Hot Springs, CA | 4.0 | 0.5 | 1320 | $3,200 | $2.42 | 43d | 1 | 1.09mi |
| 13715 El Rio Ln Desert Hot Springs, CA | 3.0 | 2.0 | 1318 | $2,600 | $1.97 | 7d | 1 | 1.14mi |
| 13322 El Rio Ln Desert Hot Springs, CA | 3.0 | 2.0 | 1215 | $2,750 | $2.26 | 43d | 1 | 1.27mi |
| 13416 Cholla Dr Desert Hot Springs, CA | 4.0 | 3.0 | 1980 | $3,200 | $1.62 | 24d | 1 | 1.27mi |
| 13437 Cuando Way Desert Hot Springs, CA | 4.0 | 2.5 | 1853 | $3,200 | $1.73 | 43d | 1 | 1.41mi |
| 66824 Estrella Ave Desert Hot Springs, CA | 3.0 | 1.0 | 1700 | $2,300 | $1.35 | 23d | 1 | 1.41mi |
| 66444 Desert View Ave Unit B Desert Hot Springs, CA | 3.0 | 2.0 | 1294 | $2,275 | $1.76 | 43d | 1 | 1.46mi |
HOA detail
- Monthly dues
- $329 · $3,948/yr
- Likely covers
- poolsecurity
Listing history 16 events
-
2026-06-18days on market $215,000 Active 41 DOM
-
2026-06-17days on market $215,000 Active 40 DOM
-
2026-06-16days on market $215,000 Active 39 DOM
-
2026-06-15days on market $215,000 Active 38 DOM
-
2026-06-13days on market $215,000 Active 36 DOM
-
2026-06-13days on market $215,000 Active 35 DOM
-
2026-06-09days on market $215,000 Active 32 DOM
-
2026-06-08days on market $215,000 Active 31 DOM
-
2026-06-07days on market $215,000 Active 30 DOM
-
2026-06-04days on market $215,000 Active 27 DOM
-
2026-06-03days on market $215,000 Active 26 DOM
-
2026-06-02days on market $215,000 Active 25 DOM
-
2026-06-01days on market $215,000 Active 24 DOM
-
2026-05-31days on market $215,000 Active 23 DOM
-
2026-05-08$215,000 Active 1624-char remark
-
2026-05-06$1,900
ⓘ Source: listings_history table (triggers on properties + properties_extension) + one-shot
backfill from property_details.listing_events for pre-trigger history.
Climate risk First Street
- Flood 1/10 Low FEMA zone X (shaded) · 0% chance over 30 yrs
- Wildfire 6/10 Major
- Heat 9/10 Extreme 6 d/yr ≥111°F today · 17 d/yr by 30 yrs out
- Wind 1/10 Low
- Air quality 5/10 Major 8 unhealthy d/yr today · 11 by 30 yrs out
Nearby sold comps map
Loading sold comps map…
Walkable amenities ~0.75 mi
Loading nearby amenities…
Taxation est. · year 1
- Rental income
- $32,915
- − Mortgage interest
- −$12,043
- − Property taxes
- −$3,225
- − Insurance
- −$1,075
- − Repairs & maintenance
- −$2,633
- − Management
- −$2,633
- − HOA
- −$3,948
- − Depreciation
- −$6,255
- Taxable income
- $1,103
- Est. tax owed @ 24.0%
- −$265
- After-tax cash flow
- $3,961/yr
For passive investors: Depreciation is non-cash, so a rental often shows a tax loss while cash-flowing — sheltering income. Rental losses are passive: they offset passive income freely, and up to $25,000/yr can offset ordinary (W-2) income if you actively participate and your MAGI is under $100k (phasing out to $0 by $150k); unused losses carry forward. On sale, claimed depreciation is recaptured at up to 25%, and gains may owe capital-gains tax (a 1031 exchange can defer both). Figures are a year-1 estimate at your 24.0% rate — not tax advice; consult a CPA.
Condition & rehab AI · 30 photos
This well-maintained 1989 3-bedroom, 2-bath home in Vista Montana is ready to move in and offers a great opportunity for investment.
Value-add opportunities
- Both Paint the exterior siding — Fresh paint can enhance curb appeal and value
- Both Replace the curtains — Fresh curtains can make the space feel more inviting
- Both Install a new TV stand — A new TV stand can improve the living room's aesthetics and functionality
- Both Replace the flooring in the bathrooms — New flooring can improve the bathrooms' appearance and functionality
- Both Install new light fixtures — New light fixtures can improve the home's curb appeal and functionality
- Both Replace the curtains — Fresh curtains can make the space feel more inviting
- Both Install new light fixtures — New light fixtures can improve the home's curb appeal and functionality
Renovation cost estimate screening
Value-add ROI direction
- Both Paint the exterior siding — Fresh paint can enhance curb appeal and value ↑
- Both Replace the curtains — Fresh curtains can make the space feel more inviting ↑
- Both Install a new TV stand — A new TV stand can improve the living room's aesthetics and functionality ↑
- Both Replace the flooring in the bathrooms — New flooring can improve the bathrooms' appearance and functionality ↑
- Both Install new light fixtures — New light fixtures can improve the home's curb appeal and functionality ↑
- Both Replace the curtains — Fresh curtains can make the space feel more inviting ↑
- Both Install new light fixtures — New light fixtures can improve the home's curb appeal and functionality ↑
ⓘ Cost ranges are severity-bucket heuristics (US national rule-of-thumb). Get contractor quotes + a written scope before underwriting a rehab budget.
Schools (NCES district)
- District
- Palm Springs Unified
- NCES district ID
- 0629550
- Math proficiency
- 21% ▼ -7.00%
- Reading proficiency
- 42% ▬ 0.00%
- Median HH income
- $43,638
- Composite
- 26.76/100
- National rank
- #7131
- State rank
- #328 of 517 in CA
Livability — Desert Hot Springs
- Score
- 49/100
- State rank
- #1149
- US rank
- #25774
Category grades
Schools grade is shown separately in the Schools card above.
Census & demographics
- Census place
- Desert Hot Springs, CA
- County
- Riverside County · 2,287,001 people
- City population
- 41,615
- Metro
- Riverside-San Bernardino-Ontario, CA
- Population (ZIP)
- 41,615
- Household income
- $54,023
- Rent vs Own
- Severe rent burden
- 2095.0
Population outlook (Riverside County) Hauer SSP2
- Today (2025)
- 2,664,475 people
- By 2030
- 2,802,692 · +5.2%
- By 2040
- 3,050,904 · +14.5%
- By 2050
- 3,256,783 · +22.2%
- By 2075
- 3,655,058 · +37.2%
- By 2100
- 3,766,594 · +41.4%
Race, ethnicity, and origin ACS 2023
- Neighborhood character
- Majority Hispanic (64%)
- Race & ethnicity
- Hispanic / Latino 64% Two or more races 27% White 23% Black 7% Native American 2% Asian 2%
- Hispanic origin (detail)
- Mexican 53%
- Common ancestry
- Lithuanian 1% Romanian 1% Italian 1%
- Foreign-born
- 27% · Canada, Vietnam
- Languages at home
- 47% English-only · Spanish 50% Russian/Polish/Slavic 1%
Political lean MEDSL · Riverside
- 2024 margin
- Toss-up / Even · D 48.0% · R 49.3% · Other 2.6%
- 2008→2024 swing
- -3.6pp toward R · 2008: 2.3pp · 2024: -1.3pp
- All cycles
- 2024: R+1.3 2020: D+8.0 2016: D+4.3 2012: R+0.4 2008: D+2.3
Not yet ingested
- Civics
- —
Market trends
- HPI YoY
- ▼ -102.10%
- Current HPI
- 418.4691
- Rent YoY
- ▲ 3.66%
- Metro
- Riverside-San Bernardino-Ontario, CA
- State GDP YoY
- ▲ 3.21%
- F500 in state
- 116
Industry mix (Fortune 500 HQ in CA)
| Industry | F500 HQs | Revenue |
|---|---|---|
| Technology | 27 | $1,492B |
|
||
| Financial Services | 3 | $174B |
|
||
| Retail | 3 | $44B |
|
||
| Insurance | 3 | $26B |
|
||
| Media / Entertainment | 2 | $115B |
|
||
| Pharmaceuticals / Biotech | 2 | $62B |
|
||
Price history
+11215.8% since first listed2 events — show timeline
- 2026-05-08 Listed $215,000 TheMLS
- 2026-05-06 Listed for Rent $1,900 CLAW
Cash-flow waterfall
monthlySold comps — $/sqft
last 12 mo · ≤1 miLoading sold comps…