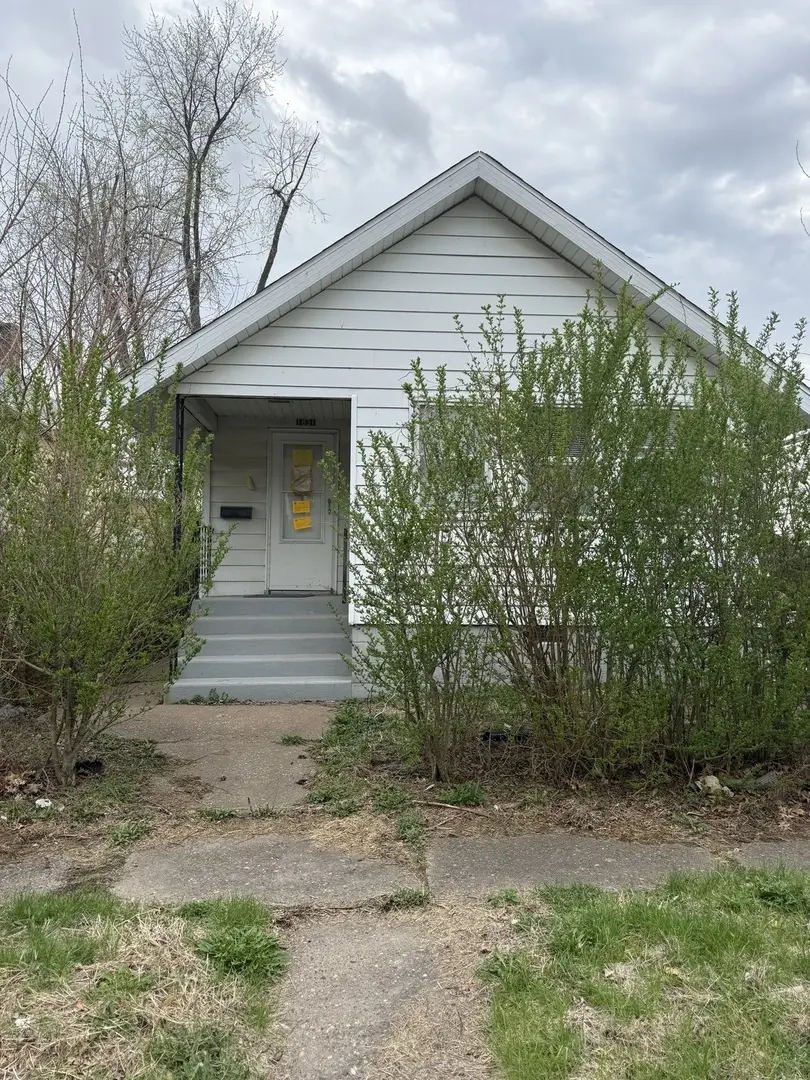
1831 W 5th St · Davenport, IA
Flood risk 1/10 · Minimal
- FEMA flood zone
- X (unshaded)
- Chance of flooding over 30 yrs
- 0.0%
- Est. flood insurance / yr
- $473 – $860
Fire risk 1/10 · Minimal
- Est. fire insurance / yr
- $902 – $1,676
Heat risk 3/10 · Minor
- Hot days now (above 104°F)
- 7 days/yr
- Hot days in 30 yrs
- 16 days/yr
Wind risk 2/10 · Minimal
- Chance of severe wind over 30 yrs
- —
Air-quality risk 3/10 · Minor
- Unhealthy air days now
- 2 days/yr
- Unhealthy air days in 30 yrs
- 3 days/yr
Risk factors via First Street. Map © Google.
Why this score? — see what drove the B grade
The composite is a weighted blend of 9 inputs, each scored 0–100. Each bar is that input's sub-score; the figure is the points it added to the 100-point composite (weight × sub-score).
- Cash flow +26.8/30.0
- ARV discount +15.0/15.0
- DSCR +9.2/10.0
- 1% rule +8.3/10.0
- Livability +4.0/5.0
- Schools +3.9/10.0
- Rent growth +2.5/5.0
- Condition / age +2.5/5.0
- Appreciation +0.0/10.0
$65,000
🖨 Deal sheet 📄 Offer letter ✓ Due diligence
Listing remarks
Great home with potential! 3-bed 1-bath in Davenports West End. Great investment property with a detached garage! Schedule your showing today! Home to be sold as-is. All personal property to remain.
Key facts
- 4,950 sq ft lot
- 2 garage spots
- Built 1920
Neighborhood map
What this means for you Summary
Snapshot
- This is a 2-bed/1.5-bath single-family listed at $65k.
Deal economics
- At list price, monthly cash flow is $178 ($2k/yr) — positive.
- The deal already cash-flows at list — no discount required.
- Meets the 1% rule at list price ($865 rent vs $65k).
- Cap rate 9.6% vs local median 4.4% in Davenport — top-decile yield for the area; either an underpriced asset or a hidden risk that comps aren't pricing in. Stress-test before assuming the spread holds.
Location & tenants
- Location reads 79/100 on livability (#126 in IA, #2,312 nationally) — a middle-class / working-renter tenant base. Strengths: cost of living A+, housing A+, health & safety A+; Watch: employment C-, crime F.
- Davenport Community School District (urban): math 43% / reading 50% proficiency, ranked #288 of 289 in IA (top 100%) — families likely to look elsewhere, expect single-tenant / working-renter base with shorter leases.
- Market conditions: 68 active listings in the ZIP; 20 comparable units currently listed for rent nearby; rentals lingering (median 44d on market — plan ~5-8 weeks vacancy on turnover, expect pricing pressure); 75% of comp listings sitting > 30 days — soft ceiling on asking rent; 805 units permitted in Scott County in 2024 (479 in 5+ unit buildings).
Forward outlook
- Local home prices are declining (-3.0%/yr); year-one equity from $449 of loan paydown is wiped out by about $2k of value loss. Plan a longer hold.
- Scott County population projected at +19% by 2050 — long-run rental-demand tailwind backs the buy-and-hold thesis.
- At projected returns (-3.0% appreciation + 3.0% rent growth), your $18k cash investment doubles in ~10 years — after that, you're playing with house money.
Negotiation context
- Only 5 days on market — expect competitive offers; lowballing is unlikely to land.
- Current owner paid $50k; 30% above their basis — modest negotiation headroom, anchor on the comps not their cost.
Risks & watch-outs
- Watch-outs: property tax is 2.5% of price; built in 1920 — expect roof / HVAC / electrical / plumbing capex.
Questions for the listing agent
- Built in 1920 — when were the roof, HVAC, electrical panel, plumbing, and water heater last replaced?
- Property tax is high relative to price — has the assessment been appealed recently, and will the sale trigger a re-assessment?
- Is there a deadline driving the sale (1031 exchange, divorce, estate, relocation)? That informs how much negotiation room exists.
- Crime grade is F in this area — have there been break-ins, vandalism, or insurance claims at this property in the last 3 years? What carrier currently insures it and at what premium?
- What's the average days-on-market for RENTAL listings here right now (not sales)? A rising rental-DOM trend means longer vacancies and softer asking-rent achievability than the comps imply.
- What's the recent tenant-quality profile in this submarket — average credit score on applications, eviction rate, late-payment / NSF rate, and stable-employment percentage? A property-management company in the area should have these aggregated.
- How much new for-sale + rental construction is in the pipeline within 1–3 miles? Heavy new supply typically softens prices + rents 12–24 months out; constrained supply supports both.
Investment metrics
- 1% rule
- 1.33% ✓
- Cap rate
- 9.58%
- Cash-on-cash
- 11.75%
- DSCR
- 1.52
- GRM
- 6.3
CMA / ARV
- ARV (on-the-fly)
- $110,922
- Comps found
- 12
Show comp detail 12 sales within ~0.75 mi
| Address | Dist | Beds/Ba | Sqft | Sold | Price | $/sf | Match |
|---|---|---|---|---|---|---|---|
| 1831 W 5th St | 0.00mi | 3/1.0 (+1) | 798 (0%) | 1mo | $65,000 | $81 | 92 |
| 1811 W 8th St | 0.27mi | 2/1.0 | 788 (-1%) | 1mo | $65,000 | $82 | 82 |
| 120 N Elmwood Ave | 0.63mi | 2/2.0 | 792 (-1%) | 0mo | $120,000 | $152 | 67 |
| 727 Oak St | 0.33mi | 1/2.0 (-1) | 768 (-4%) | 9mo | $140,000 | $182 | 63 |
| 1330 W 7th St | 0.58mi | 2/1.0 | 842 (+6%) | 2mo | $62,000 | $74 | 60 |
| 124 N Elmwood Ave | 0.62mi | 2/1.0 | 723 (-9%) | 3mo | $112,500 | $156 | 51 |
| 113 S Thornwood Ave | 0.68mi | 2/1.0 | 825 (+3%) | 14mo | $92,000 | $112 | 49 |
| 1417 W 12th St | 0.71mi | 2/1.0 | 872 (+9%) | 1mo | $77,000 | $88 | 49 |
| 1414 W 9th St | 0.58mi | 3/1.0 (+1) | 864 (+8%) | 7mo | $103,585 | $120 | 47 |
| 511 Waverly Rd Rd | 0.55mi | 2/1.0 | 684 (-14%) | 3mo | $115,000 | $168 | 46 |
| 2340 Boies Ave | 0.72mi | 2/1.0 | 842 (+6%) | 14mo | $125,500 | $149 | 43 |
| 109 S Elmwood Ave | 0.63mi | 2/2.0 | 911 (+14%) | 14mo | $127,000 | $139 | 33 |
Match score weights: distance 35% · size 25% · config 20% · recency 20%. Top-matched comps best support the ARV.
Projected returns pro-forma
-3.0% appreciation · 3.0% rent growth · sell at horizon
- IRR
- 1.2%
- Equity multiple
- 1.05×
- Total profit
- $864
- Equity at exit
- $9,692
- IRR
- 10.9%
- Equity multiple
- 1.85×
- Total profit
- $15,559
- Equity at exit
- $5,620
Cash invested: $18,200 (down + closing). Projections, not guarantees.
Landlord ↔ Tenant lean methodology
- Overall (STATE)
- 83 Strongly Landlord-Friendly
- State Iowa
- 83 Strongly Landlord-Friendly · R+6
- County
- — inherits STATE
- City
- — inherits STATE
ZIP-level market 52802
- Home prices YoY
- -28.3%
- Active inventory
- 68
- Price-to-rent
- 6.3×
Monthly cashflow live
- Estimated rent
- $865 high interval (Pro) →
- Mortgage (P&I)
- −$341
- Tax from tax record
- −$137 /mo · $1,647/yr
- Insurance
- −$27
- HOA
- −$0
- Vacancy / Maint / Mgmt
- −$182
- Net cashflow
- $178
Break-even live
UW: 25.0% down · 7.5% · 30yr · 1.5% tax · 5.0% vac · 8.0% maint · 8.0% mgmt
Financing live
Cash to close
- Down payment
- $16,250
- Closing costs
- $1,950
- Reserves months
- —
- Total cash needed
- —
Loan-product check · same deal, 3 products live
Conventional
25% down · 7.5% · 30yr
- Down + closing
- —
- Monthly P&I
- —
- Monthly cashflow
- —
- DSCR
- —
- Eligible?
- —
Personal DTI + credit; lowest rate.
DSCR
20% down · 8.5% · 30yr
- Down + closing
- —
- Monthly P&I
- —
- Monthly cashflow
- —
- DSCR
- —
- Eligible?
- —
No personal income docs; deal must DSCR.
Hard money
10% down · 12.0% · 12mo
- Down + closing
- —
- Monthly P&I
- —
- Monthly cashflow
- —
- DSCR
- —
- Eligible?
- —
Short-term bridge; refi at stabilization.
Rent comps 20 comps
| Address | Beds | Baths | Sqft | Rent | $/sqft | DOM | Units | Dist |
|---|---|---|---|---|---|---|---|---|
| 627 N Division St Davenport, IA | 2.0 | 1.0 | 800 | $800 | $1.00 | 43d | 1 | 0.24mi |
| 1529 W 6th St Davenport, IA | 2.0 | 1.0 | 794 | $850 | $1.07 | 13d | 1 | 0.32mi |
| 1603 W 10th St Unit 2 Davenport, IA | 1.0 | 1.0 | 900 | $700 | $0.78 | 43d | 1 | 0.46mi |
| 524 Lincoln Ct Unit 2 Davenport, IA | 1.0 | 1.0 | 600 | $850 | $1.42 | 21d | 1 | 0.48mi |
| 1607 W 12th St Davenport, IA | 1.0–2.0 | 1.0 | 800 | $740 | $0.93 | 43d | 3 | 0.52mi |
| 1341 W 4th St Davenport, IA | 3.0 | 1.5 | 979 | $1,394 | $1.42 | 43d | 1 | 0.54mi |
| 445 Waverly Rd Davenport, IA | 2.0 | 1.0 | 980 | $1,200 | $1.22 | 43d | 1 | 0.57mi |
| 308 S Lincoln Ave Davenport, IA | 1.0 | 1.0 | 825 | $825 | $1.00 | 21d | 1 | 0.62mi |
| 1212 W 3rd St Unit 1-101 Davenport, IA | 1.0 | 1.0 | 585 | $729 | $1.25 | 43d | 1 | 0.64mi |
| 1455 W 12th St Davenport, IA | 3.0 | 1.0 | 942 | $1,095 | $1.16 | 13d | 1 | 0.66mi |
| 1436 W 15th St Unit 1438 1/2 Davenport, IA | 1.0 | 1.0 | 699 | $695 | $0.99 | 43d | 1 | 0.88mi |
| 1445 W 16th St Unit 3 Davenport, IA | 2.0 | 1.0 | 765 | $915 | $1.20 | 43d | 1 | 0.91mi |
| 1622 Washington St Unit 4 Davenport, IA | 1.0 | 1.0 | 530 | $875 | $1.65 | 43d | 1 | 0.95mi |
| 730 Brown St Unit 3 Davenport, IA | 2.0 | 1.0 | 1000 | $800 | $0.80 | 43d | 1 | 1.03mi |
| 1318 1/2 Brown St Davenport, IA | 2.0 | 1.0 | 900 | $875 | $0.97 | 21d | 1 | 1.21mi |
| 3032 Indian Rd Unit 0 Davenport, IA | 2.0 | 1.0 | 600 | $900 | $1.50 | 43d | 1 | 1.24mi |
| 1011 W Locust St Apt 1 Davenport, IA | 1.0 | 1.0 | 750 | $675 | $0.90 | 43d | 1 | 1.28mi |
| 317 W 3rd St Davenport, IA | 1.0 | 1.0 | 600 | $900 | $1.50 | 43d | 1 | 1.36mi |
| 619 W 16th St Unit 4 Davenport, IA | 1.0 | 1.0 | 700 | $745 | $1.06 | 43d | 1 | 1.40mi |
| 410 N Main St Unit 230 Davenport, IA | 2.0 | 1.0 | 800 | $1,250 | $1.56 | 43d | 1 | 1.47mi |
Listing history 4 events
-
2026-04-21status Pending
-
2026-04-16$65,000 Active
-
2021-08-06historical
-
2013-11-01soldstatus $50,000
ⓘ Source: listings_history table (triggers on properties + properties_extension) + one-shot
backfill from property_details.listing_events for pre-trigger history.
Tax reassessment forecast IA · Partial reset (capped growth)
- Current annual tax
- $1,647 · $137/mo
- Projected year-2 tax
- $1,647 · $137/mo
- Expected delta
- $0/yr ($0/mo · 0.0%)
ⓘ Screening estimate from a state-policy table — verify with the county assessor before closing.
Climate risk First Street
- Flood 1/10 Low FEMA zone X (unshaded) · 0% chance over 30 yrs
- Wildfire 1/10 Low
- Heat 3/10 Moderate 7 d/yr ≥104°F today · 16 d/yr by 30 yrs out
- Wind 2/10 Low
- Air quality 3/10 Moderate 2 unhealthy d/yr today · 3 by 30 yrs out
Nearby sold comps map
Loading sold comps map…
Walkable amenities ~0.75 mi
Loading nearby amenities…
Taxation est. · year 1
- Rental income
- $10,381
- − Mortgage interest
- −$3,641
- − Property taxes
- −$1,647
- − Insurance
- −$325
- − Repairs & maintenance
- −$830
- − Management
- −$830
- − Depreciation
- −$1,891
- Taxable income
- $1,216
- Est. tax owed @ 24.0%
- −$292
- After-tax cash flow
- $1,846/yr
For passive investors: Depreciation is non-cash, so a rental often shows a tax loss while cash-flowing — sheltering income. Rental losses are passive: they offset passive income freely, and up to $25,000/yr can offset ordinary (W-2) income if you actively participate and your MAGI is under $100k (phasing out to $0 by $150k); unused losses carry forward. On sale, claimed depreciation is recaptured at up to 25%, and gains may owe capital-gains tax (a 1031 exchange can defer both). Figures are a year-1 estimate at your 24.0% rate — not tax advice; consult a CPA.
Schools (NCES district)
- District
- Davenport Community School District
- NCES district ID
- 1908580
- Math proficiency
- 43% ▼ -11.00%
- Reading proficiency
- 50% ▼ -3.00%
- Median HH income
- $46,157
- Composite
- 39.49/100
- National rank
- #3951
- State rank
- #288 of 289 in IA
Livability — Davenport
- Score
- 79/100
- State rank
- #126
- US rank
- #2312
Category grades
Schools grade is shown separately in the Schools card above.
Census & demographics
- Census place
- Davenport, IA
- County
- Scott County · 144,583 people
- City population
- 103,319
- Metro
- Davenport-Moline-Rock Island, IA-IL
- Population (ZIP)
- 9,466
- Household income
- $54,380
- Rent vs Own
- Severe rent burden
- 244.0
Population outlook (Scott County) Hauer SSP2
- Today (2025)
- 188,878 people
- By 2030
- 196,648 · +4.1%
- By 2040
- 210,860 · +11.6%
- By 2050
- 224,359 · +18.8%
- By 2075
- 258,884 · +37.1%
- By 2100
- 286,447 · +51.7%
Race, ethnicity, and origin ACS 2023
- Neighborhood character
- Predominantly White (71%)
- Race & ethnicity
- White 71% Hispanic / Latino 14% Two or more races 10% Black 5% Asian 1%
- Hispanic origin (detail)
- Mexican 13%
- Common ancestry
- Romanian 2% Lithuanian 1% Italian 1%
- Foreign-born
- 4% · Canada, Vietnam
- Languages at home
- 92% English-only · Spanish 7%
Political lean MEDSL · Scott
- 2024 margin
- Toss-up / Even · D 47.3% · R 51.2% · Other 1.4%
- 2008→2024 swing
- -18.4pp toward R · 2008: 14.6pp · 2024: -3.9pp
- All cycles
- 2024: R+3.9 2020: D+3.5 2016: D+1.4 2012: D+13.8 2008: D+14.6
Not yet ingested
- Civics
- —
Market trends
- HPI YoY
- ▼ -59.59%
- Current HPI
- 151.2076
- Rent YoY
- —
- Metro
- Davenport-Moline-Rock Island, IA-IL
- State GDP YoY
- ▲ 2.48%
- F500 in state
- 4
Industry mix (Fortune 500 HQ in IA)
| Industry | F500 HQs | Revenue |
|---|---|---|
| Financial Services | 1 | $16B |
|
||
| Retail / Convenience | 1 | $15B |
|
||
Price history
+30.0% since first listed4 events — show timeline
- 2026-04-21 Pending — MRED as Distributed by MLS Grid
- 2026-04-16 Listed $65,000 MRED as Distributed by MLS Grid
- 2021-08-06 Listing Removed — RMLSA as Distributed by MLS Grid
- 2013-11-01 Sold (Public Records) $50,000 Public Records
Property tax history
+4.4%/yrLatest (2025): $1,647 · -8.5% YoY. Source: county tax records.
Cash-flow waterfall
monthlySold comps — $/sqft
last 12 mo · ≤1 miLoading sold comps…