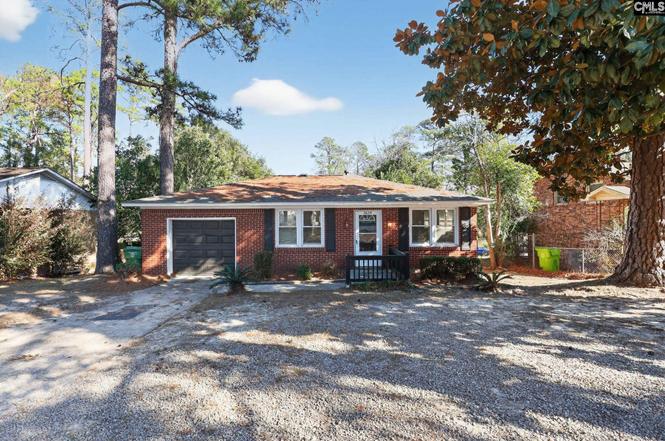
1634 S Beltline Blvd · Columbia, SC
Flood risk 7/10 · Major
- FEMA flood zone
- X
- Chance of flooding over 30 yrs
- 0.99%
- Est. flood insurance / yr
- $435 – $905
Fire risk 2/10 · Minimal
- Est. fire insurance / yr
- $783 – $1,453
Heat risk 7/10 · Major
- Hot days now (above threshold)
- 7 days/yr
- Hot days in 30 yrs
- 16 days/yr
Wind risk No data
- Chance of severe wind over 30 yrs
- —
Air-quality risk No data
- Unhealthy air days now
- —
- Unhealthy air days in 30 yrs
- —
Risk factors via First Street. Map © Google.
Why this score? — see what drove the C- grade
The composite is a weighted blend of 9 inputs, each scored 0–100. Each bar is that input's sub-score; the figure is the points it added to the 100-point composite (weight × sub-score).
- ARV discount +15.0/15.0
- Cash flow +14.9/30.0
- 1% rule +4.9/10.0
- DSCR +4.6/10.0
- Rent growth +4.2/5.0
- Livability +3.9/5.0
- Schools +2.6/10.0
- Condition / age +2.5/5.0
- Appreciation +0.0/10.0
$159,900
🖨 Deal sheet (PDF) 📄 Offer letter ✓ Due diligence
Listing remarks
Charming single-family ranch offering 3 bedrooms and 2 baths with a functional, single-level layout. The home features generously sized bedrooms, ample natural light, and a spacious living area ideal for everyday living and entertaining. Enjoy a large backyard with plenty of room for outdoor activities, gardening, or future expansion. Conveniently located and full of potential—this home is a great opportunity to make it your own. Disclaimer: CMLS has not reviewed and, therefore, does not endorse vendors who may appear in listings.
Key facts
- Large backyard
- Single family ranch
- 0.23 acre lot
Tags
Property features AI
Exterior
- Parking: Attached 1-car garage
- Utilities: Public water; Public sewer
- Home design: Single-story home
- Construction: Crawlspace foundation
- Exterior features: Brick exterior on all sides above the foundation; Paved road access
Interior
- Bedrooms: Primary bedroom on the main level
- Bathrooms: 2 full bathrooms
- Heating & cooling: Central heating; Central air conditioning
- Interior features: 1,285 heated square feet
Neighborhood map
What this means for you Summary
Snapshot
- This is a 3-bed/2.0-bath single-family listed at $160k.
Deal economics
- At list price, monthly cash flow is $-9 ($-114/yr) — negative.
- To cash-flow at today's rent, offer at most $158k (1.0% below list).
- To meet the 1% rule (rent ≥ 1% of price), the offer needs to be $159k (0.6% below list).
- Recommended offer: $141k (12.0% below list) — sets the bar for market timing.
- Cap rate 6.6% vs local median 5.1% in Columbia — top-decile yield for the area; either an underpriced asset or a hidden risk that comps aren't pricing in. Stress-test before assuming the spread holds.
Location & tenants
- Location reads 78/100 on livability (#18 in SC, #2,436 nationally) — a middle-class / working-renter tenant base. Strengths: amenities A+, commute A+, cost of living A+; Watch: employment D, crime F.
- Richland 01 (urban): math 26% / reading 36% proficiency, ranked #54 of 80 in SC (top 68%) — families likely to look elsewhere, expect single-tenant / working-renter base with shorter leases; 64% free/reduced lunch — lower-income household profile, screen leases tightly.
- Zoned schools: South Kilbourne Elementary (math 12% / reading 17%, grade F, #553 of 597 statewide, top 95%, 296 students, 100% FRL); Hand Middle (math 29% / reading 37%, grade F, #116 of 229 statewide, top 51%, 652 students, 100% FRL); Dreher High (math 47% / reading 92%, grade B, #60 of 196 statewide, top 32%, 1,150 students, 100% FRL) — zoned schools average 100% FRL vs 64% district-wide (36 pts higher); higher-poverty schools than district average — tighter screening recommended.
- Market conditions: Rents rising fast (+7.0%/yr); 150 active listings in the ZIP; 21 comparable units currently listed for rent nearby; rentals at typical pace (median 26d on market — plan ~3-4 weeks tenant-placement turnaround); 3,472 units permitted in Richland County in 2024 (1,096 in 5+ unit buildings).
Forward outlook
- Local home prices are declining (-3.0%/yr); year-one equity from $1k of loan paydown is wiped out by about $5k of value loss. Plan a longer hold.
- Richland County population projected at +30% by 2050 — long-run rental-demand tailwind backs the buy-and-hold thesis.
Negotiation context
- It's been on market 137 days — a 12% lower offer ($141k) is reasonable based on typical stale-listing flexibility.
- 2 sale attempts; this cycle's ask has dropped $35k (18%) from the opening price — seller is motivated, your offer sets the floor, not the list.
- Current owner paid $108k; 48% above their basis — modest negotiation headroom, anchor on the comps not their cost.
Risks & watch-outs
- Watch-outs: flood insurance adds $56/mo.
- Climate carrying-cost: major flood risk; extreme-heat days projected 7→16/yr by 2055 (HVAC capex compounding) — expect insurance premiums to compound above CPI over the hold.
Questions for the listing agent
- What do current leases actually rent for vs. the listed asking? Can we see a recent rent roll and the last 12 months of T-12 income?
- It's been on market 137 days. Have you received any prior offers? Is the seller open to a 12% concession, seller financing, or rate buy-down credit?
- Built in 1966 — when were the roof, HVAC, electrical panel, plumbing, and water heater last replaced?
- What's the actual annual flood-insurance premium (NFIP or private), and is the property in a SFHA with mandatory coverage?
- Why hasn't it sold? Are there any deal-killer items the seller is aware of (foundation, flood, title, zoning, code violations)?
- Is there a deadline driving the sale (1031 exchange, divorce, estate, relocation)? That informs how much negotiation room exists.
- Schools are D-rated, which usually means shorter tenancies and higher turnover. Who's the typical renter profile here, and what's been the actual vacancy rate?
- Crime grade is F in this area — have there been break-ins, vandalism, or insurance claims at this property in the last 3 years? What carrier currently insures it and at what premium?
- What's the average days-on-market for RENTAL listings here right now (not sales)? A rising rental-DOM trend means longer vacancies and softer asking-rent achievability than the comps imply.
- What's the recent tenant-quality profile in this submarket — average credit score on applications, eviction rate, late-payment / NSF rate, and stable-employment percentage? A property-management company in the area should have these aggregated.
- How much new for-sale + rental construction is in the pipeline within 1–3 miles? Heavy new supply typically softens prices + rents 12–24 months out; constrained supply supports both.
Investment metrics
- 1% rule
- 0.99% ✗
- Cap rate
- 6.64%
- Cash-on-cash
- 1.24%
- DSCR
- 1.06
- GRM
- 8.4
CMA / ARV
- ARV (on-the-fly)
- $280,130
- Comps found
- 2
Show comp detail 2 sales within ~0.75 mi
| Address | Dist | Beds/Ba | Sqft | Sold | Price | $/sf | Match |
|---|---|---|---|---|---|---|---|
| 1207 Chevis St | 0.51mi | 2/2.0 (-1) | 1,116 (-13%) | 2mo | $243,000 | $218 | 48 |
| 1012 Suber St | 0.69mi | 3/2.0 | 1,389 (+8%) | 18mo | $255,000 | $184 | 40 |
Match score weights: distance 35% · size 25% · config 20% · recency 20%. Top-matched comps best support the ARV.
Projected returns pro-forma
-3.0% appreciation · 6.95% rent growth · sell at horizon
- IRR
- -11.7%
- Equity multiple
- 0.56×
- Total profit
- $-19,823
- Equity at exit
- $23,842
- IRR
- 3.0%
- Equity multiple
- 1.26×
- Total profit
- $11,701
- Equity at exit
- $13,825
Cash invested: $44,772 (down + closing). Projections, not guarantees.
Landlord ↔ Tenant lean methodology
- Overall (STATE)
- 90 Strongly Landlord-Friendly
- State South Carolina
- 90 Strongly Landlord-Friendly · R+6
- County
- — inherits STATE
- City
- — inherits STATE
ZIP-level market 29205
- Rents YoY
- 7.0%
- Active inventory
- 150
- Price-to-rent
- 8.4×
Monthly cashflow live
- Estimated rent
- $1,590 high interval (Pro) →
- Mortgage (P&I)
- −$839
- Tax from tax record
- −$304 /mo · $3,651/yr
- Insurance
- −$67
- Flood insurance flood zone
- −$56 /mo · $670/yr
- HOA
- −$0
- Vacancy / Maint / Mgmt
- −$334
- Net cashflow
- $-9
Break-even live
Sensitivity live
| Price | -10% $81 | -5% $36 | +0% $-9 | +5% $-55 | +10% $-100 |
|---|---|---|---|---|---|
| Rent | -10% $-135 | -5% $-72 | +0% $-9 | +5% $53 | +10% $116 |
| Rate | -1.0pp $71 | -0.5pp $31 | base $-9 | +0.5pp $-51 | +1.0pp $-93 |
UW: 25.0% down · 7.5% · 30yr · 1.5% tax · 5.0% vac · 8.0% maint · 8.0% mgmt
Financing live
Cash to close
- Down payment
- $39,975
- Closing costs
- $4,797
- Reserves months
- —
- Total cash needed
- —
Loan-product check · same deal, 3 products live
Conventional
25% down · 7.5% · 30yr
- Down + closing
- —
- Monthly P&I
- —
- Monthly cashflow
- —
- DSCR
- —
- Eligible?
- —
Personal DTI + credit; lowest rate.
DSCR
20% down · 8.5% · 30yr
- Down + closing
- —
- Monthly P&I
- —
- Monthly cashflow
- —
- DSCR
- —
- Eligible?
- —
No personal income docs; deal must DSCR.
Hard money
10% down · 12.0% · 12mo
- Down + closing
- —
- Monthly P&I
- —
- Monthly cashflow
- —
- DSCR
- —
- Eligible?
- —
Short-term bridge; refi at stabilization.
Rent comps 21 comps
| Address | Beds | Baths | Sqft | Rent | $/sqft | DOM | Units | Dist |
|---|---|---|---|---|---|---|---|---|
| 1649 S Beltline Blvd Columbia, SC | 2.0 | 1.0 | 900 | $1,250 | $1.39 | 25d | 1 | 0.04mi |
| 1840 Tall Pines Cir Columbia, SC | 3.0 | 1.5 | 1021 | $1,350 | $1.32 | 16d | 1 | 0.21mi |
| 1324 Deerwood St Unit 1 Columbia, SC | 2.0 | 2.0 | 1030 | $1,350 | $1.31 | 25d | 1 | 0.42mi |
| 102 Burdock Cir Columbia, SC | 4.0 | 2.0 | 1451 | $1,550 | $1.07 | 23d | 1 | 0.71mi |
| 13 Acme St Columbia, SC | 3.0 | 1.0 | 900 | $1,300 | $1.44 | 25d | 1 | 0.75mi |
| 914 Chevis St Columbia, SC | 3.0 | 2.0 | 1280 | $2,100 | $1.64 | 25d | 1 | 0.80mi |
| 1 Tempo Ct Columbia, SC | 3.0 | 1.5 | 1032 | $1,745 | $1.69 | 25d | 1 | 0.89mi |
| 3901 Bright Ave Columbia, SC | 3.0 | 1.0 | 1047 | $1,380 | $1.32 | 16d | 1 | 0.91mi |
| 828 Suber St Unit E Columbia, SC | 2.0 | 1.0 | 1100 | $995 | $0.90 | 13d | 1 | 0.91mi |
| 21 Tempo Ct Columbia, SC | 3.0 | 1.5 | 1032 | $1,498 | $1.45 | 13d | 1 | 0.92mi |
| 721 Deerwood St Columbia, SC | 2.0 | 1.0 | 1000 | $1,150 | $1.15 | 16d | 1 | 0.96mi |
| 501 Pelham Dr Columbia, SC | 1.0–2.0 | 1.0–2.0 | 805 | $1,625 | $2.02 | 4d | 24 | 1.12mi |
| 3800 Overbrook Dr Columbia, SC | 4.0 | 2.0 | 1800 | $2,400 | $1.33 | 25d | 1 | 1.13mi |
| 3425 Manor Ave Columbia, SC | 3.0 | 2.0 | 1200 | $2,100 | $1.75 | 13d | 1 | 1.13mi |
| 3840 Overbrook Dr Columbia, SC | 2.0 | 2.0 | 900 | $1,595 | $1.77 | 25d | 1 | 1.14mi |
| 524 S Beltline Blvd Columbia, SC | 2.0 | 1.0 | 1050 | $1,300 | $1.24 | 25d | 1 | 1.15mi |
| 500 Gills Creek Pkwy Columbia, SC | 1.0–2.0 | 1.0–2.0 | 807 | $1,375 | $1.70 | 13d | 27 | 1.24mi |
| 2725 Kingswood Dr Columbia, SC | 3.0 | 1.0 | 940 | $1,500 | $1.60 | 25d | 1 | 1.43mi |
| 3925 Rosewood Dr Columbia, SC | 4.0 | 2.0 | 1683 | $4,800 | $2.85 | 25d | 1 | 1.45mi |
| 403 Wormwood Ln Unit H Columbia, SC | 2.0 | 2.0 | 1080 | $1,345 | $1.25 | 25d | 1 | 1.49mi |
| 1015 Walters Ln Columbia, SC | 3.0 | 2.0 | 1643 | $1,895 | $1.15 | 23d | 1 | 1.50mi |
Listing history 17 events
-
2026-06-03statusdays on market $159,900 Pending 137 DOM
-
2026-06-01days on market $159,900 Active - Contingent 136 DOM
-
2026-05-31days on market $159,900 Active - Contingent 135 DOM
-
2026-05-19historical Active - Contingent
-
2026-05-13price $159,900
-
2026-04-10price $169,900
-
2026-03-26price $179,900
-
2026-02-25price $184,900
-
2026-01-31price $189,900
-
2026-01-16$194,900 Active
-
2025-11-19price $199,900
-
2025-10-10price $214,900
-
2025-09-06$224,900 Active
-
2012-08-22soldstatus $108,000
-
2007-01-16soldstatus $104,000
-
2000-05-05soldstatus $88,000
-
1995-12-01soldstatus $59,125
ⓘ Source: listings_history table (triggers on properties + properties_extension) + one-shot
backfill from property_details.listing_events for pre-trigger history.
Tax reassessment forecast SC · Resets to sale price
- Current annual tax
- $3,651 · $304/mo
- Projected year-2 tax
- $3,651 · $304/mo
- Expected delta
- $0/yr ($0/mo · 0.0%)
ⓘ Screening estimate from a state-policy table — verify with the county assessor before closing.
Climate risk First Street
- Flood 7/10 Severe FEMA zone X · 99% chance over 30 yrs
- Wildfire 2/10 Low
- Heat 7/10 Severe
Nearby sold comps map
Loading sold comps map…
Walkable amenities ~0.75 mi
Loading nearby amenities…
Taxation est. · year 1
- Rental income
- $19,075
- − Mortgage interest
- −$8,957
- − Property taxes
- −$3,651
- − Insurance
- −$1,470
- − Repairs & maintenance
- −$1,526
- − Management
- −$1,526
- − Depreciation
- −$4,652
- Taxable loss
- −$2,706
- Est. tax savings @ 24.0%
- +$649
- After-tax cash flow
- $536/yr
For passive investors: Depreciation is non-cash, so a rental often shows a tax loss while cash-flowing — sheltering income. Rental losses are passive: they offset passive income freely, and up to $25,000/yr can offset ordinary (W-2) income if you actively participate and your MAGI is under $100k (phasing out to $0 by $150k); unused losses carry forward. On sale, claimed depreciation is recaptured at up to 25%, and gains may owe capital-gains tax (a 1031 exchange can defer both). Figures are a year-1 estimate at your 24.0% rate — not tax advice; consult a CPA.
Schools (NCES district)
- District
- Richland 01
- NCES district ID
- 4503360
- Math proficiency
- 26% ▼ -7.00%
- Reading proficiency
- 36% ▼ -5.00%
- Median HH income
- $38,931
- Composite
- 25.94/100
- National rank
- #7335
- State rank
- #54 of 80 in SC
Livability — Columbia
- Score
- 78/100
- State rank
- #18
- US rank
- #2436
Category grades
Schools grade is shown separately in the Schools card above.
Census & demographics
- County
- Richland County · 389,530 people
- City population
- 335,994
- Metro
- Columbia, SC
- Population (ZIP)
- 22,223
- Household income
- $64,231
- Rent vs Own
- Severe rent burden
- 1372.0
Population outlook (Richland County) Hauer SSP2
- Today (2025)
- 459,667 people
- By 2030
- 487,524 · +6.1%
- By 2040
- 542,035 · +17.9%
- By 2050
- 595,371 · +29.5%
- By 2075
- 732,998 · +59.5%
- By 2100
- 820,415 · +78.5%
Race, ethnicity, and origin ACS 2023
- Neighborhood character
- Predominantly White (73%)
- Race & ethnicity
- White 73% Black 16% Two or more races 6% Hispanic / Latino 5% Asian 3%
- Common ancestry
- Serbian 6% Slovak 4% Lithuanian 3%
- Foreign-born
- 4% · Canada, China
- Languages at home
- 93% English-only · Spanish 3% German/W. Germanic 1% Chinese 1%
Political lean MEDSL · Richland
- 2024 margin
- Solid D (+34.6) · D 66.4% · R 31.8% · Other 1.8%
- 2008→2024 swing
- +5.7pp toward D · 2008: 28.9pp · 2024: 34.6pp
- All cycles
- 2024: D+34.6 2020: D+38.3 2016: D+32.9 2012: D+33.3 2008: D+28.9
Not yet ingested
- Civics
- —
Market trends
- HPI YoY
- ▼ -457.47%
- Current HPI
- 230.5538
- Rent YoY
- ▲ 6.95%
- Metro
- Columbia, SC
- State GDP YoY
- ▲ 4.51%
- F500 in state
- 2
Industry mix (Fortune 500 HQ in SC)
| Industry | F500 HQs | Revenue |
|---|---|---|
| Packaging | 1 | $7B |
|
||
Price history
+170.4% since first listed14 events — show timeline
- 2026-05-19 Contingent — Consolidated MLS
- 2026-05-13 Price Changed $159,900 Consolidated MLS
- 2026-04-10 Price Changed $169,900 Consolidated MLS
- 2026-03-26 Price Changed $179,900 Consolidated MLS
- 2026-02-25 Price Changed $184,900 Consolidated MLS
- 2026-01-31 Price Changed $189,900 Consolidated MLS
- 2026-01-16 Listed $194,900 Consolidated MLS
- 2025-11-19 Price Changed $199,900 Consolidated MLS
- 2025-10-10 Price Changed $214,900 Consolidated MLS
- 2025-09-06 Listed $224,900 Consolidated MLS
- 2012-08-22 Sold (Public Records) $108,000 Public Records
- 2007-01-16 Sold (Public Records) $104,000 Public Records
- 2000-05-05 Sold (Public Records) $88,000 Public Records
- 1995-12-01 Sold (Public Records) $59,125 Public Records
Property tax history
+12.3%/yrLatest (2025): $3,651 · +2.5% YoY. Source: county tax records.
Cash-flow waterfall
monthlySold comps — $/sqft
last 12 mo · ≤1 miLoading sold comps…