 🏗️ New Construction
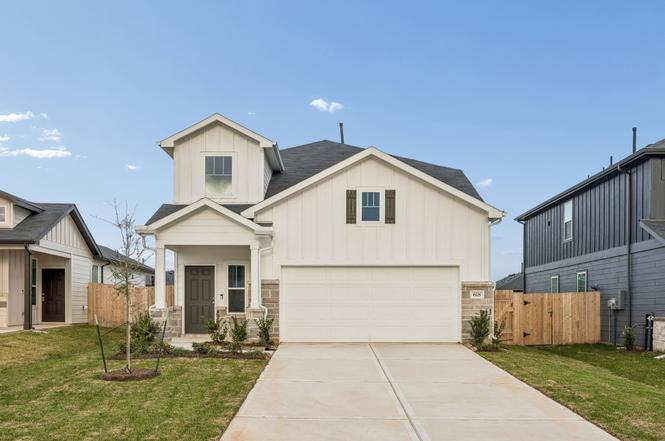
618 Amber Falls Dr · Montgomery, TX
Flood risk No data
- FEMA flood zone
- —
- Chance of flooding over 30 yrs
- —
- Est. flood insurance / yr
- —
Fire risk No data
- Est. fire insurance / yr
- —
Heat risk No data
- Hot days now (above threshold)
- —
- Hot days in 30 yrs
- —
Wind risk No data
- Chance of severe wind over 30 yrs
- —
Air-quality risk No data
- Unhealthy air days now
- —
- Unhealthy air days in 30 yrs
- —
Risk factors via First Street. Map © Google.
Why this score? — see what drove the D grade
The composite is a weighted blend of 9 inputs, each scored 0–100. Each bar is that input's sub-score; the figure is the points it added to the 100-point composite (weight × sub-score).
- Cash flow +12.9/30.0
- ARV discount +7.5/15.0
- Schools +5.4/10.0
- DSCR +3.9/10.0
- Livability +3.5/5.0
- 1% rule +2.8/10.0
- Condition / age +2.5/5.0
- Rent growth +1.7/5.0
- Appreciation +0.0/10.0
$299,600
🖨 Deal sheet (PDF) 📄 Offer letter ✓ Due diligence
Listing remarks
Welcome to the Gustine floorplan by Centex—where space, style, and functionality meet! This 4-bedroom, 2.5-bath home features open-concept living with a spacious kitchen offering stainless steel appliances, granite countertops, gas cooking, a working island, and abundant cabinet space. Downstairs includes a large laundry room and a versatile flex space perfect for a home office, playroom, or schoolroom. The primary suite boasts a spa shower, an extended vanity, and our largest walk-in closet. Upstairs, enjoy a roomy game room and three additional bedrooms. Outside, relax on the covered patio overlooking a fenced, sodded yard with a sprinkler system and gutters. Community amenities inc
Key facts
- Gas cooking
- Spacious kitchen
- Working island
Tags
Property features AI
Finance
- HOA & community: Community association managed by Inframark; Annual association fee of $1,000; Community features include a community pool, curbs, and gutters
Exterior
- Parking: Attached garage; 2-car garage
- Security: Smoke detectors
- Utilities: Public water
- Home design: Residential property; New construction (2025); Faces west; Slab foundation
- Construction: Built in 2025; Stone and wood siding exterior; Composition roof
- Exterior features: Covered patio; Patio and deck; Sprinkler/irrigation system; Concrete road access; Located in a subdivision
Interior
- Kitchen: Dishwasher; Disposal; Gas oven; Gas range; Microwave; Oven; Kitchen island (open workspace)
- Bedrooms: Primary bedroom on the first floor; Three additional bedrooms on the second floor; Bedroom sizes include 13x14 (primary), 12x10, 12x10, and 11x10; Total of 8 rooms (includes living and bonus/game spaces)
- Flooring: Carpet; Plank flooring; Vinyl
- Bathrooms: 2 full bathrooms; 1 half bathroom
- Heating & cooling: Central heating (gas); Central air conditioning (electric)
- Interior features: High ceilings; Kitchen island; Tub with shower
- Laundry & utility: Washer/dryer hookup (standard utility provisions)
Neighborhood map
What this means for you Summary
Snapshot
- This is a 4-bed/2.5-bath land listed at $300k.
Deal economics
- At list price, monthly cash flow is $-21 ($-252/yr) — negative.
- To cash-flow at today's rent, offer at most $296k (1.2% below list).
- To meet the 1% rule (rent ≥ 1% of price), the offer needs to be $233k (22.4% below list).
- Recommended offer: $233k (22.4% below list) — sets the bar for 1% rule.
- Cap rate 6.2% vs local median 2.0% in Montgomery — top-decile yield for the area; either an underpriced asset or a hidden risk that comps aren't pricing in. Stress-test before assuming the spread holds.
Location & tenants
- Location reads 70/100 on livability (#372 in TX) — a middle-class / working-renter tenant base. Strengths: crime A+, employment A+, housing A+; Watch: amenities F, commute F, health & safety F.
- Montgomery ISD (rural): math 63% / reading 57% proficiency, ranked #49 of 826 in TX (top 6%) — acceptable for families but not a draw, mixed tenant base, ~2y average lease.
- Zoned schools: Montgomery El (math 50% / reading 50%, grade D+, #849 of 4,322 statewide, top 20%, 595 students, 45% FRL); Montgomery J H (math 68% / reading 54%, grade B+, #145 of 1,662 statewide, top 9%, 1,045 students, 30% FRL); Montgomery H S (math 53% / reading 62%, grade C, #327 of 1,632 statewide, top 20%, 1,556 students, 25% FRL).
- Market conditions: Rents falling (-3.3%/yr); 1069 active listings in the ZIP; solid renter incomes; 13,259 units permitted in Montgomery County in 2024 (1,402 in 5+ unit buildings).
Forward outlook
- Local home prices are declining (-3.0%/yr); year-one equity from $2k of loan paydown is wiped out by about $9k of value loss. Plan a longer hold.
- Montgomery County population projected at +65% by 2050 — long-run rental-demand tailwind backs the buy-and-hold thesis.
Negotiation context
- It's been on market 109 days — a 9% lower offer ($273k) is reasonable based on typical stale-listing flexibility.
- 4 sale attempts; this cycle's ask has dropped $24k (7%) from the opening price — seller is motivated, your offer sets the floor, not the list.
Questions for the listing agent
- What do current leases actually rent for vs. the listed asking? Can we see a recent rent roll and the last 12 months of T-12 income?
- It's been on market 109 days. Have you received any prior offers? Is the seller open to a 22% concession, seller financing, or rate buy-down credit?
- What does the HOA fee cover, when was the last increase, and are there any pending special assessments or reserve-fund shortfalls?
- Why hasn't it sold? Are there any deal-killer items the seller is aware of (foundation, flood, title, zoning, code violations)?
- Is there a deadline driving the sale (1031 exchange, divorce, estate, relocation)? That informs how much negotiation room exists.
- Schools are B-rated — typically a magnet for longer-tenancy family renters. What's the average tenant stay here, and is there a school-zone premium baked into asking?
- The area grade is low — what's the realistic commute time and amenity access for the typical tenant pool here? Any planned neighborhood developments (good or bad) we should know about?
- What's the average days-on-market for RENTAL listings here right now (not sales)? A rising rental-DOM trend means longer vacancies and softer asking-rent achievability than the comps imply.
- What's the recent tenant-quality profile in this submarket — average credit score on applications, eviction rate, late-payment / NSF rate, and stable-employment percentage? A property-management company in the area should have these aggregated.
- How much new for-sale + rental construction is in the pipeline within 1–3 miles? Heavy new supply typically softens prices + rents 12–24 months out; constrained supply supports both.
Investment metrics
- 1% rule
- 0.78% ✗
- Cap rate
- 6.21%
- Cash-on-cash
- -0.30%
- DSCR
- 0.99
- GRM
- 10.7
CMA / ARV
No comps found within radius.
Projected returns pro-forma
-3.0% appreciation · 0.0% rent growth · sell at horizon
- IRR
- -19.9%
- Equity multiple
- 0.32×
- Total profit
- $-56,795
- Equity at exit
- $44,671
- IRR
- -20.1%
- Equity multiple
- 0.07×
- Total profit
- $-77,902
- Equity at exit
- $25,904
Cash invested: $83,888 (down + closing). Projections, not guarantees.
Landlord ↔ Tenant lean methodology
- Overall (STATE)
- 87 Strongly Landlord-Friendly
- State Texas
- 87 Strongly Landlord-Friendly · R+5
- County
- — inherits STATE
- City
- — inherits STATE
ZIP-level market 77356
- Home prices YoY
- -30.3%
- Rents YoY
- -3.3%
- Active inventory
- 1069
- Price-to-rent
- 10.7×
Monthly cashflow live
- Estimated rent
- $2,325 medium interval (Pro) →
- Mortgage (P&I)
- −$1,571
- Tax from tax record
- −$79 /mo · $948/yr
- Insurance
- −$125
- HOA
- −$83
- Vacancy / Maint / Mgmt
- −$488
- Net cashflow
- $-21
Break-even live
Sensitivity live
| Price | -10% $149 | -5% $64 | +0% $-21 | +5% $-106 | +10% $-191 |
|---|---|---|---|---|---|
| Rent | -10% $-205 | -5% $-113 | +0% $-21 | +5% $71 | +10% $163 |
| Rate | -1.0pp $130 | -0.5pp $55 | base $-21 | +0.5pp $-99 | +1.0pp $-178 |
UW: 25.0% down · 7.5% · 30yr · 1.5% tax · 5.0% vac · 8.0% maint · 8.0% mgmt
Financing live
Cash to close
- Down payment
- $74,900
- Closing costs
- $8,988
- Reserves months
- —
- Total cash needed
- —
Loan-product check · same deal, 3 products live
Conventional
25% down · 7.5% · 30yr
- Down + closing
- —
- Monthly P&I
- —
- Monthly cashflow
- —
- DSCR
- —
- Eligible?
- —
Personal DTI + credit; lowest rate.
DSCR
20% down · 8.5% · 30yr
- Down + closing
- —
- Monthly P&I
- —
- Monthly cashflow
- —
- DSCR
- —
- Eligible?
- —
No personal income docs; deal must DSCR.
Hard money
10% down · 12.0% · 12mo
- Down + closing
- —
- Monthly P&I
- —
- Monthly cashflow
- —
- DSCR
- —
- Eligible?
- —
Short-term bridge; refi at stabilization.
HOA detail
- Monthly dues
- $83 · $996/yr
- Likely covers
- gas
Listing history 18 events
-
2026-06-02status $299,600 Pending 109 DOM
-
2026-06-01days on market $299,600 Active 109 DOM
-
2026-05-31days on market $299,600 Active 108 DOM
-
2026-05-22status Active
-
2026-04-18status Pending
-
2026-04-11price $299,600
-
2026-02-20price $309,790
-
2026-01-10price $323,280
-
2026-01-10price $307,990
-
2026-01-09$323,280 Active
-
2026-01-09historical
-
2025-11-11price $323,280
-
2025-09-16price $328,060
-
2025-09-16$339,180 Active
-
2025-09-16historical
-
2025-07-17price $328,060
-
2025-07-09price $319,780
-
2025-06-10$339,180 Active
ⓘ Source: listings_history table (triggers on properties + properties_extension) + one-shot
backfill from property_details.listing_events for pre-trigger history.
Tax reassessment forecast TX · Resets to sale price
- Current annual tax
- $948 · $79/mo
- Projected year-2 tax
- $5,483 · $457/mo
- Expected delta
- +$4,534/yr (+$378/mo · 478.1%)
ⓘ Screening estimate from a state-policy table — verify with the county assessor before closing.
Nearby sold comps map
Loading sold comps map…
Walkable amenities ~0.75 mi
Loading nearby amenities…
Taxation est. · year 1
- Rental income
- $27,904
- − Mortgage interest
- −$16,782
- − Property taxes
- −$948
- − Insurance
- −$1,498
- − Repairs & maintenance
- −$2,232
- − Management
- −$2,232
- − HOA
- −$996
- − Depreciation
- −$8,716
- Taxable loss
- −$5,501
- Est. tax savings @ 24.0%
- +$1,320
- After-tax cash flow
- $1,068/yr
For passive investors: Depreciation is non-cash, so a rental often shows a tax loss while cash-flowing — sheltering income. Rental losses are passive: they offset passive income freely, and up to $25,000/yr can offset ordinary (W-2) income if you actively participate and your MAGI is under $100k (phasing out to $0 by $150k); unused losses carry forward. On sale, claimed depreciation is recaptured at up to 25%, and gains may owe capital-gains tax (a 1031 exchange can defer both). Figures are a year-1 estimate at your 24.0% rate — not tax advice; consult a CPA.
Schools (NCES district)
- District
- Montgomery ISD
- NCES district ID
- 4831260
- Math proficiency
- 63% ▼ -3.00%
- Reading proficiency
- 57% ▼ -3.00%
- Median HH income
- $75,596
- Composite
- 53.55/100
- National rank
- #1445
- State rank
- #49 of 826 in TX
Livability — Montgomery
- Score
- 70/100
- State rank
- #372
- US rank
- #7894
Category grades
Schools grade is shown separately in the Schools card above.
Census & demographics
- County
- Montgomery County · 663,713 people
- City population
- 67,277
- Metro
- Houston-The Woodlands-Sugar Land, TX
- Population (ZIP)
- 32,583
- Household income
- $106,804
- Rent vs Own
- Severe rent burden
- 414.0
Population outlook (Montgomery County) Hauer SSP2
- Today (2025)
- 713,896 people
- By 2030
- 805,263 · +12.8%
- By 2040
- 992,708 · +39.1%
- By 2050
- 1,179,590 · +65.2%
- By 2075
- 1,628,084 · +128.1%
- By 2100
- 1,937,880 · +171.5%
Race, ethnicity, and origin ACS 2023
- Neighborhood character
- Predominantly White (87%)
- Race & ethnicity
- White 87% Two or more races 5% Hispanic / Latino 5% Black 4%
- Common ancestry
- Lithuanian 8% Slovak 2% Romanian 2%
- Foreign-born
- 3% · Canada, China
- Languages at home
- 96% English-only · Spanish 3%
Political lean MEDSL · Montgomery
- 2024 margin
- Solid R (+45.5) · D 26.8% · R 72.3%
- 2008→2024 swing
- +7.2pp toward D · 2008: -52.7pp · 2024: -45.5pp
- All cycles
- 2024: R+45.5 2020: R+43.8 2016: R+51.4 2012: R+60.7 2008: R+52.7
Not yet ingested
- Civics
- —
Market trends
- HPI YoY
- ▼ -101.28%
- Current HPI
- 233.0032
- Rent YoY
- ▼ -3.30%
- Metro
- Houston-The Woodlands-Sugar Land, TX
- State GDP YoY
- ▲ 3.95%
- F500 in state
- 110
Industry mix (Fortune 500 HQ in TX)
| Industry | F500 HQs | Revenue |
|---|---|---|
| Energy | 16 | $1,198B |
|
||
| Technology | 5 | $198B |
|
||
| Engineering / Construction | 4 | $72B |
|
||
| Energy Services | 3 | $60B |
|
||
| Utilities | 3 | $41B |
|
||
| Healthcare | 2 | $330B |
|
||
Price history
-11.7% since first listed15 events — show timeline
- 2026-05-22 Relisted — HARMLS
- 2026-04-18 Pending — HARMLS
- 2026-04-11 Price Changed $299,600 HARMLS
- 2026-02-20 Price Changed $309,790 HARMLS
- 2026-01-10 Price Changed $323,280 HARMLS
- 2026-01-10 Price Changed $307,990 HARMLS
- 2026-01-09 Listing Removed — HARMLS
- 2026-01-09 Listed $323,280 HARMLS
- 2025-11-11 Price Changed $323,280 HARMLS
- 2025-09-16 Price Changed $328,060 HARMLS
- 2025-09-16 Listing Removed — HARMLS
- 2025-09-16 Listed $339,180 HARMLS
- 2025-07-17 Price Changed $328,060 HARMLS
- 2025-07-09 Price Changed $319,780 HARMLS
- 2025-06-10 Listed $339,180 HARMLS
Cash-flow waterfall
monthlySold comps — $/sqft
last 12 mo · ≤1 miLoading sold comps…