 13-Plex
98413 Ok-100 Hwy · Notchietown, OK
Flood risk No data
- FEMA flood zone
- —
- Chance of flooding over 30 yrs
- —
- Est. flood insurance / yr
- —
Fire risk No data
- Est. fire insurance / yr
- —
Heat risk 6/10 · Moderate
- Hot days now (above threshold)
- 7 days/yr
- Hot days in 30 yrs
- 20 days/yr
Wind risk No data
- Chance of severe wind over 30 yrs
- —
Air-quality risk 2/10 · Minimal
- Unhealthy air days now
- 0 days/yr
- Unhealthy air days in 30 yrs
- 1 days/yr
Risk factors via First Street. Map © Google.
Why this score? — see what drove the D+ grade
The composite is a weighted blend of 9 inputs, each scored 0–100. Each bar is that input's sub-score; the figure is the points it added to the 100-point composite (weight × sub-score).
- Cash flow +12.4/30.0
- Appreciation +10.0/10.0
- ARV discount +7.5/15.0
- Condition / age +3.8/5.0
- DSCR +3.7/10.0
- 1% rule +3.5/10.0
- Livability +3.1/5.0
- Rent growth +2.5/5.0
- Schools +1.7/10.0
$1,150,777
🖨 Deal sheet 📄 Offer letter ✓ Due diligence
Multi-family units
County records classify this as Multi-Family (5+ Unit). Listing-text estimate: 13 units. confirmed
5+ unit building — per-unit beds/baths from public records are typically unavailable; the breakdown below (if shown) is an estimate from the listing text.
Listing remarks
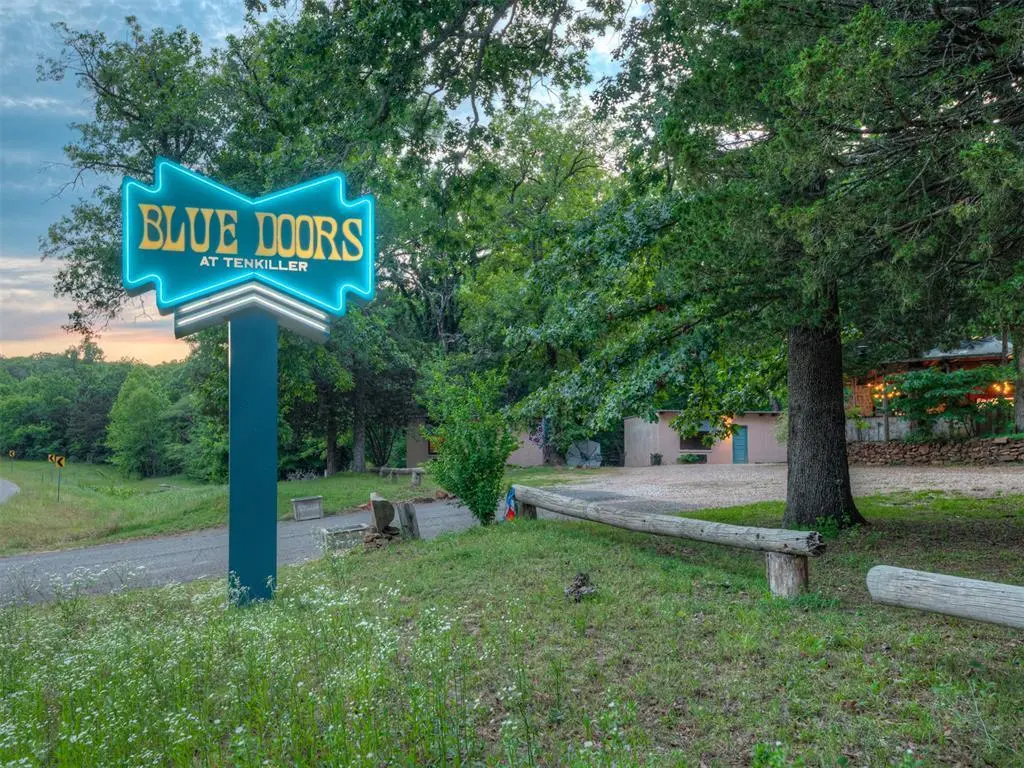
As of May 31st, 2026 Current Gross Income: 174K Current Net Income: 131K Discover Blue Doors at Tenkiller, a fully reimagined 13-unit boutique motor court motel set on approximately 11 wooded acres bordering Tenkiller State Park and the Lower Illinois River. This turnkey hospitality investment combines modern design, strong income performance, and long-term expansion potential in one of Oklahoma’s most desirable recreation areas. Guests are greeted by a large custom neon-style entrance sign, a bold, eye-catching landmark that reinforces the property’s unique brand identity and strong curb appeal. Blue Doors maintains a loyal weekend and seasonal guest base with an outstanding r
Key facts
- 10.8 acre lot
- 50 parking spots
- Built 1954
Tags
Property features AI
Finance
- Other: Property listed as residential income with multi-unit configuration
- Financial info: Occupied, rented/leased; Listing active as of last update
Exterior
- Parking: Space for 50 vehicles; Gravel parking
- Utilities: No flood insurance on record
- Home design: Residential income property; More than 4 units (13 units); One-level layout; Existing construction
- Construction: Concrete, frame and stucco construction; Metal roof; Slab foundation; Built on approximately 10.8 acres
- Exterior features: Greenbelt; Rural setting; Wooded
Interior
- Kitchen: Microwave; Refrigerator
- Bedrooms: 13 bedrooms
- Bathrooms: 13 full bathrooms; 1 half bathroom
- Heating & cooling: Other heating; Other cooling
- Interior features: Indoor grill; Water heater
- Laundry & utility: Washer and dryer included
Neighborhood map
What this means for you Summary
Snapshot
- This is a 13 × 1-bed/1-bath units multifamily listed at $1.15M. Condition is rated good.
Deal economics
- At list price, monthly cash flow is $-186 ($-2k/yr) — negative. Per door: $-14/mo.
- To cash-flow at today's rent, offer at most $1.12M (2.3% below list).
- To meet the 1% rule (rent ≥ 1% of price), the offer needs to be $983k (14.6% below list).
- Recommended offer: $983k (14.6% below list) — sets the bar for 1% rule.
Location & tenants
- Location reads 61/100 on livability (#281 in OK) — a middle-class / working-renter tenant base. Strengths: cost of living A+, housing A+, employment B; Watch: health & safety C-, crime F, amenities F.
- Gore (rural): math 20% / reading 20% proficiency, ranked #175 of 270 in OK (top 65%) — low school quality limits family demand, transient renter base, plan for 1-2y turnover; 62% free/reduced lunch — lower-income household profile, screen leases tightly.
- Zoned schools: Gore Es (math 27% / reading 22%, grade F, #354 of 845 statewide, top 47%, 248 students, 0% FRL); Gore Hs (math 15% / reading 15%, grade F, #323 of 447 statewide, top 74%, 161 students, 0% FRL) — zoned schools average 0% FRL vs 62% district-wide (62 pts lower); this property's tenant base skews higher-income than the district average.
- Market conditions: 36 active listings in the ZIP; 125 units permitted in Sequoyah County in 2024 (0 in 5+ unit buildings).
Forward outlook
- In year one you build about $123k of equity ($8k loan paydown + $115k appreciation (10.0% local appreciation)).
- Sequoyah County population projected at -16% by 2050 — secular population decline; favor cash flow + early exit over multi-decade hold.
- By year 2, paydown + projected appreciation supports a ~$198k cash-out refi (75% LTV) — recoverable capital for the next deal without selling this one.
Negotiation context
- It's been on market 31 days — a 3% lower offer ($1.12M) is reasonable based on typical stale-listing flexibility.
- 2 sale attempts with the ask held roughly flat each time — persistent listings suggest the price (not the market) is what's stuck; bring a comps-based counter.
Risks & watch-outs
- Watch-outs: built in 1954 — expect roof / HVAC / electrical / plumbing capex.
- Climate carrying-cost: extreme-heat days projected 7→20/yr by 2055 (HVAC capex compounding) — expect insurance premiums to compound above CPI over the hold.
Questions for the listing agent
- What do current leases actually rent for vs. the listed asking? Can we see a recent rent roll and the last 12 months of T-12 income?
- It's been on market 31 days. Have you received any prior offers? Is the seller open to a 15% concession, seller financing, or rate buy-down credit?
- Can we see the unit-by-unit rent roll, current vacancy, and any below-market leases? What's the average tenancy length?
- What capital expenditures (roof, boiler, parking lot, exteriors) have been made in the last 5 years, and what's planned in the next 2?
- Built in 1954 — when were the roof, HVAC, electrical panel, plumbing, and water heater last replaced?
- Is there a deadline driving the sale (1031 exchange, divorce, estate, relocation)? That informs how much negotiation room exists.
- Schools are F-rated, which usually means shorter tenancies and higher turnover. Who's the typical renter profile here, and what's been the actual vacancy rate?
- Crime grade is F in this area — have there been break-ins, vandalism, or insurance claims at this property in the last 3 years? What carrier currently insures it and at what premium?
- The area grade is low — what's the realistic commute time and amenity access for the typical tenant pool here? Any planned neighborhood developments (good or bad) we should know about?
- What's the average days-on-market for RENTAL listings here right now (not sales)? A rising rental-DOM trend means longer vacancies and softer asking-rent achievability than the comps imply.
- What's the recent tenant-quality profile in this submarket — average credit score on applications, eviction rate, late-payment / NSF rate, and stable-employment percentage? A property-management company in the area should have these aggregated.
- How much new apartment / multifamily construction is in the pipeline within 1–3 miles? Heavy new supply (>2% of stock underway) typically softens rents 12–24 months out; light construction supports rent growth.
Investment metrics
- 1% rule
- 0.85% ✗
- Cap rate
- 6.10%
- Cash-on-cash
- -0.69%
- DSCR
- 0.97
- GRM
- 9.8
CMA / ARV
No comps found within radius.
Projected returns pro-forma
10.0% appreciation · 3.0% rent growth · sell at horizon
- IRR
- 23.8%
- Equity multiple
- 2.91×
- Total profit
- $615,028
- Equity at exit
- $1,036,711
- IRR
- 21.1%
- Equity multiple
- 6.65×
- Total profit
- $1,820,781
- Equity at exit
- $2,235,707
Cash invested: $322,218 (down + closing). Projections, not guarantees.
Landlord ↔ Tenant lean methodology
- Overall (STATE)
- 83 Strongly Landlord-Friendly
- State Oklahoma
- 83 Strongly Landlord-Friendly · R+20
- County
- — inherits STATE
- City
- — inherits STATE
ZIP-level market 74435
- Home prices YoY
- 3.6%
- Active inventory
- 36
- Price-to-rent
- 126.8×
Monthly cashflow live
- Estimated rent
- $9,831 medium interval (Pro) →
- Mortgage (P&I)
- −$6,035
- Tax est. 1.5%
- −$1,438 /mo · $17,262/yr
- Insurance
- −$479
- HOA
- −$0
- Vacancy / Maint / Mgmt
- −$2,065
- Net cashflow
- $-186
Break-even live
13-unit breakdown (identical units grouped — click to expand)
| Units | Beds | Baths | Est. rent |
|---|---|---|---|
| 13× units | 1 | 1 | $9,828 |
| #1 | 1 | 1 | $756 |
| #2 | 1 | 1 | $756 |
| #3 | 1 | 1 | $756 |
| #4 | 1 | 1 | $756 |
| #5 | 1 | 1 | $756 |
| #6 | 1 | 1 | $756 |
| #7 | 1 | 1 | $756 |
| #8 | 1 | 1 | $756 |
| #9 | 1 | 1 | $756 |
| #10 | 1 | 1 | $756 |
| #11 | 1 | 1 | $756 |
| #12 | 1 | 1 | $756 |
| #13 | 1 | 1 | $756 |
| Total (13 units) | $9,831 | ||
UW: 25.0% down · 7.5% · 30yr · 1.5% tax · 5.0% vac · 8.0% maint · 8.0% mgmt
Financing live
Cash to close
- Down payment
- $287,694
- Closing costs
- $34,523
- Reserves months
- —
- Total cash needed
- —
Loan-product check · same deal, 3 products live
Conventional
25% down · 7.5% · 30yr
- Down + closing
- —
- Monthly P&I
- —
- Monthly cashflow
- —
- DSCR
- —
- Eligible?
- —
Personal DTI + credit; lowest rate.
DSCR
20% down · 8.5% · 30yr
- Down + closing
- —
- Monthly P&I
- —
- Monthly cashflow
- —
- DSCR
- —
- Eligible?
- —
No personal income docs; deal must DSCR.
Hard money
10% down · 12.0% · 12mo
- Down + closing
- —
- Monthly P&I
- —
- Monthly cashflow
- —
- DSCR
- —
- Eligible?
- —
Short-term bridge; refi at stabilization.
Listing history 21 events
-
2026-06-19days on market $1,150,777 Active 31 DOM
-
2026-06-18days on market $1,150,777 Active 30 DOM
-
2026-06-17days on market $1,150,777 Active 29 DOM
-
2026-06-16days on market $1,150,777 Active 28 DOM
-
2026-06-15days on market $1,150,777 Active 27 DOM
-
2026-06-14days on market $1,150,777 Active 25 DOM
-
2026-06-12days on market $1,150,777 Active 24 DOM
-
2026-06-09days on market $1,150,777 Active 21 DOM
-
2026-06-08days on market $1,150,777 Active 20 DOM
-
2026-06-07days on market $1,150,777 Active 19 DOM
-
2026-06-05days on market $1,150,777 Active 16 DOM
-
2026-06-03days on market $1,150,777 Active 15 DOM
-
2026-06-02days on market $1,150,777 Active 14 DOM
-
2026-06-01days on market $1,150,777 Active 13 DOM
-
2026-05-31days on market $1,150,777 Active 12 DOM
-
2026-05-30days on market $1,150,777 Active 11 DOM
-
2026-05-19$1,150,777 Active
-
2026-03-31historical
-
2026-03-26price $1,199,777
-
2026-01-20price $1,222,777
-
2025-10-09$1,297,777 Active
ⓘ Source: listings_history table (triggers on properties + properties_extension) + one-shot
backfill from property_details.listing_events for pre-trigger history.
Climate risk First Street
- Heat 6/10 Major
- Air quality 2/10 Low 0 unhealthy d/yr today · 1 by 30 yrs out
Nearby sold comps map
Loading sold comps map…
Walkable amenities ~0.75 mi
Loading nearby amenities…
Taxation est. · year 1
- Rental income
- $117,972
- − Mortgage interest
- −$64,461
- − Property taxes
- −$17,262
- − Insurance
- −$5,754
- − Repairs & maintenance
- −$9,438
- − Management
- −$9,438
- − Depreciation
- −$33,477
- Taxable loss
- −$21,858
- Est. tax savings @ 24.0%
- +$5,246
- After-tax cash flow
- $3,011/yr
For passive investors: Depreciation is non-cash, so a rental often shows a tax loss while cash-flowing — sheltering income. Rental losses are passive: they offset passive income freely, and up to $25,000/yr can offset ordinary (W-2) income if you actively participate and your MAGI is under $100k (phasing out to $0 by $150k); unused losses carry forward. On sale, claimed depreciation is recaptured at up to 25%, and gains may owe capital-gains tax (a 1031 exchange can defer both). Figures are a year-1 estimate at your 24.0% rate — not tax advice; consult a CPA.
Condition & rehab AI · 12 photos
This fully reimagined 13-unit boutique motor court motel is in good condition with a strong income performance and long-term expansion potential. The property's unique brand identity and strong curb appeal make it a great investment opportunity.
Value-add opportunities
- Both Landscaping improvements — Enhancing the landscaping can improve both the resale and rental value by making the property more attractive and inviting.
- Both Painting exterior walls — Refreshing the exterior walls can improve the curb appeal and potentially increase the property's value.
- Both Upgrading HVAC system — A modern and efficient HVAC system can improve comfort and energy efficiency, which can increase both the resale and rental value.
Renovation cost estimate screening
Value-add ROI direction
- Both Landscaping improvements — Enhancing the landscaping can improve both the resale and rental value by making the property more attractive and inviting. ↑
- Both Painting exterior walls — Refreshing the exterior walls can improve the curb appeal and potentially increase the property's value. ↑
- Both Upgrading HVAC system — A modern and efficient HVAC system can improve comfort and energy efficiency, which can increase both the resale and rental value. ↑
ⓘ Cost ranges are severity-bucket heuristics (US national rule-of-thumb). Get contractor quotes + a written scope before underwriting a rehab budget.
Schools (NCES district)
- District
- Gore
- NCES district ID
- 4012900
- Math proficiency
- 20% ▼ -4.00%
- Reading proficiency
- 20% ▼ -11.00%
- Median HH income
- $39,777
- Composite
- 16.94/100
- National rank
- #9137
- State rank
- #175 of 270 in OK
Livability — Notchietown
- Score
- 61/100
- State rank
- #281
- US rank
- #17462
Category grades
Schools grade is shown separately in the Schools card above.
Census & demographics
- Census place
- Notchietown, OK
- City population
- 3,004
- Population (ZIP)
- 3,004
Population outlook (Sequoyah County) Hauer SSP2
- Today (2025)
- 39,398 people
- By 2030
- 38,215 · -3.0%
- By 2040
- 35,625 · -9.6%
- By 2050
- 32,943 · -16.4%
- By 2075
- 27,805 · -29.4%
- By 2100
- 23,311 · -40.8%
Race, ethnicity, and origin ACS 2023
- Neighborhood character
- Diverse neighborhood (Simpson 0.61)
- Race & ethnicity
- White 62% Native American 22% Two or more races 12% Hispanic / Latino 3%
- Common ancestry
- Lithuanian 1% Italian 1% Iranian 1%
- Foreign-born
- 0%
- Languages at home
- 97% English-only · French/Haitian/Cajun 1% Other Asian/Pacific 1%
Political lean MEDSL · Sequoyah
- 2024 margin
- Solid R (+61.5) · D 18.6% · R 80.2% · Other 1.2%
- 2008→2024 swing
- -25.5pp toward R · 2008: -36.0pp · 2024: -61.5pp
- All cycles
- 2024: R+61.5 2020: R+59.0 2016: R+54.2 2012: R+39.1 2008: R+36.0
Not yet ingested
- Civics
- —
Market trends
- HPI YoY
- ▲ 10.15%
- Current HPI
- 288.8974
- Rent YoY
- —
- Metro
- —
- State GDP YoY
- ▲ 1.55%
- F500 in state
- 6
Industry mix (Fortune 500 HQ in OK)
| Industry | F500 HQs | Revenue |
|---|---|---|
| Energy | 3 | $48B |
|
||
Price history
-11.3% since first listed5 events — show timeline
- 2026-05-19 Listed $1,150,777 MLSOK
- 2026-03-31 Listing Removed — MLSOK
- 2026-03-26 Price Changed $1,199,777 MLSOK
- 2026-01-20 Price Changed $1,222,777 MLSOK
- 2025-10-09 Listed $1,297,777 MLSOK
Cash-flow waterfall
monthlySold comps — $/sqft
last 12 mo · ≤1 miLoading sold comps…