 Multi-family
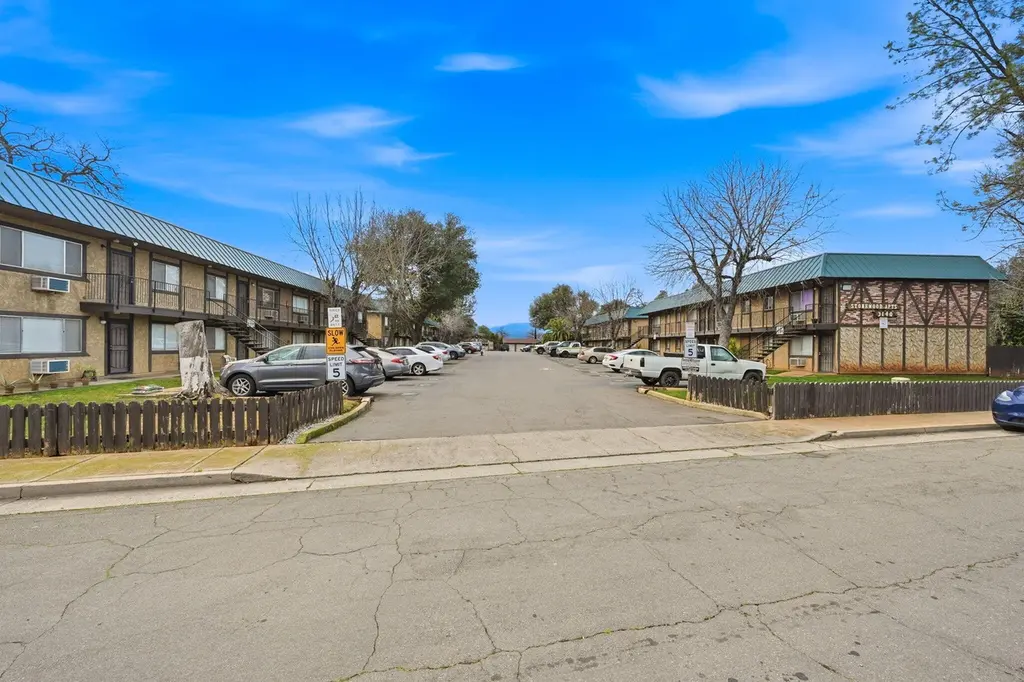
3140 C St · Redding, CA
Flood risk 1/10 · Minimal
- FEMA flood zone
- X (unshaded)
- Chance of flooding over 30 yrs
- 0.0%
- Est. flood insurance / yr
- $507 – $1,088
Fire risk 2/10 · Minimal
- Est. fire insurance / yr
- $659 – $1,223
Heat risk 8/10 · Major
- Hot days now (above 105°F)
- 7 days/yr
- Hot days in 30 yrs
- 16 days/yr
Wind risk 1/10 · Minimal
- Chance of severe wind over 30 yrs
- —
Air-quality risk 10/10 · Severe
- Unhealthy air days now
- 37 days/yr
- Unhealthy air days in 30 yrs
- 40 days/yr
Risk factors via First Street. Map © Google.
Why this score? — see what drove the B- grade
The composite is a weighted blend of 9 inputs, each scored 0–100. Each bar is that input's sub-score; the figure is the points it added to the 100-point composite (weight × sub-score).
- Cash flow +30.0/30.0
- DSCR +10.0/10.0
- 1% rule +8.2/10.0
- ARV discount +7.5/15.0
- Schools +4.6/10.0
- Livability +3.8/5.0
- Rent growth +3.0/5.0
- Condition / age +2.5/5.0
- Appreciation +0.0/10.0
$4,000,000
🖨 Deal sheet (PDF) 📄 Offer letter ✓ Due diligence
Multi-family units
County records classify this as Multi-Family (5+ Unit). Listing-text estimate: 1 unit. estimate disagrees with records
5+ unit building — per-unit beds/baths from public records are typically unavailable; the breakdown below (if shown) is an estimate from the listing text.
Listing remarks
Stonewood Apartments is a well-maintained, single-owner complex centrally located within an established residential corridor of Redding, the economic hub of Shasta County. The property consists of 38 units, comprised of 22 one-bedroom, one-bath units and 16 two-bedroom, one-bath units, along with an on-site manager's unit. Additional features include 6 garages, on-site laundry facilities, a community pool, and ample parking for tenants, all contributing to strong tenant appeal and long-term occupancy. The property benefits from convenient access to Highway 44 and Interstate 5, placing tenants within minutes of major employment centers, including healthcare, retail, education, and government
Key facts
- Community pool
- Ample parking
- Nearby amenities
Tags
Property features AI
Exterior
- Parking: Assigned parking; Garage parking with 6 garage spaces; Guest parking; On-street parking
- Home design: Residential income property; Stucco and wood siding exterior
- Construction: Stucco construction; Wood siding
- Exterior features: Lot approximately 1.73 (unit not specified)
Interior
- Heating & cooling: Electric heating; Has cooling
- Interior features: Electric heating; Central cooling
Neighborhood map
What this means for you Summary
Snapshot
- This is a multifamily listed at $4.00M.
Deal economics
- At list price, monthly cash flow is $17k ($207k/yr) — positive.
- The deal already cash-flows at list — no discount required.
- Meets the 1% rule at list price ($53k rent vs $4.00M).
- Recommended offer: $3.76M (6.0% below list) — sets the bar for market timing.
- Cap rate 11.5% vs local median 3.3% in Redding — top-decile yield for the area; either an underpriced asset or a hidden risk that comps aren't pricing in. Stress-test before assuming the spread holds.
Location & tenants
- Location reads 76/100 on livability (#106 in CA, #3,726 nationally) — a middle-class / working-renter tenant base. Strengths: amenities A+, commute A+, health & safety A+; Watch: employment C-, crime F, cost of living F.
- Shasta Union High (urban): math 41% / reading 67% proficiency, ranked #122 of 517 in CA (top 24%) — acceptable for families but not a draw, mixed tenant base, ~2y average lease; only 16% free/reduced lunch — higher-income household profile.
- Market conditions: Rents rising (+1.9%/yr); 286 active listings in the ZIP; 26 comparable units currently listed for rent nearby; rentals at typical pace (median 14d on market — plan ~3-4 weeks tenant-placement turnaround); 246 units permitted in Shasta County in 2024 (0 in 5+ unit buildings).
- At $52,840/mo this rent would consume 866% of the median local household income ($73k/yr) (locally 1026% of renters already pay >50% of income on rent) — very limited rent-growth headroom before tenants either downsize or default.
Forward outlook
- Local home prices are declining (-3.0%/yr); year-one equity from $28k of loan paydown is wiped out by about $120k of value loss. Plan a longer hold.
- Shasta County population projected to shrink 9% by 2050 — rents likely to lag national; underwrite the cash flow, not the appreciation.
- At projected returns (-3.0% appreciation + 1.9% rent growth), your $1.12M cash investment doubles in ~8 years — after that, you're playing with house money.
Negotiation context
- It's been on market 76 days — a 6% lower offer ($3.76M) is reasonable based on typical stale-listing flexibility.
Risks & watch-outs
- Climate carrying-cost: extreme-heat days projected 7→16/yr by 2055 (HVAC capex compounding) — expect insurance premiums to compound above CPI over the hold.
Questions for the listing agent
- It's been on market 76 days. Have you received any prior offers? Is the seller open to a 6% concession, seller financing, or rate buy-down credit?
- Why hasn't it sold? Are there any deal-killer items the seller is aware of (foundation, flood, title, zoning, code violations)?
- Is there a deadline driving the sale (1031 exchange, divorce, estate, relocation)? That informs how much negotiation room exists.
- Schools are B-rated — typically a magnet for longer-tenancy family renters. What's the average tenant stay here, and is there a school-zone premium baked into asking?
- Crime grade is F in this area — have there been break-ins, vandalism, or insurance claims at this property in the last 3 years? What carrier currently insures it and at what premium?
- What's the average days-on-market for RENTAL listings here right now (not sales)? A rising rental-DOM trend means longer vacancies and softer asking-rent achievability than the comps imply.
- What's the recent tenant-quality profile in this submarket — average credit score on applications, eviction rate, late-payment / NSF rate, and stable-employment percentage? A property-management company in the area should have these aggregated.
- How much new apartment / multifamily construction is in the pipeline within 1–3 miles? Heavy new supply (>2% of stock underway) typically softens rents 12–24 months out; light construction supports rent growth.
Investment metrics
- 1% rule
- 1.32% ✓
- Cap rate
- 11.46%
- Cash-on-cash
- 18.45%
- DSCR
- 1.82
- GRM
- 6.3
CMA / ARV
No comps found within radius.
Show comp detail 7 sales within ~0.75 mi
| Address | Dist | Beds/Ba | Sqft | Sold | Price | $/sf | Match |
|---|---|---|---|---|---|---|---|
| 545 Wilshire Dr | 0.09mi | —/— | — | 11mo | $3,500,000 | — | 74 |
| 628 Hartnell Ave | 0.19mi | —/— | — | 8mo | $717,000 | — | 72 |
| 1091 Del Sol Pl | 0.43mi | —/— | — | 0mo | $551,000 | — | 67 |
| 3580 Ricardo Ave | 0.42mi | —/— | — | 10mo | $575,000 | — | 59 |
| 2873 Lowden Ln | 0.46mi | —/— | — | 9mo | $685,000 | — | 58 |
| 1175 Le Brun Ln | 0.53mi | —/— | — | 10mo | $475,000 | — | 54 |
| 2909 Rockabye Ln Ln | 0.50mi | —/— | — | 19mo | $333,000 | — | 48 |
Match score weights: distance 35% · size 25% · config 20% · recency 20%. Top-matched comps best support the ARV.
Projected returns pro-forma
-3.0% appreciation · 1.88% rent growth · sell at horizon
- IRR
- 8.9%
- Equity multiple
- 1.35×
- Total profit
- $388,494
- Equity at exit
- $596,413
- IRR
- 17.2%
- Equity multiple
- 2.35×
- Total profit
- $1,509,628
- Equity at exit
- $345,847
Cash invested: $1,120,000 (down + closing). Projections, not guarantees.
Landlord ↔ Tenant lean methodology
- Overall (STATE)
- 18 Strongly Tenant-Friendly
- State California
- 18 Strongly Tenant-Friendly · D+13
- County
- — inherits STATE
- City
- — inherits STATE
ZIP-level market 96002
- Rents YoY
- 1.9%
- Active inventory
- 286
- Price-to-rent
- 254.1×
Monthly cashflow live
- Estimated rent
- $52,840 high interval (Pro) →
- Mortgage (P&I)
- −$20,976
- Tax from tax record
- −$1,882 /mo · $22,580/yr
- Insurance
- −$1,667
- HOA
- −$0
- Vacancy / Maint / Mgmt
- −$11,096
- Net cashflow
- $17,219
Break-even live
Sensitivity live
| Price | -10% $19,483 | -5% $18,351 | +0% $17,219 | +5% $16,087 | +10% $14,955 |
|---|---|---|---|---|---|
| Rent | -10% $13,044 | -5% $15,132 | +0% $17,219 | +5% $19,306 | +10% $21,393 |
| Rate | -1.0pp $19,233 | -0.5pp $18,236 | base $17,219 | +0.5pp $16,182 | +1.0pp $15,128 |
38-unit breakdown (identical units grouped — click to expand)
| Units | Beds | Baths | Est. rent |
|---|---|---|---|
| 22× units | 1 | 1 | $28,864 |
| #1 | 1 | 1 | $1,312 |
| #2 | 1 | 1 | $1,312 |
| #3 | 1 | 1 | $1,312 |
| #4 | 1 | 1 | $1,312 |
| #5 | 1 | 1 | $1,312 |
| #6 | 1 | 1 | $1,312 |
| #7 | 1 | 1 | $1,312 |
| #8 | 1 | 1 | $1,312 |
| #9 | 1 | 1 | $1,312 |
| #10 | 1 | 1 | $1,312 |
| #11 | 1 | 1 | $1,312 |
| #12 | 1 | 1 | $1,312 |
| #13 | 1 | 1 | $1,312 |
| #14 | 1 | 1 | $1,312 |
| #15 | 1 | 1 | $1,312 |
| #16 | 1 | 1 | $1,312 |
| #17 | 1 | 1 | $1,312 |
| #18 | 1 | 1 | $1,312 |
| #19 | 1 | 1 | $1,312 |
| #20 | 1 | 1 | $1,312 |
| #21 | 1 | 1 | $1,312 |
| #22 | 1 | 1 | $1,312 |
| 16× units | 2 | 1 | $23,984 |
| #23 | 2 | 1 | $1,499 |
| #24 | 2 | 1 | $1,499 |
| #25 | 2 | 1 | $1,499 |
| #26 | 2 | 1 | $1,499 |
| #27 | 2 | 1 | $1,499 |
| #28 | 2 | 1 | $1,499 |
| #29 | 2 | 1 | $1,499 |
| #30 | 2 | 1 | $1,499 |
| #31 | 2 | 1 | $1,499 |
| #32 | 2 | 1 | $1,499 |
| #33 | 2 | 1 | $1,499 |
| #34 | 2 | 1 | $1,499 |
| #35 | 2 | 1 | $1,499 |
| #36 | 2 | 1 | $1,499 |
| #37 | 2 | 1 | $1,499 |
| #38 | 2 | 1 | $1,499 |
| Total (38 units) | $52,840 | ||
UW: 25.0% down · 7.5% · 30yr · 1.5% tax · 5.0% vac · 8.0% maint · 8.0% mgmt
Financing live
Cash to close
- Down payment
- $1,000,000
- Closing costs
- $120,000
- Reserves months
- —
- Total cash needed
- —
Loan-product check · same deal, 3 products live
Conventional
25% down · 7.5% · 30yr
- Down + closing
- —
- Monthly P&I
- —
- Monthly cashflow
- —
- DSCR
- —
- Eligible?
- —
Personal DTI + credit; lowest rate.
DSCR
20% down · 8.5% · 30yr
- Down + closing
- —
- Monthly P&I
- —
- Monthly cashflow
- —
- DSCR
- —
- Eligible?
- —
No personal income docs; deal must DSCR.
Hard money
10% down · 12.0% · 12mo
- Down + closing
- —
- Monthly P&I
- —
- Monthly cashflow
- —
- DSCR
- —
- Eligible?
- —
Short-term bridge; refi at stabilization.
Rent comps 26 comps
| Address | Beds | Baths | Sqft | Rent | $/sqft | DOM | Units | Dist |
|---|---|---|---|---|---|---|---|---|
| 3220 C St Redding, CA | 2.0 | 1.5 | 886 | $1,500 | $1.69 | 14d | 1 | 0.04mi |
| 545 Wilshire Dr Redding, CA | 1.0 | 1.0 | 616 | $1,125 | $1.83 | 14d | 1 | 0.10mi |
| 3306 Alexander Dr Unit 01 Redding, CA | 2.0 | 1.0 | — | $1,329 | — | 14d | 1 | 0.15mi |
| 602 Parsons Dr Unit B Redding, CA | 2.0 | 1.0 | — | $1,350 | — | 22d | 1 | 0.29mi |
| 1006 2nd St Unit A Redding, CA | 2.0 | 1.0 | 700 | $1,175 | $1.68 | 14d | 1 | 0.30mi |
| 3512 Adams Ln Unit 8 Redding, CA | 2.0 | 1.0 | 900 | $1,375 | $1.53 | 14d | 1 | 0.35mi |
| 712 Kerryjen Ct Unit B Redding, CA | 2.0 | 1.0 | 850 | $1,300 | $1.53 | 22d | 1 | 0.38mi |
| 1063 Del Sol Pl Unit D Redding, CA | 2.0 | 1.5 | 941 | $1,350 | $1.43 | 14d | 1 | 0.39mi |
| 3629 Bechelli Ln Redding, CA | 1.0–2.0 | 1.0 | 769 | $1,650 | $2.15 | 14d | 1 | 0.42mi |
| 2821 Blue View St Redding, CA | 2.0 | 1.0 | 1000 | $1,595 | $1.59 | 14d | 1 | 0.46mi |
| 1100 Echo Rd Redding, CA | 2.0 | 1.0 | — | $1,250 | — | 14d | 1 | 0.52mi |
| 1013 Echo Rd Redding, CA | 2.0 | 1.0 | 768 | $1,375 | $1.79 | 14d | 1 | 0.55mi |
| 3773 Ricardo Ave Redding, CA | 3.0 | 3.0 | 1404 | $1,995 | $1.42 | 14d | 1 | 0.69mi |
| 1295 Downard Ln Apt 5 Redding, CA | 2.0 | 1.0 | 800 | $1,199 | $1.50 | 14d | 1 | 0.72mi |
| 683 Joaquin Ave Redding, CA | 1.0 | 1.0 | — | $950 | — | 14d | 1 | 0.72mi |
| 2814 Henderson Rd Redding, CA | 3.0 | 2.0 | — | $3,750 | — | 14d | 1 | 0.73mi |
| 1390 Empress Ln Redding, CA | 3.0 | 2.0 | 2140 | $2,700 | $1.26 | 14d | 1 | 0.82mi |
| 3980 Churn Creek Rd Redding, CA | 2.0 | 1.0 | 755 | $1,295 | $1.72 | 14d | 1 | 0.82mi |
| 1601 Bramble Pl Unit 4 Redding, CA | 2.0 | 1.0 | 750 | $1,250 | $1.67 | 14d | 1 | 0.96mi |
| 1631 Bramble Pl Unit 1 Redding, CA | 2.0 | 1.0 | 900 | $1,295 | $1.44 | 14d | 1 | 0.99mi |
| 3996 Morningsun Dr Redding, CA | 3.0 | 2.0 | 1384 | $1,975 | $1.43 | 14d | 1 | 1.19mi |
| 1975 Bechelli Ln Redding, CA | 2.0 | 2.0 | 1347 | $1,850 | $1.37 | 22d | 1 | 1.28mi |
| 2646 Sharon Ave Unit B Redding, CA | 2.0 | 1.0 | — | $1,259 | — | 14d | 1 | 1.32mi |
| 1933 Wheeler St Redding, CA | 3.0 | 2.0 | 1242 | $2,000 | $1.61 | 14d | 1 | 1.34mi |
| 2351 Victor Ave Redding, CA | 2.0 | 1.5 | 900 | $1,400 | $1.56 | 14d | 1 | 1.38mi |
| 2122 Marlene Ave Redding, CA | 2.0 | 2.0 | — | $1,695 | — | 14d | 1 | 1.43mi |
Listing history 18 events
-
2026-06-19days on market $4,000,000 Active 76 DOM
-
2026-06-18days on market $4,000,000 Active 75 DOM
-
2026-06-17days on market $4,000,000 Active 74 DOM
-
2026-06-16days on market $4,000,000 Active 73 DOM
-
2026-06-15days on market $4,000,000 Active 72 DOM
-
2026-06-14days on market $4,000,000 Active 70 DOM
-
2026-06-13days on market $4,000,000 Active 69 DOM
-
2026-06-10days on market $4,000,000 Active 67 DOM
-
2026-06-09days on market $4,000,000 Active 66 DOM
-
2026-06-08days on market $4,000,000 Active 65 DOM
-
2026-06-07days on market $4,000,000 Active 64 DOM
-
2026-06-05days on market $4,000,000 Active 61 DOM
-
2026-06-03days on market $4,000,000 Active 60 DOM
-
2026-06-02days on market $4,000,000 Active 59 DOM
-
2026-06-01days on market $4,000,000 Active 58 DOM
-
2026-05-31days on market $4,000,000 Active 57 DOM
-
2026-05-30days on market $4,000,000 Active 56 DOM
-
2026-04-02$4,000,000 Active
ⓘ Source: listings_history table (triggers on properties + properties_extension) + one-shot
backfill from property_details.listing_events for pre-trigger history.
Tax reassessment forecast CA · Resets to sale price
- Current annual tax
- $22,580 · $1,882/mo
- Projected year-2 tax
- $30,400 · $2,533/mo
- Expected delta
- +$7,820/yr (+$652/mo · 34.6%)
ⓘ Screening estimate from a state-policy table — verify with the county assessor before closing.
Climate risk First Street
- Flood 1/10 Low FEMA zone X (unshaded) · 0% chance over 30 yrs
- Wildfire 2/10 Low
- Heat 8/10 Severe 7 d/yr ≥105°F today · 16 d/yr by 30 yrs out
- Wind 1/10 Low
- Air quality 10/10 Extreme 37 unhealthy d/yr today · 40 by 30 yrs out
Nearby sold comps map
Loading sold comps map…
Walkable amenities ~0.75 mi
Loading nearby amenities…
Taxation est. · year 1
- Rental income
- $634,080
- − Mortgage interest
- −$224,062
- − Property taxes
- −$22,580
- − Insurance
- −$20,000
- − Repairs & maintenance
- −$50,726
- − Management
- −$50,726
- − Depreciation
- −$116,364
- Taxable income
- $149,621
- Est. tax owed @ 24.0%
- −$35,909
- After-tax cash flow
- $170,717/yr
For passive investors: Depreciation is non-cash, so a rental often shows a tax loss while cash-flowing — sheltering income. Rental losses are passive: they offset passive income freely, and up to $25,000/yr can offset ordinary (W-2) income if you actively participate and your MAGI is under $100k (phasing out to $0 by $150k); unused losses carry forward. On sale, claimed depreciation is recaptured at up to 25%, and gains may owe capital-gains tax (a 1031 exchange can defer both). Figures are a year-1 estimate at your 24.0% rate — not tax advice; consult a CPA.
Schools (NCES district)
- District
- Shasta Union High
- NCES district ID
- 0636600
- Math proficiency
- 41% ▲ 3.00%
- Reading proficiency
- 67% ▲ 9.00%
- Median HH income
- $50,080
- Composite
- 46.01/100
- National rank
- #2532
- State rank
- #122 of 517 in CA
Livability — Redding
- Score
- 76/100
- State rank
- #106
- US rank
- #3726
Category grades
Schools grade is shown separately in the Schools card above.
Census & demographics
- Census place
- Redding, CA
- County
- Shasta County · 147,641 people
- City population
- 112,523
- Metro
- Redding, CA
- Population (ZIP)
- 33,783
- Household income
- $73,222
- Rent vs Own
- Severe rent burden
- 1026.0
Population outlook (Shasta County) Hauer SSP2
- Today (2025)
- 179,231 people
- By 2030
- 176,953 · -1.3%
- By 2040
- 169,982 · -5.2%
- By 2050
- 162,547 · -9.3%
- By 2075
- 145,649 · -18.7%
- By 2100
- 123,025 · -31.4%
Race, ethnicity, and origin ACS 2023
- Neighborhood character
- Predominantly White (72%)
- Race & ethnicity
- White 72% Hispanic / Latino 13% Two or more races 12% Asian 6% Native American 2% Black 1%
- Hispanic origin (detail)
- Mexican 10%
- Common ancestry
- Italian 4% Lithuanian 2% Slovak 2%
- Foreign-born
- 5% · Canada
- Languages at home
- 91% English-only · Spanish 4% Other Asian/Pacific 2% Other Indo-European 1%
Political lean MEDSL · Shasta
- 2024 margin
- Solid R (+36.5) · D 30.5% · R 67.0% · Other 2.5%
- 2008→2024 swing
- -10.7pp toward R · 2008: -25.8pp · 2024: -36.5pp
- All cycles
- 2024: R+36.5 2020: R+33.1 2016: R+37.4 2012: R+30.3 2008: R+25.8
Not yet ingested
- Civics
- —
Market trends
- HPI YoY
- ▼ -248.70%
- Current HPI
- 319.713
- Rent YoY
- ▲ 1.88%
- Metro
- Redding, CA
- State GDP YoY
- ▲ 3.21%
- F500 in state
- 116
Industry mix (Fortune 500 HQ in CA)
| Industry | F500 HQs | Revenue |
|---|---|---|
| Technology | 27 | $1,492B |
|
||
| Financial Services | 3 | $174B |
|
||
| Retail | 3 | $44B |
|
||
| Insurance | 3 | $26B |
|
||
| Media / Entertainment | 2 | $115B |
|
||
| Pharmaceuticals / Biotech | 2 | $62B |
|
||
Price history
1 event — show timeline
- 2026-04-02 Listed $4,000,000 SAOR
Property tax history
+1.6%/yrLatest (2025): $22,580 · +1.5% YoY. Source: county tax records.
Cash-flow waterfall
monthlySold comps — $/sqft
last 12 mo · ≤1 miLoading sold comps…