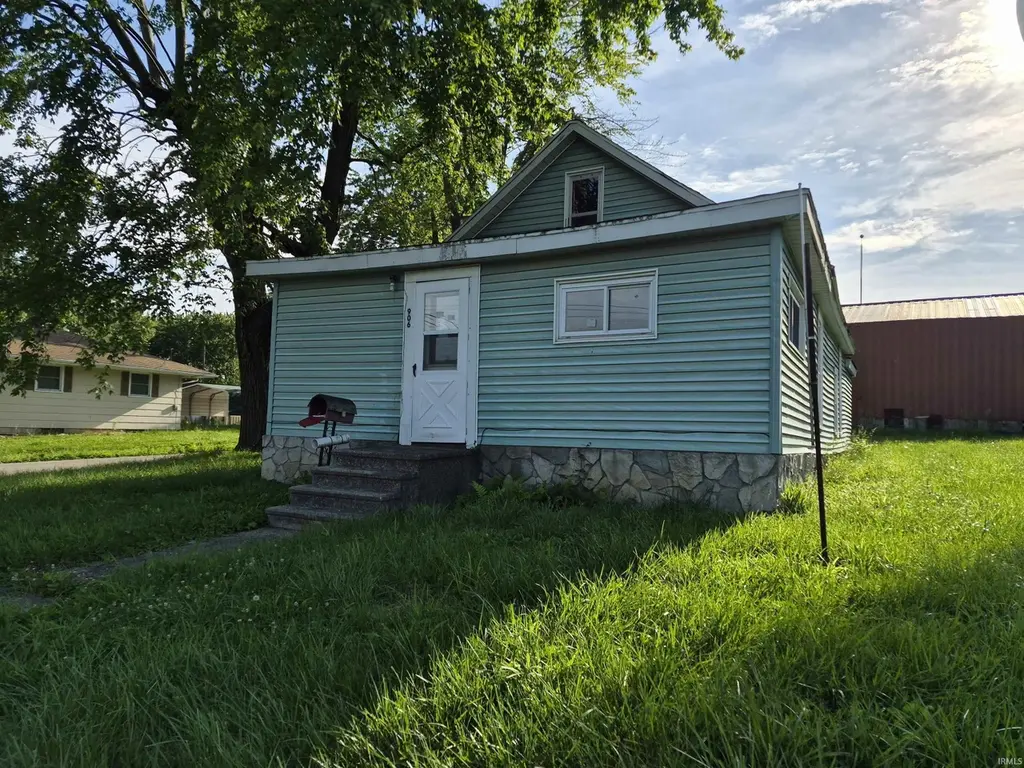
906 Jefferson St · Bridgeport, IL
Flood risk 1/10 · Minimal
- FEMA flood zone
- X (unshaded)
- Chance of flooding over 30 yrs
- 0.0%
- Est. flood insurance / yr
- $507 – $1,088
Fire risk 1/10 · Minimal
- Est. fire insurance / yr
- $804 – $1,492
Heat risk 4/10 · Minor
- Hot days now (above 108°F)
- 7 days/yr
- Hot days in 30 yrs
- 19 days/yr
Wind risk 2/10 · Minimal
- Chance of severe wind over 30 yrs
- 2.0%
Air-quality risk 2/10 · Minimal
- Unhealthy air days now
- 1 days/yr
- Unhealthy air days in 30 yrs
- 2 days/yr
Risk factors via First Street. Map © Google.
Why this score? — see what drove the D+ grade
The composite is a weighted blend of 9 inputs, each scored 0–100. Each bar is that input's sub-score; the figure is the points it added to the 100-point composite (weight × sub-score).
- Cash flow +15.0/30.0
- ARV discount +7.5/15.0
- 1% rule +5.0/10.0
- DSCR +5.0/10.0
- Appreciation +3.9/10.0
- Livability +3.2/5.0
- Rent growth +2.5/5.0
- Condition / age +2.5/5.0
- Schools +2.3/10.0
$21,900
🖨 Deal sheet 📄 Offer letter ✓ Due diligence
Listing remarks
Bungalow style home with 4 bedrooms and 1 bathroom, living room, dining room and kitchen. A pole barn is located behind the home and large open lot to the right of the home.
Key facts
- Pole barn
- Large open lot
- Bungalow style home
Tags
Property features AI
Finance
- Financial info: Annual tax amount reported
Exterior
- Utilities: Public water; Public sewer
- Home design: Single-family residence; Site-built home; One story
- Construction: Vinyl siding
- Exterior features: Corner lot
Interior
- Bedrooms: Total of 7 rooms (includes bedrooms and living spaces)
- Bathrooms: 1 full bathroom
- Heating & cooling: Forced air heating; No cooling system
- Interior features: Crawl space basement
- Laundry & utility: Laundry on the main level
Neighborhood map
What this means for you Summary
Snapshot
- This is a 4-bed/1.0-bath single-family listed at $22k.
Deal economics
- At list price, monthly cash flow is $646 ($8k/yr) — positive.
- The deal already cash-flows at list — no discount required.
- Meets the 1% rule at list price ($1k rent vs $22k).
- Recommended offer: $22k (1.5% below list) — sets the bar for market timing.
Location & tenants
- Location reads 64/100 on livability (#682 in IL) — a middle-class / working-renter tenant base. Strengths: cost of living A+, crime A, housing A-; Watch: amenities F, commute F, health & safety D-.
- Red Hill CUSD 10 (town): math 17% / reading 38% proficiency, ranked #294 of 620 in IL (top 47%) — low school quality limits family demand, transient renter base, plan for 1-2y turnover.
- Zoned schools: Bridgeport Grade School (math 37% / reading 47%, grade F, #336 of 2,056 statewide, top 18%, 363 students, 0% FRL); Red Hill Jr/Sr High School (math 12% / reading 27%, grade F, #397 of 693 statewide, top 61%, 366 students, 0% FRL) — zoned schools average 0% FRL vs 43% district-wide (43 pts lower); this property's tenant base skews higher-income than the district average.
- Market conditions: 4 active listings in the ZIP; 64 units permitted in Lawrence County in 2024 (0 in 5+ unit buildings).
Forward outlook
- Local home prices are declining (-2.3%/yr); year-one equity from $151 of loan paydown is wiped out by about $498 of value loss. Plan a longer hold.
- Lawrence County population projected to shrink 9% by 2050 — rents likely to lag national; underwrite the cash flow, not the appreciation.
- At projected returns (-2.3% appreciation + 3.0% rent growth), your $6k cash investment doubles in ~1 year — after that, you're playing with house money.
Negotiation context
- It's been on market 17 days — a 2% lower offer ($22k) is reasonable based on typical stale-listing flexibility.
Risks & watch-outs
- Watch-outs: property tax is 3.6% of price; built in 1920 — expect roof / HVAC / electrical / plumbing capex.
Questions for the listing agent
- Built in 1920 — when were the roof, HVAC, electrical panel, plumbing, and water heater last replaced?
- Property tax is high relative to price — has the assessment been appealed recently, and will the sale trigger a re-assessment?
- Is there a deadline driving the sale (1031 exchange, divorce, estate, relocation)? That informs how much negotiation room exists.
- Schools are F-rated, which usually means shorter tenancies and higher turnover. Who's the typical renter profile here, and what's been the actual vacancy rate?
- The area grade is low — what's the realistic commute time and amenity access for the typical tenant pool here? Any planned neighborhood developments (good or bad) we should know about?
- What's the average days-on-market for RENTAL listings here right now (not sales)? A rising rental-DOM trend means longer vacancies and softer asking-rent achievability than the comps imply.
- What's the recent tenant-quality profile in this submarket — average credit score on applications, eviction rate, late-payment / NSF rate, and stable-employment percentage? A property-management company in the area should have these aggregated.
- How much new for-sale + rental construction is in the pipeline within 1–3 miles? Heavy new supply typically softens prices + rents 12–24 months out; constrained supply supports both.
Investment metrics
- 1% rule
- 4.83% ✓
- Cap rate
- 41.67%
- Cash-on-cash
- 126.35%
- DSCR
- 6.62
- GRM
- 1.7
CMA / ARV
No comps found within radius.
Projected returns pro-forma
-2.27% appreciation · 3.0% rent growth · sell at horizon
- IRR
- —
- Equity multiple
- 7.24×
- Total profit
- $38,286
- Equity at exit
- $3,981
- IRR
- —
- Equity multiple
- 15.19×
- Total profit
- $87,043
- Equity at exit
- $3,146
Cash invested: $6,132 (down + closing). Projections, not guarantees.
Landlord ↔ Tenant lean methodology
- Overall (STATE)
- 43 Moderately Tenant-Leaning
- State Illinois
- 43 Moderately Tenant-Leaning · D+7
- County
- — inherits STATE
- City
- — inherits STATE
ZIP-level market 62417
- Home prices YoY
- -2.0%
- Active inventory
- 4
- Price-to-rent
- 1.7×
Monthly cashflow live
- Estimated rent
- $1,058 medium interval (Pro) →
- Mortgage (P&I)
- −$115
- Tax from tax record
- −$66 /mo · $797/yr
- Insurance
- −$9
- HOA
- −$0
- Vacancy / Maint / Mgmt
- −$222
- Net cashflow
- $646
Break-even live
UW: 25.0% down · 7.5% · 30yr · 1.5% tax · 5.0% vac · 8.0% maint · 8.0% mgmt
Financing live
Cash to close
- Down payment
- $5,475
- Closing costs
- $657
- Reserves months
- —
- Total cash needed
- —
Loan-product check · same deal, 3 products live
Conventional
25% down · 7.5% · 30yr
- Down + closing
- —
- Monthly P&I
- —
- Monthly cashflow
- —
- DSCR
- —
- Eligible?
- —
Personal DTI + credit; lowest rate.
DSCR
20% down · 8.5% · 30yr
- Down + closing
- —
- Monthly P&I
- —
- Monthly cashflow
- —
- DSCR
- —
- Eligible?
- —
No personal income docs; deal must DSCR.
Hard money
10% down · 12.0% · 12mo
- Down + closing
- —
- Monthly P&I
- —
- Monthly cashflow
- —
- DSCR
- —
- Eligible?
- —
Short-term bridge; refi at stabilization.
Listing history 13 events
-
2026-06-18days on market $21,900 Active 17 DOM
-
2026-06-17days on market $21,900 Active 16 DOM
-
2026-06-16days on market $21,900 Active 15 DOM
-
2026-06-15days on market $21,900 Active 14 DOM
-
2026-06-13days on market $21,900 Active 12 DOM
-
2026-06-12days on market $21,900 Active 11 DOM
-
2026-06-09days on market $21,900 Active 8 DOM
-
2026-06-08days on market $21,900 Active 7 DOM
-
2026-06-07days on market $21,900 Active 6 DOM
-
2026-06-05days on market $21,900 Active 4 DOM
-
2026-06-04days on market $21,900 Active 2 DOM
-
2026-06-01remarks 173-char remark
-
2026-06-01$21,900 Active 1 DOM
ⓘ Source: listings_history table (triggers on properties + properties_extension) + one-shot
backfill from property_details.listing_events for pre-trigger history.
Tax reassessment forecast IL · Partial reset (capped growth)
- Current annual tax
- $797 · $66/mo
- Projected year-2 tax
- $797 · $66/mo
- Expected delta
- $0/yr ($0/mo · 0.0%)
ⓘ Screening estimate from a state-policy table — verify with the county assessor before closing.
Climate risk First Street
- Flood 1/10 Low FEMA zone X (unshaded) · 0% chance over 30 yrs
- Wildfire 1/10 Low
- Heat 4/10 Moderate 7 d/yr ≥108°F today · 19 d/yr by 30 yrs out
- Wind 2/10 Low 2% chance of damaging wind over 30 yrs
- Air quality 2/10 Low 1 unhealthy d/yr today · 2 by 30 yrs out
Nearby sold comps map
Loading sold comps map…
Walkable amenities ~0.75 mi
Loading nearby amenities…
Taxation est. · year 1
- Rental income
- $12,699
- − Mortgage interest
- −$1,227
- − Property taxes
- −$797
- − Insurance
- −$110
- − Repairs & maintenance
- −$1,016
- − Management
- −$1,016
- − Depreciation
- −$637
- Taxable income
- $7,897
- Est. tax owed @ 24.0%
- −$1,895
- After-tax cash flow
- $5,853/yr
For passive investors: Depreciation is non-cash, so a rental often shows a tax loss while cash-flowing — sheltering income. Rental losses are passive: they offset passive income freely, and up to $25,000/yr can offset ordinary (W-2) income if you actively participate and your MAGI is under $100k (phasing out to $0 by $150k); unused losses carry forward. On sale, claimed depreciation is recaptured at up to 25%, and gains may owe capital-gains tax (a 1031 exchange can defer both). Figures are a year-1 estimate at your 24.0% rate — not tax advice; consult a CPA.
Schools (NCES district)
- District
- Red Hill CUSD 10
- NCES district ID
- 1722130
- Math proficiency
- 17% ▼ -9.00%
- Reading proficiency
- 38% ▼ -7.00%
- Median HH income
- $41,821
- Composite
- 23.27/100
- National rank
- #7929
- State rank
- #294 of 620 in IL
Livability — Bridgeport
- Score
- 64/100
- State rank
- #682
- US rank
- #13956
Category grades
Schools grade is shown separately in the Schools card above.
Census & demographics
- Census place
- Bridgeport, IL
- City population
- 2,653
- Population (ZIP)
- 2,653
Population outlook (Lawrence County) Hauer SSP2
- Today (2025)
- 15,664 people
- By 2030
- 15,378 · -1.8%
- By 2040
- 14,897 · -4.9%
- By 2050
- 14,267 · -8.9%
- By 2075
- 12,048 · -23.1%
- By 2100
- 9,538 · -39.1%
Race, ethnicity, and origin ACS 2023
- Neighborhood character
- Predominantly White (93%)
- Race & ethnicity
- White 93% Two or more races 4% Hispanic / Latino 3% Black 3%
- Common ancestry
- Lithuanian 1% Romanian 1%
- Foreign-born
- 0%
- Languages at home
- 97% English-only · Spanish 3%
Political lean MEDSL · Lawrence
- 2024 margin
- Solid R (+56.2) · D 21.0% · R 77.3% · Other 1.7%
- 2008→2024 swing
- -50.3pp toward R · 2008: -5.9pp · 2024: -56.2pp
- All cycles
- 2024: R+56.2 2020: R+54.0 2016: R+53.5 2012: R+30.8 2008: R+5.9
Not yet ingested
- Civics
- —
Market trends
- HPI YoY
- ▼ -2.27%
- Current HPI
- 110.7865
- Rent YoY
- —
- Metro
- —
- State GDP YoY
- ▲ 1.59%
- F500 in state
- 60
Industry mix (Fortune 500 HQ in IL)
| Industry | F500 HQs | Revenue |
|---|---|---|
| Insurance | 4 | $201B |
|
||
| Consumer Goods | 4 | $87B |
|
||
| Industrial Machinery | 3 | $64B |
|
||
| Healthcare | 2 | $55B |
|
||
| Retail / Pharmacy | 1 | $148B |
|
||
| Agriculture / Food | 1 | $86B |
|
||
Price history
1 event — show timeline
- 2026-06-01 Listed $21,900 IRMLS
Property tax history
+19.7%/yrLatest (2024): $797 · +765.8% YoY. Source: county tax records.
Cash-flow waterfall
monthlySold comps — $/sqft
last 12 mo · ≤1 miLoading sold comps…