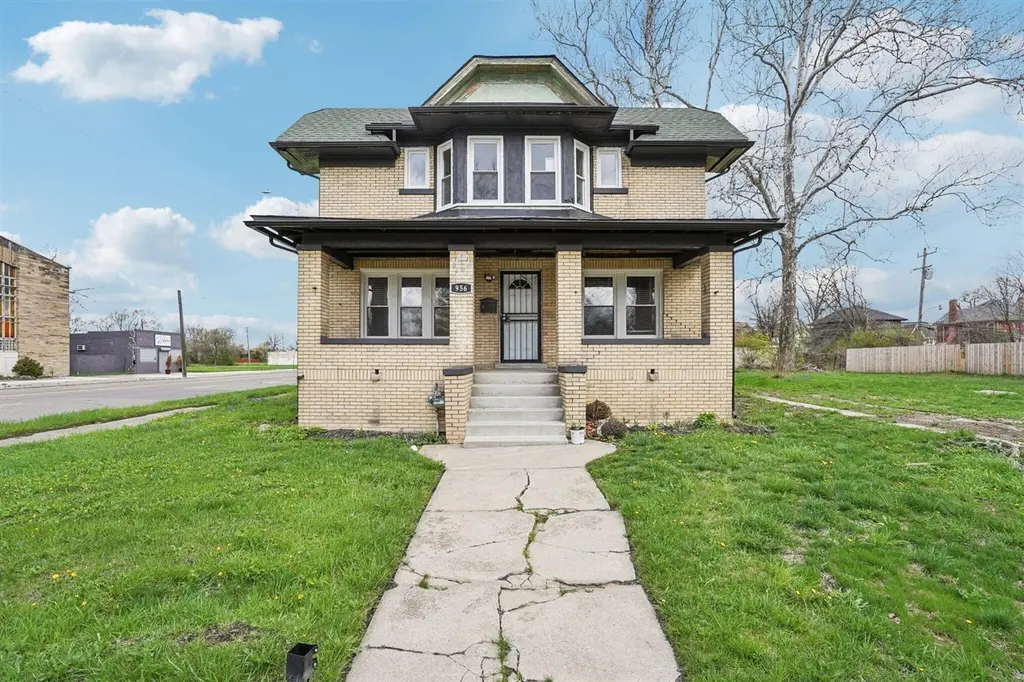
956 Glynn Ct · Detroit, MI
Flood risk 1/10 · Minimal
- FEMA flood zone
- X (unshaded)
- Chance of flooding over 30 yrs
- 0.0%
- Est. flood insurance / yr
- $473 – $860
Fire risk 1/10 · Minimal
- Est. fire insurance / yr
- $784 – $1,456
Heat risk 3/10 · Minor
- Hot days now (above 96°F)
- 7 days/yr
- Hot days in 30 yrs
- 14 days/yr
Wind risk 2/10 · Minimal
- Chance of severe wind over 30 yrs
- —
Air-quality risk 4/10 · Minor
- Unhealthy air days now
- 4 days/yr
- Unhealthy air days in 30 yrs
- 6 days/yr
Risk factors via First Street. Map © Google.
Why this score? — see what drove the C- grade
The composite is a weighted blend of 9 inputs, each scored 0–100. Each bar is that input's sub-score; the figure is the points it added to the 100-point composite (weight × sub-score).
- Cash flow +27.2/30.0
- DSCR +9.4/10.0
- 1% rule +7.3/10.0
- Livability +3.7/5.0
- Condition / age +2.5/5.0
- Schools +1.3/10.0
- Rent growth +1.2/5.0
- ARV discount +0.0/15.0
- Appreciation +0.0/10.0
$134,900
🖨 Deal sheet 📄 Offer letter ✓ Due diligence
Listing remarks MLS
Investor's dream sitting on a Detroit court and ready for its transformation. 956 Glynn Ct is a 3-bed, 2-bath rehab opportunity with good bones and one of the most valuable features you'll find in this market - a 4-car detached garage that adds immediate utility and serious upside to any exit strategy. The property needs work, and the price reflects it. For the experienced flipper, landlord, or buy-and-hold investor, this is the kind of canvas that rewards vision. Reconfigure, renovate, and refinish to command top-of-market rents or a strong resale number in a city that continues to attract capital and attention. That 4-car garage isn't just a bonus - it's a deal-maker. Workshop, storage rental, contractor bay, or simply a premium selling point for the end buyer. In Detroit's resurgent market, garage space like this is increasingly rare and increasingly valuable. - deals with this footprint and this garage don't sit long.
Key facts
- Rehab opportunity
- 4,356 sq ft lot
- 4 garage spots
Tags
Neighborhood map
What this means for you Summary
Snapshot
- This is a 3-bed/1.5-bath single-family listed at $135k.
Deal economics
- At list price, monthly cash flow is $385 ($5k/yr) — positive.
- The deal already cash-flows at list — no discount required.
- Meets the 1% rule at list price ($2k rent vs $135k).
- Recommended offer: $131k (3.0% below list) — sets the bar for market timing.
Location & tenants
- Location reads 73/100 on livability (#218 in MI) — a middle-class / working-renter tenant base. Strengths: amenities A+, commute A+, cost of living A+; Watch: schools F, crime F, employment F.
- Detroit Public Schools Community District (urban): math 10% / reading 24% proficiency, ranked #499 of 540 in MI (top 92%) — low school quality limits family demand, transient renter base, plan for 1-2y turnover; 90% free/reduced lunch — lower-income household profile, screen leases tightly.
- Market conditions: Rents falling (-5.1%/yr); 257 active listings in the ZIP; 40 comparable units currently listed for rent nearby; rentals at typical pace (median 20d on market — plan ~3-4 weeks tenant-placement turnaround); lower-income renter base — watch delinquency; 2,639 units permitted in Wayne County in 2024 (1,216 in 5+ unit buildings).
- At $1,660/mo this rent would consume 46% of the median local household income ($44k/yr) (locally 1258% of renters already pay >50% of income on rent) — very limited rent-growth headroom before tenants either downsize or default.
Forward outlook
- Local home prices are declining (-3.0%/yr); year-one equity from $933 of loan paydown is wiped out by about $4k of value loss. Plan a longer hold.
- Wayne County population projected at -17% by 2050 — secular population decline; favor cash flow + early exit over multi-decade hold.
Negotiation context
- It's been on market 58 days — a 3% lower offer ($131k) is reasonable based on typical stale-listing flexibility.
- 8 sale attempts since 9y ago; this cycle's ask has dropped $10k (7%) from the opening price — seller is motivated, your offer sets the floor, not the list.
- Current owner paid $97k; 39% above their basis — modest negotiation headroom, anchor on the comps not their cost.
Risks & watch-outs
- Watch-outs: built in 1917 — expect roof / HVAC / electrical / plumbing capex.
Questions for the listing agent
- It's been on market 58 days. Have you received any prior offers? Is the seller open to a 3% concession, seller financing, or rate buy-down credit?
- Built in 1917 — when were the roof, HVAC, electrical panel, plumbing, and water heater last replaced?
- Is there a deadline driving the sale (1031 exchange, divorce, estate, relocation)? That informs how much negotiation room exists.
- Schools are F-rated, which usually means shorter tenancies and higher turnover. Who's the typical renter profile here, and what's been the actual vacancy rate?
- Crime grade is F in this area — have there been break-ins, vandalism, or insurance claims at this property in the last 3 years? What carrier currently insures it and at what premium?
- What's the average days-on-market for RENTAL listings here right now (not sales)? A rising rental-DOM trend means longer vacancies and softer asking-rent achievability than the comps imply.
- What's the recent tenant-quality profile in this submarket — average credit score on applications, eviction rate, late-payment / NSF rate, and stable-employment percentage? A property-management company in the area should have these aggregated.
- How much new for-sale + rental construction is in the pipeline within 1–3 miles? Heavy new supply typically softens prices + rents 12–24 months out; constrained supply supports both.
Investment metrics
- 1% rule
- 1.23% ✓
- Cap rate
- 9.72%
- Cash-on-cash
- 12.22%
- DSCR
- 1.54
- GRM
- 6.8
CMA / ARV
- ARV (median comp)
- $106,865
- List price
- $134,900
- Delta
- 26.23%
- Verdict
- OVERPRICED
- Comps
- 20 within 1.0 mi
Show comp detail 12 sales within ~0.75 mi
| Address | Dist | Beds/Ba | Sqft | Sold | Price | $/sf | Match |
|---|---|---|---|---|---|---|---|
| 929 Lawrence St | 0.16mi | 3/1.5 | 1,692 (0%) | 9mo | $205,000 | $121 | 85 |
| 874 Edison St | 0.32mi | 3/1.5 | 1,658 (-2%) | 13mo | $180,000 | $109 | 71 |
| 940 Burlingame St | 0.25mi | 3/1.0 | 1,644 (-3%) | 14mo | $71,000 | $43 | 70 |
| 884 Burlingame St | 0.26mi | 3/1.5 | 1,568 (-7%) | 12mo | $55,000 | $35 | 66 |
| 936 Glynn Ct | 0.02mi | 4/3.0 (+1) | 1,874 (+11%) | 10mo | $285,000 | $152 | 62 |
| 693 Calvert St | 0.23mi | 4/1.5 (+1) | 1,914 (+13%) | 4mo | $109,000 | $57 | 59 |
| 121 Richton St | 0.60mi | 3/2.0 | 1,732 (+2%) | 13mo | $207,500 | $120 | 55 |
| 1423 Longfellow St | 0.34mi | 3/2.5 | 1,915 (+13%) | 5mo | $135,000 | $70 | 54 |
| 2064 Glynn Ct | 0.68mi | 4/1.5 (+1) | 1,624 (-4%) | 4mo | $118,556 | $73 | 54 |
| 689 Gladstone St | 0.70mi | 4/1.0 (+1) | 1,737 (+3%) | 7mo | $25,000 | $14 | 50 |
| 1604 Longfellow St | 0.43mi | 4/2.5 (+1) | 1,935 (+14%) | 13mo | $169,000 | $87 | 36 |
| 2220 Webb St | 0.74mi | 4/2.5 (+1) | 1,848 (+9%) | 12mo | $130,000 | $70 | 31 |
Match score weights: distance 35% · size 25% · config 20% · recency 20%. Top-matched comps best support the ARV.
Projected returns pro-forma
-3.0% appreciation · 0.0% rent growth · sell at horizon
- IRR
- -1.6%
- Equity multiple
- 0.94×
- Total profit
- $-2,197
- Equity at exit
- $20,114
- IRR
- 4.6%
- Equity multiple
- 1.29×
- Total profit
- $10,930
- Equity at exit
- $11,664
Cash invested: $37,772 (down + closing). Projections, not guarantees.
Landlord ↔ Tenant lean methodology
- Overall (STATE)
- 62 Landlord-Friendly
- State Michigan
- 62 Landlord-Friendly · EVEN
- County
- — inherits STATE
- City
- — inherits STATE
ZIP-level market 48202
- Rents YoY
- -5.1%
- Active inventory
- 257
- Price-to-rent
- 6.8×
Monthly cashflow live
- Estimated rent
- $1,660 high interval (Pro) →
- Mortgage (P&I)
- −$707
- Tax from tax record
- −$163 /mo · $1,954/yr
- Insurance
- −$56
- HOA
- −$0
- Vacancy / Maint / Mgmt
- −$349
- Net cashflow
- $385
Break-even live
UW: 25.0% down · 7.5% · 30yr · 1.5% tax · 5.0% vac · 8.0% maint · 8.0% mgmt
Financing live
Cash to close
- Down payment
- $33,725
- Closing costs
- $4,047
- Reserves months
- —
- Total cash needed
- —
Loan-product check · same deal, 3 products live
Conventional
25% down · 7.5% · 30yr
- Down + closing
- —
- Monthly P&I
- —
- Monthly cashflow
- —
- DSCR
- —
- Eligible?
- —
Personal DTI + credit; lowest rate.
DSCR
20% down · 8.5% · 30yr
- Down + closing
- —
- Monthly P&I
- —
- Monthly cashflow
- —
- DSCR
- —
- Eligible?
- —
No personal income docs; deal must DSCR.
Hard money
10% down · 12.0% · 12mo
- Down + closing
- —
- Monthly P&I
- —
- Monthly cashflow
- —
- DSCR
- —
- Eligible?
- —
Short-term bridge; refi at stabilization.
Rent comps 40 comps
| Address | Beds | Baths | Sqft | Rent | $/sqft | DOM | Units | Dist |
|---|---|---|---|---|---|---|---|---|
| 1427 Calvert Ave Detroit, MI | 3.0 | 1.0 | 1100 | $1,850 | $1.68 | 24d | 1 | 0.20mi |
| 1427 Calvert Ave Detroit, MI | 3.0 | 1.0 | 1100 | $1,750 | $1.59 | 43d | 1 | 0.20mi |
| 9844 Woodrow Wilson St Detroit, MI | 3.0 | 1.0 | 1187 | $1,300 | $1.10 | 12d | 1 | 0.34mi |
| 1929 Calvert Ave Unit 2 Detroit, MI | 3.0 | 1.0 | 1414 | $1,199 | $0.85 | 15d | 1 | 0.54mi |
| 2045 Calvert St Detroit, MI | 2.0 | 2.0 | 1400 | $1,600 | $1.14 | 43d | 1 | 0.65mi |
| 719 Gladstone Ave Detroit, MI | 2.0 | 1.0 | 1200 | $1,750 | $1.46 | 20d | 1 | 0.73mi |
| 715 Gladstone Ave Detroit, MI | 2.0 | 1.0 | 1200 | $1,750 | $1.46 | 20d | 1 | 0.73mi |
| 330 Westminster St Detroit, MI | 3.0 | 1.0 | 1995 | $1,900 | $0.95 | 23d | 1 | 0.88mi |
| 330 Westminster St Unit NA Detroit, MI | 3.0 | 1.0 | 1995 | $1,900 | $0.95 | 43d | 1 | 0.88mi |
| 64 Glendale St Highland Park, MI | 4.0 | 1.0 | 1464 | $1,500 | $1.02 | 10d | 1 | 0.88mi |
| 520 Englewood St Detroit, MI | 4.0 | 1.5 | 1086 | $1,725 | $1.59 | 24d | 1 | 0.90mi |
| 9429 Brush St Unit 1B Detroit, MI | 2.0 | 1.0 | 1500 | $1,523 | $1.02 | 43d | 1 | 0.91mi |
| 505 Westminster St Detroit, MI | 3.0 | 1.0 | 1700 | $1,400 | $0.82 | 17d | 1 | 0.91mi |
| 216 Holbrook St Detroit, MI | 4.0 | 2.0 | 2000 | $2,000 | $1.00 | 21d | 1 | 0.92mi |
| 216 Holbrook Unit Na Detroit, MI | 4.0 | 2.0 | 2000 | $2,200 | $1.10 | 1d | 1 | 0.92mi |
| 2254 Taylor St Unit Taylor St unit Detroit, MI | 3.0 | 1.0 | 1307 | $1,550 | $1.19 | 3d | 1 | 0.93mi |
| 1534 W Euclid St Detroit, MI | 2.0 | 1.0 | 1200 | $1,150 | $0.96 | 12d | 1 | 0.97mi |
| 1542 W Euclid St Detroit, MI | 2.0 | 1.0 | 1100 | $1,150 | $1.05 | 5d | 1 | 0.97mi |
| 1534 W Euclid St Unit 1534 Euclid Detroit, MI | 2.0 | 1.0 | 1200 | $1,150 | $0.96 | 43d | 1 | 0.97mi |
| 613 Belmont St Detroit, MI | 3.0 | 1.0 | 1100 | $1,350 | $1.23 | 17d | 1 | 0.97mi |
| 1226 Virginia Park St Unit 1226 Virginia Park, Upper V 1/10/26 (T) Detroit, MI | 3.0 | 1.0 | 1100 | $1,200 | $1.09 | 43d | 1 | 0.99mi |
| 101 Colorado St Unit NA Highland Park, MI | 4.0 | 1.5 | 1695 | $1,500 | $0.88 | 24d | 1 | 1.00mi |
| 2302 Hazelwood St Unit 1 Detroit, MI | 3.0 | 1.0 | 1550 | $1,273 | $0.82 | 24d | 1 | 1.00mi |
| 8263 Merrill St Detroit, MI | 2.0 | 1.5 | 1092 | $1,600 | $1.47 | 43d | 1 | 1.04mi |
| 165 Rhode Island St Highland Park, MI | 4.0 | 1.5 | 1639 | $1,200 | $0.73 | 17d | 1 | 1.04mi |
| 419 King St Detroit, MI | 3.0 | 1.0 | 1668 | $2,300 | $1.38 | 10d | 1 | 1.05mi |
| 2634 Lawrence St Detroit, MI | 3.0 | 1.5 | 1388 | $1,600 | $1.15 | 1d | 1 | 1.06mi |
| 2653 Calvert Ave Unit 1 Detroit, MI | 3.0 | 1.0 | 1305 | $1,200 | $0.92 | 43d | 1 | 1.07mi |
| 2655 Collingwood St Detroit, MI | 4.0 | 1.5 | 1881 | $2,700 | $1.44 | 1d | 1 | 1.07mi |
| 2463 Taylor St Detroit, MI | 3.0 | 1.0 | 1350 | $1,100 | $0.81 | 43d | 1 | 1.08mi |
| 1710 Virginia Park St Detroit, MI | 2.0 | 2.0 | 1350 | $1,300 | $0.96 | 5d | 1 | 1.08mi |
| 2727 Calvert Ave Unit 1 Detroit, MI | 3.0 | 1.5 | 1350 | $1,200 | $0.89 | 43d | 1 | 1.13mi |
| 1974 Virginia Park St Detroit, MI | 2.0 | 2.0 | 1200 | $1,995 | $1.66 | 43d | 1 | 1.14mi |
| 2474 Fullerton St Detroit, MI | 3.0 | 1.0 | 1400 | $1,300 | $0.93 | 15d | 1 | 1.16mi |
| 2925 Calvert St Detroit, MI | 3.0 | 1.0 | 1400 | $1,300 | $0.93 | 16d | 1 | 1.20mi |
| 8416 Brush St Detroit, MI | 3.0 | 1.5 | 1200 | $2,200 | $1.83 | 1d | 1 | 1.20mi |
| 8410 Brush St Detroit, MI | 3.0 | 2.5 | 1300 | $2,200 | $1.69 | 1d | 1 | 1.21mi |
| 557 Hague St Detroit, MI | 2.0 | 1.0 | 1250 | $1,400 | $1.12 | 43d | 1 | 1.21mi |
| 528 E Philadelphia St Detroit, MI | 3.0 | 1.0 | 1625 | $2,400 | $1.48 | 1d | 1 | 1.25mi |
| 2047 Seward St Detroit, MI | 3.0 | 1.0 | 1421 | $1,523 | $1.07 | 5d | 1 | 1.26mi |
Listing history 32 events
-
2026-06-18days on market $134,900 Active 58 DOM
-
2026-06-17days on market $134,900 Active 57 DOM
-
2026-06-15days on market $134,900 Active 55 DOM
-
2026-06-13days on market $134,900 Active 53 DOM
-
2026-06-13days on market $134,900 Active 52 DOM
-
2026-06-09days on market $134,900 Active 49 DOM
-
2026-06-08days on market $134,900 Active 48 DOM
-
2026-06-07days on market $134,900 Active 47 DOM
-
2026-06-04days on market $134,900 Active 44 DOM
-
2026-06-03days on market $134,900 Active 43 DOM
-
2026-06-02days on market $134,900 Active 42 DOM
-
2026-06-01days on market $134,900 Active 41 DOM
-
2026-05-31days on market $134,900 Active 40 DOM
-
2026-04-21$144,900 Active 935-char remark
Show marketing remark (944 chars)
Investor's dream sitting on a Detroit court and ready for its transformation. 956 Glynn Ct is a 3-bed, 2-bath rehab opportunity with good bones and one of the most valuable features you'll find in this market - a 4-car detached garage that adds immediate utility and serious upside to any exit strategy. The property needs work, and the price reflects it. For the experienced flipper, landlord, or buy-and-hold investor, this is the kind of canvas that rewards vision. Reconfigure, renovate, and refinish to command top-of-market rents or a strong resale number in a city that continues to attract capital and attention. That 4-car garage isn't just a bonus - it's a deal-maker. Workshop, storage rental, contractor bay, or simply a premium selling point for the end buyer. In Detroit's resurgent market, garage space like this is increasingly rare and increasingly valuable. - deals with this footprint and this garage don't sit long.
-
2026-04-21$144,900 Active 944-char remark
Show marketing remark (944 chars)
Investor's dream sitting on a Detroit court and ready for its transformation. 956 Glynn Ct is a 3-bed, 2-bath rehab opportunity with good bones and one of the most valuable features you'll find in this market - a 4-car detached garage that adds immediate utility and serious upside to any exit strategy. The property needs work, and the price reflects it. For the experienced flipper, landlord, or buy-and-hold investor, this is the kind of canvas that rewards vision. Reconfigure, renovate, and refinish to command top-of-market rents or a strong resale number in a city that continues to attract capital and attention. That 4-car garage isn't just a bonus - it's a deal-maker. Workshop, storage rental, contractor bay, or simply a premium selling point for the end buyer. In Detroit's resurgent market, garage space like this is increasingly rare and increasingly valuable. - deals with this footprint and this garage don't sit long.
-
2026-04-21$144,900 Active
Show marketing remark (944 chars)
Investor's dream sitting on a Detroit court and ready for its transformation. 956 Glynn Ct is a 3-bed, 2-bath rehab opportunity with good bones and one of the most valuable features you'll find in this market - a 4-car detached garage that adds immediate utility and serious upside to any exit strategy. The property needs work, and the price reflects it. For the experienced flipper, landlord, or buy-and-hold investor, this is the kind of canvas that rewards vision. Reconfigure, renovate, and refinish to command top-of-market rents or a strong resale number in a city that continues to attract capital and attention. That 4-car garage isn't just a bonus - it's a deal-maker. Workshop, storage rental, contractor bay, or simply a premium selling point for the end buyer. In Detroit's resurgent market, garage space like this is increasingly rare and increasingly valuable. - deals with this footprint and this garage don't sit long.
-
2023-06-27soldstatus $97,000 Sold
-
2023-06-27soldstatus $97,000 Closed
-
2023-06-26status Pending
-
2023-06-26status Pending
-
2023-05-18price $99,900
-
2023-05-18price $99,900
-
2023-05-10price $114,900
-
2023-05-10price $114,900
-
2023-04-26$115,000 Active
-
2023-04-26$115,000 Active
-
2017-11-04historical
-
2017-11-04historical
-
2017-08-04status Active
-
2017-08-02historical
-
2017-07-29$39,900 Active
-
2017-07-29$39,900 Active
ⓘ Source: listings_history table (triggers on properties + properties_extension) + one-shot
backfill from property_details.listing_events for pre-trigger history.
Tax reassessment forecast MI · Partial reset (capped growth)
- Current annual tax
- $1,954 · $163/mo
- Projected year-2 tax
- $2,016 · $168/mo
- Expected delta
- +$62/yr (+$5/mo · 3.2%)
ⓘ Screening estimate from a state-policy table — verify with the county assessor before closing.
Climate risk First Street
- Flood 1/10 Low FEMA zone X (unshaded) · 0% chance over 30 yrs
- Wildfire 1/10 Low
- Heat 3/10 Moderate 7 d/yr ≥96°F today · 14 d/yr by 30 yrs out
- Wind 2/10 Low
- Air quality 4/10 Moderate 4 unhealthy d/yr today · 6 by 30 yrs out
Nearby sold comps map
Loading sold comps map…
Walkable amenities ~0.75 mi
Loading nearby amenities…
Taxation est. · year 1
- Rental income
- $19,917
- − Mortgage interest
- −$7,556
- − Property taxes
- −$1,954
- − Insurance
- −$674
- − Repairs & maintenance
- −$1,593
- − Management
- −$1,593
- − Depreciation
- −$3,924
- Taxable income
- $2,621
- Est. tax owed @ 24.0%
- −$629
- After-tax cash flow
- $3,988/yr
For passive investors: Depreciation is non-cash, so a rental often shows a tax loss while cash-flowing — sheltering income. Rental losses are passive: they offset passive income freely, and up to $25,000/yr can offset ordinary (W-2) income if you actively participate and your MAGI is under $100k (phasing out to $0 by $150k); unused losses carry forward. On sale, claimed depreciation is recaptured at up to 25%, and gains may owe capital-gains tax (a 1031 exchange can defer both). Figures are a year-1 estimate at your 24.0% rate — not tax advice; consult a CPA.
Schools (NCES district)
- District
- Detroit Public Schools Community District
- NCES district ID
- 2601103
- Math proficiency
- 10% ▼ -2.00%
- Reading proficiency
- 24% ▲ 6.00%
- Median HH income
- $25,815
- Composite
- 13.06/100
- National rank
- #9564
- State rank
- #499 of 540 in MI
Livability — Detroit
- Score
- 73/100
- State rank
- #218
- US rank
- #5427
Category grades
Schools grade is shown separately in the Schools card above.
Census & demographics
- Census place
- Detroit, MI
- County
- Wayne County · 1,562,939 people
- City population
- 572,865
- Metro
- Detroit-Warren-Dearborn, MI
- Population (ZIP)
- 15,780
- Household income
- $43,627
- Rent vs Own
- Severe rent burden
- 1258.0
Population outlook (Wayne County) Hauer SSP2
- Today (2025)
- 1,675,273 people
- By 2030
- 1,620,300 · -3.3%
- By 2040
- 1,502,341 · -10.3%
- By 2050
- 1,384,039 · -17.4%
- By 2075
- 1,124,592 · -32.9%
- By 2100
- 881,193 · -47.4%
Race, ethnicity, and origin ACS 2023
- Neighborhood character
- Diverse neighborhood (Simpson 0.57)
- Race & ethnicity
- Black 60% White 26% Asian 6% Two or more races 4% Hispanic / Latino 3%
- Common ancestry
- Romanian 3% Slovak 1% Lithuanian 1%
- Foreign-born
- 8% · Canada, Vietnam
- Languages at home
- 90% English-only · Other Indo-European 3% Arabic 2% Spanish 2%
Political lean MEDSL · Wayne
- 2024 margin
- Strong D (+29.0) · D 62.7% · R 33.7% · Other 3.6%
- 2008→2024 swing
- -20.5pp toward R · 2008: 49.5pp · 2024: 29.0pp
- All cycles
- 2024: D+29.0 2020: D+38.1 2016: D+37.3 2012: D+46.9 2008: D+49.5
Not yet ingested
- Civics
- —
Market trends
- HPI YoY
- ▼ -239.24%
- Current HPI
- 145.5509
- Rent YoY
- ▼ -5.13%
- Metro
- Detroit-Warren-Dearborn, MI
- State GDP YoY
- ▲ 1.37%
- F500 in state
- 28
Industry mix (Fortune 500 HQ in MI)
| Industry | F500 HQs | Revenue |
|---|---|---|
| Automotive Parts | 3 | $48B |
|
||
| Automotive | 2 | $372B |
|
||
| Chemicals | 1 | $45B |
|
||
| Automotive Retail | 1 | $29B |
|
||
| Healthcare / Medical Devices | 1 | $23B |
|
||
| Automotive Technology | 1 | $20B |
|
||
Price history
+263.2% since first listed19 events — show timeline
- 2026-04-21 Listed $144,900 MiRealSource-MiMLS
- 2026-04-21 Listed $144,900 SW Michigan MLS
- 2026-04-21 Listed $144,900 REALCOMP
- 2023-06-27 Sold (MLS) $97,000 MiRealSource-MiMLS
- 2023-06-27 Sold (MLS) $97,000 REALCOMP
- 2023-06-26 Pending — MiRealSource-MiMLS
- 2023-06-26 Pending — REALCOMP
- 2023-05-18 Price Changed $99,900 MiRealSource-MiMLS
- 2023-05-18 Price Changed $99,900 REALCOMP
- 2023-05-10 Price Changed $114,900 MiRealSource-MiMLS
- 2023-05-10 Price Changed $114,900 REALCOMP
- 2023-04-26 Listed $115,000 MiRealSource-MiMLS
- 2023-04-26 Listed $115,000 REALCOMP
- 2017-11-04 Listing Removed — REALCOMP
- 2017-11-04 Listing Removed — MiRealSource-MiMLS
- 2017-08-04 Relisted — REALCOMP
- 2017-08-02 Listing Removed — REALCOMP
- 2017-07-29 Listed $39,900 MiRealSource-MiMLS
- 2017-07-29 Listed $39,900 REALCOMP
Property tax history
+25.5%/yrLatest (2025): $1,954 · -10.0% YoY. Source: county tax records.
Cash-flow waterfall
monthlySold comps — $/sqft
last 12 mo · ≤1 miLoading sold comps…