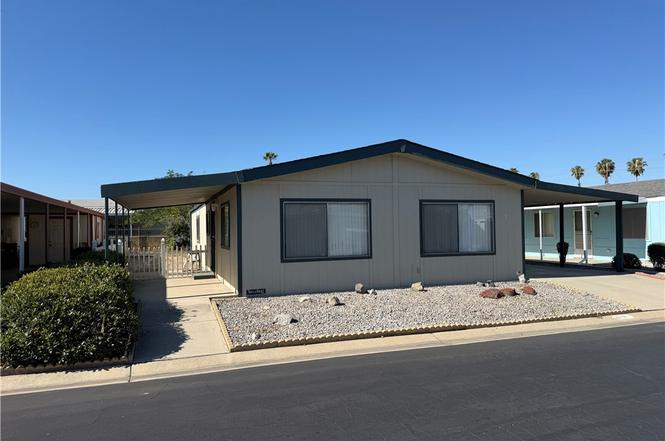
1250 N Kirby St #9 · Hemet, CA
Flood risk 3/10 · Minor
- FEMA flood zone
- X (unshaded)
- Chance of flooding over 30 yrs
- 0.2%
- Est. flood insurance / yr
- $507 – $1,088
Fire risk 4/10 · Minor
- Est. fire insurance / yr
- $659 – $1,223
Heat risk 8/10 · Major
- Hot days now (above 104°F)
- 7 days/yr
- Hot days in 30 yrs
- 19 days/yr
Wind risk 1/10 · Minimal
- Chance of severe wind over 30 yrs
- —
Air-quality risk 6/10 · Moderate
- Unhealthy air days now
- 12 days/yr
- Unhealthy air days in 30 yrs
- 14 days/yr
Risk factors via First Street. Map © Google.
Why this score? — see what drove the B+ grade
The composite is a weighted blend of 9 inputs, each scored 0–100. Each bar is that input's sub-score; the figure is the points it added to the 100-point composite (weight × sub-score).
- Cash flow +30.0/30.0
- ARV discount +15.0/15.0
- 1% rule +10.0/10.0
- DSCR +10.0/10.0
- Rent growth +3.4/5.0
- Livability +2.6/5.0
- Schools +2.5/10.0
- Condition / age +2.5/5.0
- Appreciation +0.0/10.0
$69,900
🖨 Deal sheet 📄 Offer letter ✓ Due diligence
Listing remarks
Motivated seller would like you to make an appointment to see this spacious 2 bedroom, 2 bath manufactured home w/ 1,344 sqft in the desired senior 55+ Foothills of Hemet park. Kitchen opens up to living/dining area w/ built-in hutch. Ceiling fans throughout. Inside laundry room has lots of cabinets for storage and gas/electric hookups. Within 7 years ago new energy efficient HVAC, water heater & faucets were installed. Interior & exterior have recently been painted. Home fumigated in June, and comes with a warranty from Orkin. Long carport with a 10'x10' shed w/ electric at the end. Unlike most homes in parks, this one has a large backyard. The park is clean, quiet, gated and j
Key facts
- Built in hutch
- New faucets
- New water heater
Tags
Property features AI
Finance
- Other: Rent includes pool; One shed on the property; Mobile dimensions approximately 24 ft by 56 ft; Directions: Enter park on Kirby, make a quick right following it as it turns left, home is on the right; Seller will remove current gas range and replace with another one; All curtains, drapes and rods are excluded
- Financial info: Land lease (park) monthly
- HOA & community: Senior community; Park name: Foothills of Hemet; Community features include gutters and curbs; Manager approval required; Pets: call for policy
Exterior
- Parking: Covered parking; Attached carport; Has parking
- Security: Gated community; Card/code access; Carbon monoxide detector; Smoke detector
- Utilities: Standard electric service; Natural gas connected; Public sewer; Water connected (district/public); Sewer connected; Electricity connected
- Home design: Single-story mobile home (model: Woodfield); Entry at front door; One entry level
- Construction: Pier jacks foundation; Mobile home remains; Updated/remodeled condition; Termite clearance
- Exterior features: Covered porch; Awning; Rain gutters; Covered patio; Pool access via association; Shed; Wood fencing; Located close to clubhouse; North-facing; Has a view
Interior
- Kitchen: Formica counters; Kitchen open to family room; Gas range; Range/stove hood; Dishwasher; Garbage disposal; Water heater unit
- Bedrooms: Primary bedroom; All bedrooms on one level
- Flooring: Tile; Vinyl; Carpet
- Bathrooms: Two full bathrooms; Bathtub; Shower in tub; Walk-in shower
- Heating & cooling: Central furnace heating; Central electric cooling; Evaporative cooling; Energy Star cooling
- Interior features: Ceiling fan; Mirrored closet doors; Blinds and window screens; Card/code access, carbon monoxide detector, smoke detector; Gated community; Association spa
- Laundry & utility: Inside laundry room; Individual laundry room; Gas and electric dryer hookup
Neighborhood map
What this means for you Summary
Snapshot
- This is a 2-bed/2.0-bath manufactured listed at $70k.
Deal economics
- At list price, monthly cash flow is $1k ($16k/yr) — positive.
- The deal already cash-flows at list — no discount required.
- Meets the 1% rule at list price ($2k rent vs $70k).
- Cap rate 29.5% vs local median 4.9% in Hemet — top-decile yield for the area; either an underpriced asset or a hidden risk that comps aren't pricing in. Stress-test before assuming the spread holds.
Location & tenants
- Location reads 51/100 on livability (#1,056 in CA) — a working-class tenant base; expect higher turnover. Strengths: housing A+; Watch: crime D+, schools F, amenities F.
- Hemet Unified (suburban): math 19% / reading 41% proficiency, ranked #360 of 517 in CA (top 70%) — families likely to look elsewhere, expect single-tenant / working-renter base with shorter leases; 66% free/reduced lunch — lower-income household profile, screen leases tightly.
- Market conditions: Rents rising (+3.7%/yr); 290 active listings in the ZIP; 27 comparable units currently listed for rent nearby; rentals at typical pace (median 24d on market — plan ~3-4 weeks tenant-placement turnaround); 9,195 units permitted in Riverside County in 2024 (1,512 in 5+ unit buildings).
- This rent runs 42% of the median local income ($64k/yr) — at the standard rent-burdened threshold; future hikes will face affordability resistance.
Forward outlook
- Local home prices are declining (-3.0%/yr); year-one equity from $483 of loan paydown is wiped out by about $2k of value loss. Plan a longer hold.
- Riverside County population projected at +22% by 2050 — long-run rental-demand tailwind backs the buy-and-hold thesis.
- At projected returns (-3.0% appreciation + 3.7% rent growth), your $20k cash investment doubles in ~2 years — after that, you're playing with house money.
Negotiation context
- Only 2 days on market — expect competitive offers; lowballing is unlikely to land.
- 18 sale attempts since 19y ago with the ask held roughly flat each time — persistent listings suggest the price (not the market) is what's stuck; bring a comps-based counter.
Risks & watch-outs
- Climate carrying-cost: extreme-heat days projected 7→19/yr by 2055 (HVAC capex compounding) — expect insurance premiums to compound above CPI over the hold.
Questions for the listing agent
- Is there a deadline driving the sale (1031 exchange, divorce, estate, relocation)? That informs how much negotiation room exists.
- Schools are F-rated, which usually means shorter tenancies and higher turnover. Who's the typical renter profile here, and what's been the actual vacancy rate?
- Crime grade is D in this area — have there been break-ins, vandalism, or insurance claims at this property in the last 3 years? What carrier currently insures it and at what premium?
- What's the average days-on-market for RENTAL listings here right now (not sales)? A rising rental-DOM trend means longer vacancies and softer asking-rent achievability than the comps imply.
- What's the recent tenant-quality profile in this submarket — average credit score on applications, eviction rate, late-payment / NSF rate, and stable-employment percentage? A property-management company in the area should have these aggregated.
- How much new for-sale + rental construction is in the pipeline within 1–3 miles? Heavy new supply typically softens prices + rents 12–24 months out; constrained supply supports both.
Investment metrics
- 1% rule
- 3.21% ✓
- Cap rate
- 29.54%
- Cash-on-cash
- 83.01%
- DSCR
- 4.69
- GRM
- 2.6
CMA / ARV
- ARV (on-the-fly)
- $94,080
- Comps found
- 12
Show comp detail 12 sales within ~0.75 mi
| Address | Dist | Beds/Ba | Sqft | Sold | Price | $/sf | Match |
|---|---|---|---|---|---|---|---|
| 1250 N Kirby St #181 | 0.00mi | 3/2.0 (+1) | 1,368 (+2%) | 5mo | $85,000 | $62 | 88 |
| 1250 N Kirby St #127 | 0.00mi | 2/2.0 | 1,440 (+7%) | 4mo | $46,500 | $32 | 84 |
| 1250 N Kirby St #151 | 0.00mi | 3/2.0 (+1) | 1,404 (+4%) | 5mo | $115,000 | $82 | 84 |
| 1250 N Kirby #92 | 0.00mi | 2/2.0 | 1,440 (+7%) | 5mo | $99,900 | $69 | 84 |
| 1250 N Kirby #194 | 0.00mi | 3/2.0 (+1) | 1,440 (+7%) | 4mo | $89,000 | $62 | 80 |
| 1250 N Kirby St #77 | 0.00mi | 2/2.0 | 1,536 (+14%) | 2mo | $91,500 | $60 | 74 |
| 1150 N Kirby St #72 | 0.37mi | 2/2.0 | 1,296 (-4%) | 6mo | $110,000 | $85 | 72 |
| 1250 N Kirby St #138 | 0.00mi | 3/2.0 (+1) | 1,200 (-11%) | 6mo | $110,000 | $92 | 72 |
| 1150 N Kirby #75 | 0.37mi | 3/2.0 (+1) | 1,248 (-7%) | 0mo | $107,000 | $86 | 66 |
| 1300 W Menlo #92 | 0.60mi | 2/2.0 | 1,344 (0%) | 8mo | $94,000 | $70 | 65 |
| 1300 W Menlo Ave #126 | 0.61mi | 2/2.0 | 1,440 (+7%) | 6mo | $90,000 | $63 | 54 |
| 1300 W Menlo Ave #167 | 0.60mi | 3/2.0 (+1) | 1,468 (+9%) | 8mo | $113,500 | $77 | 45 |
Match score weights: distance 35% · size 25% · config 20% · recency 20%. Top-matched comps best support the ARV.
Projected returns pro-forma
-3.0% appreciation · 3.74% rent growth · sell at horizon
- IRR
- 84.1%
- Equity multiple
- 4.91×
- Total profit
- $76,588
- Equity at exit
- $10,422
- IRR
- 87.5%
- Equity multiple
- 10.44×
- Total profit
- $184,733
- Equity at exit
- $6,044
Cash invested: $19,572 (down + closing). Projections, not guarantees.
Landlord ↔ Tenant lean methodology
- Overall (STATE)
- 18 Strongly Tenant-Friendly
- State California
- 18 Strongly Tenant-Friendly · D+13
- County
- — inherits STATE
- City
- — inherits STATE
ZIP-level market 92545
- Home prices YoY
- -24.6%
- Rents YoY
- 3.7%
- Active inventory
- 290
- Price-to-rent
- 2.6×
Monthly cashflow live
- Estimated rent
- $2,247 high interval (Pro) →
- Mortgage (P&I)
- −$367
- Tax from tax record
- −$25 /mo · $302/yr
- Insurance
- −$29
- HOA
- −$0
- Vacancy / Maint / Mgmt
- −$472
- Net cashflow
- $1,354
Break-even live
UW: 25.0% down · 7.5% · 30yr · 1.5% tax · 5.0% vac · 8.0% maint · 8.0% mgmt
Financing live
Cash to close
- Down payment
- $17,475
- Closing costs
- $2,097
- Reserves months
- —
- Total cash needed
- —
Loan-product check · same deal, 3 products live
Conventional
25% down · 7.5% · 30yr
- Down + closing
- —
- Monthly P&I
- —
- Monthly cashflow
- —
- DSCR
- —
- Eligible?
- —
Personal DTI + credit; lowest rate.
DSCR
20% down · 8.5% · 30yr
- Down + closing
- —
- Monthly P&I
- —
- Monthly cashflow
- —
- DSCR
- —
- Eligible?
- —
No personal income docs; deal must DSCR.
Hard money
10% down · 12.0% · 12mo
- Down + closing
- —
- Monthly P&I
- —
- Monthly cashflow
- —
- DSCR
- —
- Eligible?
- —
Short-term bridge; refi at stabilization.
Rent comps 27 comps
| Address | Beds | Baths | Sqft | Rent | $/sqft | DOM | Units | Dist |
|---|---|---|---|---|---|---|---|---|
| 2208 El Grande St Hemet, CA | 2.0 | 2.0 | 1327 | $2,100 | $1.58 | 17d | 1 | 0.47mi |
| 1844 Paradise Way San Jacinto, CA | 3.0 | 2.0 | 1540 | $3,000 | $1.95 | 43d | 1 | 0.57mi |
| 2014 Iris Way Hemet, CA | 3.0 | 2.0 | 1192 | $2,850 | $2.39 | 43d | 1 | 0.59mi |
| 1700 Walden Ln Hemet, CA | 3.0 | 2.0 | 1430 | $2,670 | $1.87 | 24d | 1 | 0.62mi |
| 1967 Connor Ln San Jacinto, CA | 3.0 | 2.5 | 1708 | $2,950 | $1.73 | 7d | 1 | 0.67mi |
| 828 Coramdeo Ct Hemet, CA | 3.0 | 2.0 | 1543 | $3,000 | $1.94 | 43d | 1 | 0.69mi |
| 853 Ensenada Dr Hemet, CA | 2.0 | 2.0 | 1350 | $1,875 | $1.39 | 24d | 1 | 0.81mi |
| 853 Ensenada Dr Hemet, CA | 2.0 | 2.0 | 1350 | $1,875 | $1.39 | 11d | 1 | 0.81mi |
| 1245 Millie Dr Hemet, CA | 3.0 | 2.0 | 1392 | $2,850 | $2.05 | 7d | 1 | 0.84mi |
| 811 Alondra Dr Hemet, CA | 2.0 | 2.0 | 1166 | $1,875 | $1.61 | 4d | 1 | 0.87mi |
| 663 Mariposa Dr Hemet, CA | 2.0 | 2.0 | 1440 | $1,500 | $1.04 | 24d | 1 | 0.88mi |
| 627 Solano Dr Hemet, CA | 2.0 | 2.0 | 882 | $1,800 | $2.04 | 18d | 1 | 0.89mi |
| 543 La Cresta Dr Hemet, CA | 2.0 | 2.0 | 1544 | $1,595 | $1.03 | 43d | 1 | 0.92mi |
| 1559 Park Meadows Dr San Jacinto, CA | 3.0 | 2.0 | 1644 | $2,675 | $1.63 | 43d | 1 | 0.92mi |
| 1964 W Oakland Ave Hemet, CA | 2.0 | 2.0 | 977 | $1,695 | $1.73 | 17d | 1 | 0.97mi |
| 1862 Pueblo Dr Unit 1862 Hemet, CA | 2.0 | 2.0 | 977 | $1,750 | $1.79 | 24d | 1 | 1.01mi |
| 1862 Pueblo Dr Hemet, CA | 2.0 | 2.0 | 977 | $1,900 | $1.94 | 43d | 1 | 1.01mi |
| 743 Via Linda Dr Hemet, CA | 2.0 | 2.0 | 1206 | $1,995 | $1.65 | 5d | 1 | 1.05mi |
| 446 N Elk St Unit D Hemet, CA | 2.0 | 1.0 | 980 | $1,675 | $1.71 | 24d | 1 | 1.07mi |
| 1270 Rosalia Ave Unit 1 Hemet, CA | 2.0 | 1.0 | 900 | $1,800 | $2.00 | 43d | 1 | 1.14mi |
| 1106 Don Carlos Ct San Jacinto, CA | 3.0 | 2.0 | 1389 | $2,999 | $2.16 | 43d | 1 | 1.20mi |
| 1410 Cottonwood Ave San Jacinto, CA | 2.0 | 1.5 | 1257 | $2,300 | $1.83 | 43d | 1 | 1.27mi |
| 2770 W Devonshire Ave Hemet, CA | 1.0–2.0 | 1.0–2.0 | 707 | $1,945 | $2.75 | 1d | 11 | 1.28mi |
| 1066 Birch Ln San Jacinto, CA | 3.0 | 2.0 | 1785 | $2,600 | $1.46 | 4d | 1 | 1.30mi |
| 250 N Elk St Hemet, CA | 2.0 | 1.0 | 900 | $1,625 | $1.81 | 13d | 1 | 1.33mi |
| 3471 Dublin Ct Hemet, CA | 3.0 | 2.0 | 1276 | $2,895 | $2.27 | 3d | 1 | 1.41mi |
| 1315 W Latham Ave Hemet, CA | 3.0 | 2.5 | 1340 | $2,550 | $1.90 | 43d | 1 | 1.43mi |
Listing history 3 events
-
2026-06-18days on market $69,900 Active 2 DOM
-
2026-06-16remarks 691-char remark
-
2026-06-16$69,900 Active 1 DOM
ⓘ Source: listings_history table (triggers on properties + properties_extension) + one-shot
backfill from property_details.listing_events for pre-trigger history.
Tax reassessment forecast CA · Resets to sale price
- Current annual tax
- $302 · $25/mo
- Projected year-2 tax
- $531 · $44/mo
- Expected delta
- +$230/yr (+$19/mo · 76.2%)
ⓘ Screening estimate from a state-policy table — verify with the county assessor before closing.
Climate risk First Street
- Flood 3/10 Moderate FEMA zone X (unshaded) · 20% chance over 30 yrs
- Wildfire 4/10 Moderate
- Heat 8/10 Severe 7 d/yr ≥104°F today · 19 d/yr by 30 yrs out
- Wind 1/10 Low
- Air quality 6/10 Major 12 unhealthy d/yr today · 14 by 30 yrs out
Nearby sold comps map
Loading sold comps map…
Walkable amenities ~0.75 mi
Loading nearby amenities…
Taxation est. · year 1
- Rental income
- $26,959
- − Mortgage interest
- −$3,915
- − Property taxes
- −$302
- − Insurance
- −$350
- − Repairs & maintenance
- −$2,157
- − Management
- −$2,157
- − Depreciation
- −$2,033
- Taxable income
- $16,045
- Est. tax owed @ 24.0%
- −$3,851
- After-tax cash flow
- $12,397/yr
For passive investors: Depreciation is non-cash, so a rental often shows a tax loss while cash-flowing — sheltering income. Rental losses are passive: they offset passive income freely, and up to $25,000/yr can offset ordinary (W-2) income if you actively participate and your MAGI is under $100k (phasing out to $0 by $150k); unused losses carry forward. On sale, claimed depreciation is recaptured at up to 25%, and gains may owe capital-gains tax (a 1031 exchange can defer both). Figures are a year-1 estimate at your 24.0% rate — not tax advice; consult a CPA.
Schools (NCES district)
- District
- Hemet Unified
- NCES district ID
- 0616920
- Math proficiency
- 19% ▼ -3.00%
- Reading proficiency
- 41% ▲ 4.00%
- Median HH income
- $39,962
- Composite
- 25.16/100
- National rank
- #7517
- State rank
- #360 of 517 in CA
Livability — Hemet
- Score
- 51/100
- State rank
- #1056
- US rank
- #25208
Category grades
Schools grade is shown separately in the Schools card above.
Census & demographics
- Census place
- Hemet, CA
- County
- Riverside County · 2,287,001 people
- City population
- 137,670
- Metro
- Riverside-San Bernardino-Ontario, CA
- Population (ZIP)
- 45,982
- Household income
- $63,770
- Rent vs Own
- Severe rent burden
- 1813.0
Population outlook (Riverside County) Hauer SSP2
- Today (2025)
- 2,664,475 people
- By 2030
- 2,802,692 · +5.2%
- By 2040
- 3,050,904 · +14.5%
- By 2050
- 3,256,783 · +22.2%
- By 2075
- 3,655,058 · +37.2%
- By 2100
- 3,766,594 · +41.4%
Race, ethnicity, and origin ACS 2023
- Neighborhood character
- Diverse neighborhood (Simpson 0.65)
- Race & ethnicity
- Hispanic / Latino 46% White 35% Two or more races 17% Black 8% Asian 5% Native American 1%
- Hispanic origin (detail)
- Mexican 40%
- Common ancestry
- Slovak 2% Lithuanian 2% Portuguese 1%
- Foreign-born
- 19% · Canada, Vietnam, Jamaica
- Languages at home
- 69% English-only · Spanish 27% Tagalog/Filipino 1% Other Indo-European 1%
Political lean MEDSL · Riverside
- 2024 margin
- Toss-up / Even · D 48.0% · R 49.3% · Other 2.6%
- 2008→2024 swing
- -3.6pp toward R · 2008: 2.3pp · 2024: -1.3pp
- All cycles
- 2024: R+1.3 2020: D+8.0 2016: D+4.3 2012: R+0.4 2008: D+2.3
Not yet ingested
- Civics
- —
Market trends
- HPI YoY
- ▼ -116.25%
- Current HPI
- 356.9414
- Rent YoY
- ▲ 3.74%
- Metro
- Riverside-San Bernardino-Ontario, CA
- State GDP YoY
- ▲ 3.21%
- F500 in state
- 116
Industry mix (Fortune 500 HQ in CA)
| Industry | F500 HQs | Revenue |
|---|---|---|
| Technology | 27 | $1,492B |
|
||
| Financial Services | 3 | $174B |
|
||
| Retail | 3 | $44B |
|
||
| Insurance | 3 | $26B |
|
||
| Media / Entertainment | 2 | $115B |
|
||
| Pharmaceuticals / Biotech | 2 | $62B |
|
||
Price history
+0.6% since first listed50 events — show timeline
- 2026-06-16 Listed $69,900 CRMLS
- 2026-06-15 Coming Soon $69,900 CRMLS
- 2025-02-07 Listing Removed — bridgeMLS, Bay East AOR, or Contra Costa AOR
- 2025-02-06 Listing Removed — CRMLS
- 2025-01-26 Price Changed $79,900 CRMLS
- 2025-01-26 Price Changed $86,900 CRMLS
- 2024-07-25 Price Changed $88,900 CRMLS
- 2024-06-26 Listed $90,000 CRMLS
- 2024-06-26 Listed — bridgeMLS, Bay East AOR, or Contra Costa AOR
- 2024-06-13 Listing Removed — CRMLS
- 2024-05-20 Price Changed $84,900 CRMLS
- 2024-05-13 Price Changed $85,900 CRMLS
- 2024-04-12 Price Changed $89,900 CRMLS
- 2024-03-20 Listed $95,000 CRMLS
- 2024-02-12 Listing Removed — CRMLS
- 2024-01-31 Price Changed $75,000 CRMLS
- 2024-01-14 Price Changed $79,717 CRMLS
- 2023-10-31 Price Changed $81,000 CRMLS
- 2023-08-22 Price Changed $83,500 CRMLS
- 2023-07-16 Price Changed $85,500 CRMLS
- 2023-07-07 Price Changed $87,900 CRMLS
- 2023-06-30 Listed $89,000 CRMLS
- 2022-11-30 Price Changed $88,000 CRMLS
- 2022-10-14 Relisted — CRMLS
- 2022-09-09 Relisted — CRMLS
- 2022-06-18 Listed $89,000 CRMLS
- 2013-08-21 Delisted — CRMLS
- 2013-07-08 Relisted — CRMLS
- 2013-06-07 Delisted — CRMLS
- 2013-06-06 Relisted — CRMLS
- 2013-06-05 Delisted — CRMLS
- 2013-06-01 Relisted — CRMLS
- 2013-05-31 Delisted — CRMLS
- 2013-01-16 Listed $15,500 CRMLS
- 2013-01-15 Listing Removed — CRMLS
- 2012-08-15 Listed $15,500 CRMLS
- 2012-01-17 Listing Removed — CRMLS
- 2011-09-30 Price Changed $22,900 CRMLS
- 2011-06-11 Price Changed $25,000 CRMLS
- 2011-03-23 Price Changed $27,000 CRMLS
- 2011-01-30 Price Changed $37,000 CRMLS
- 2010-09-08 Listed $47,000 CRMLS
- 2010-09-01 Listing Removed — CRMLS
- 2010-03-22 Relisted — CRMLS
- 2010-03-19 Listing Removed — CRMLS
- 2010-02-04 Listed $49,900 CRMLS
- 2008-01-01 Listing Removed — CRMLS
- 2007-11-01 Listing Removed — CRMLS
- 2007-07-19 Listed $69,500 CRMLS
- 2007-05-04 Listed $69,500 CRMLS
Property tax history
-0.2%/yrLatest (2025): $302 · +6.4% YoY. Source: county tax records.
Cash-flow waterfall
monthlySold comps — $/sqft
last 12 mo · ≤1 miLoading sold comps…