 Multi-family
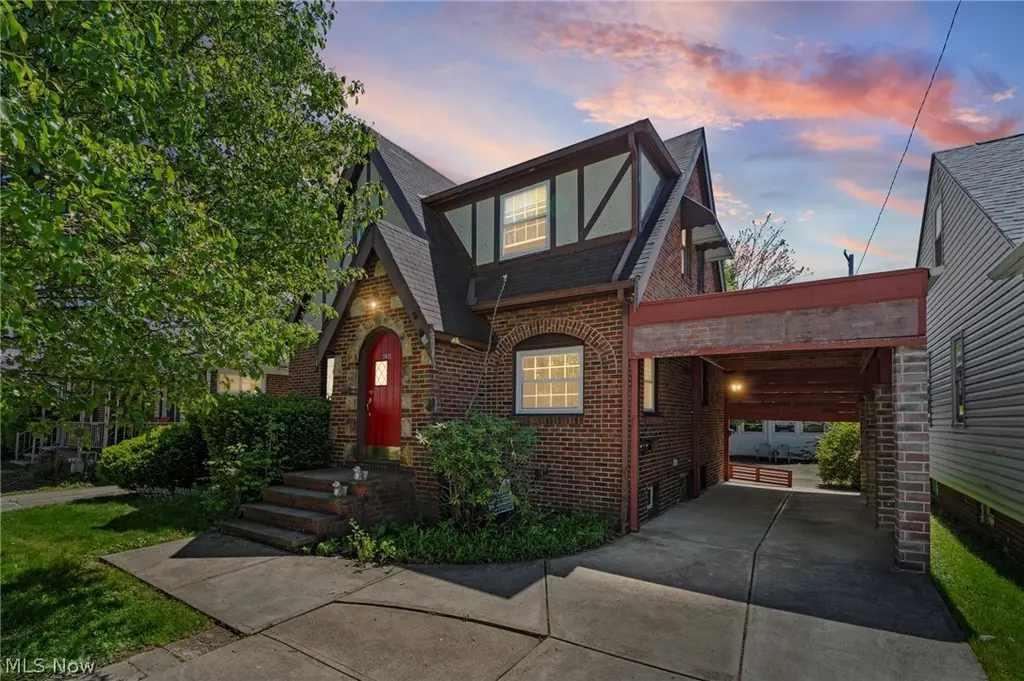
7411 Wooster · Parma, OH
Flood risk 1/10 · Minimal
- FEMA flood zone
- X (unshaded)
- Chance of flooding over 30 yrs
- 0.0%
- Est. flood insurance / yr
- $473 – $860
Fire risk 1/10 · Minimal
- Est. fire insurance / yr
- $713 – $1,323
Heat risk 3/10 · Minor
- Hot days now (above 95°F)
- 7 days/yr
- Hot days in 30 yrs
- 17 days/yr
Wind risk 1/10 · Minimal
- Chance of severe wind over 30 yrs
- —
Air-quality risk 3/10 · Minor
- Unhealthy air days now
- 2 days/yr
- Unhealthy air days in 30 yrs
- 4 days/yr
Risk factors via First Street. Map © Google.
Why this score? — see what drove the B grade
The composite is a weighted blend of 9 inputs, each scored 0–100. Each bar is that input's sub-score; the figure is the points it added to the 100-point composite (weight × sub-score).
- Cash flow +28.0/30.0
- ARV discount +15.0/15.0
- DSCR +10.0/10.0
- 1% rule +7.7/10.0
- Schools +4.1/10.0
- Livability +4.1/5.0
- Rent growth +3.6/5.0
- Condition / age +2.5/5.0
- Appreciation +0.0/10.0
$175,000
🖨 Deal sheet 📄 Offer letter ✓ Due diligence
Multi-family units
County records classify this as Multi-Family (2-4 Unit). Listing-text estimate: 1 unit. estimate disagrees with records
Listing remarks MLS
Very Unique Opportunity * * Large Single Family Home In Front W/ A Small Home In The Rear * * Front Home-brick Tudor, Hardwood Floors, Fireplace, Full Finished Bsmt-absolutely Stunning * * Rear Home-1 Bedroom, 1 Bath, 2nd Floor, Full Basement * * Tons Of Possibilities * *
Key facts
- Private in-law suite
- Oversized sunroom
- 5,118 sq ft lot
Tags
Property features AI
Finance
- Other: Above-grade finished area reported as 1,378 (source: Realist)
Exterior
- Parking: Carport and driveway
- Utilities: Public water; Public sewer
- Home design: Two-story configuration; Brick construction; Asphalt roof
- Construction: Built (year from public records); Brick exterior; Asphalt roof; Unfinished basement foundation
- Exterior features: Two buildings on the property; Driveway; Carport (1 space)
Interior
- Bedrooms: Main home includes three bedrooms; Back property unit includes one bedroom
- Bathrooms: Main home has three bathrooms (total); Back property unit has one bathroom (total); Overall listing shows 2 full bathrooms and 1 half bathroom
- Heating & cooling: Forced air heating
- Interior features: Unfinished basement; Total of 9 rooms
Neighborhood map
What this means for you Summary
Snapshot
- This is a 4-bed/1.0-bath multifamily listed at $175k.
Deal economics
- At list price, monthly cash flow is $546 ($7k/yr) — positive.
- The deal already cash-flows at list — no discount required.
- Meets the 1% rule at list price ($2k rent vs $175k).
- Recommended offer: $170k (3.0% below list) — sets the bar for market timing.
- Cap rate 10.0% vs local median 5.0% in Parma — top-decile yield for the area; either an underpriced asset or a hidden risk that comps aren't pricing in. Stress-test before assuming the spread holds.
Location & tenants
- Location reads 82/100 on livability (#84 in OH, #1,232 nationally) — a professional / high-income tenant draw. Strengths: crime A+, amenities A+, cost of living A+; Watch: employment C-, commute F.
- Parma City (suburban): math 43% / reading 52% proficiency, ranked #469 of 656 in OH (top 72%) — families likely to look elsewhere, expect single-tenant / working-renter base with shorter leases.
- Market conditions: Rents rising fast (+4.3%/yr); 85 active listings in the ZIP; 19 comparable units currently listed for rent nearby; rentals leasing fast (median 8d on market — plan ~1-2 weeks tenant-placement turnaround); 1,441 units permitted in Cuyahoga County in 2024 (700 in 5+ unit buildings).
- This rent runs 38% of the median local income ($71k/yr) — at the standard rent-burdened threshold; future hikes will face affordability resistance.
Forward outlook
- Local home prices are declining (-3.0%/yr); year-one equity from $1k of loan paydown is wiped out by about $5k of value loss. Plan a longer hold.
- Cuyahoga County population projected to shrink 8% by 2050 — rents likely to lag national; underwrite the cash flow, not the appreciation.
- At projected returns (-3.0% appreciation + 4.3% rent growth), your $49k cash investment doubles in ~8 years — after that, you're playing with house money.
Negotiation context
- It's been on market 36 days — a 3% lower offer ($170k) is reasonable based on typical stale-listing flexibility.
- 12 sale attempts since 31y ago; this cycle's ask has dropped $25k (12%) from the opening price — seller is motivated, your offer sets the floor, not the list.
- Current owner paid $98k; list at $175k implies a 79% gain — meaningful room to come down on a strong offer.
Risks & watch-outs
- Watch-outs: built in 1933 — expect roof / HVAC / electrical / plumbing capex.
Questions for the listing agent
- It's been on market 36 days. Have you received any prior offers? Is the seller open to a 3% concession, seller financing, or rate buy-down credit?
- Built in 1933 — when were the roof, HVAC, electrical panel, plumbing, and water heater last replaced?
- Is there a deadline driving the sale (1031 exchange, divorce, estate, relocation)? That informs how much negotiation room exists.
- Schools are B-rated — typically a magnet for longer-tenancy family renters. What's the average tenant stay here, and is there a school-zone premium baked into asking?
- What's the average days-on-market for RENTAL listings here right now (not sales)? A rising rental-DOM trend means longer vacancies and softer asking-rent achievability than the comps imply.
- What's the recent tenant-quality profile in this submarket — average credit score on applications, eviction rate, late-payment / NSF rate, and stable-employment percentage? A property-management company in the area should have these aggregated.
- How much new apartment / multifamily construction is in the pipeline within 1–3 miles? Heavy new supply (>2% of stock underway) typically softens rents 12–24 months out; light construction supports rent growth.
Investment metrics
- 1% rule
- 1.27% ✓
- Cap rate
- 10.04%
- Cash-on-cash
- 13.38%
- DSCR
- 1.60
- GRM
- 6.6
CMA / ARV
- ARV (median comp)
- $223,920
- List price
- $175,000
- Delta
- -21.85%
- Verdict
- UNDERPRICED
- Comps
- 8 within 1.0 mi
Show comp detail 3 sales within ~0.75 mi
| Address | Dist | Beds/Ba | Sqft | Sold | Price | $/sf | Match |
|---|---|---|---|---|---|---|---|
| 6606 Theota Ave | 0.48mi | 3/2.0 (-1) | 1,452 (+5%) | 7mo | $175,000 | $121 | 54 |
| 6202 Bradley Ave | 0.61mi | 4/2.5 | 1,413 (+2%) | 20mo | $195,000 | $138 | 44 |
| 6206 Bradley Ave | 0.60mi | 3/2.0 (-1) | 1,533 (+11%) | 0mo | $175,000 | $114 | 44 |
Match score weights: distance 35% · size 25% · config 20% · recency 20%. Top-matched comps best support the ARV.
Projected returns pro-forma
-3.0% appreciation · 4.29% rent growth · sell at horizon
- IRR
- 4.9%
- Equity multiple
- 1.19×
- Total profit
- $9,389
- Equity at exit
- $26,093
- IRR
- 15.5%
- Equity multiple
- 2.34×
- Total profit
- $65,423
- Equity at exit
- $15,131
Cash invested: $49,000 (down + closing). Projections, not guarantees.
Landlord ↔ Tenant lean methodology
- Overall (STATE)
- 73 Landlord-Friendly
- State Ohio
- 73 Landlord-Friendly · R+6
- County
- — inherits STATE
- City
- — inherits STATE
ZIP-level market 44129
- Rents YoY
- 4.3%
- Active inventory
- 85
- Price-to-rent
- 16.0×
Monthly cashflow live
- Estimated rent
- $2,223 high interval (Pro) →
- Mortgage (P&I)
- −$918
- Tax from tax record
- −$219 /mo · $2,631/yr
- Insurance
- −$73
- HOA
- −$0
- Vacancy / Maint / Mgmt
- −$467
- Net cashflow
- $546
Break-even live
Sensitivity live
| Price | -10% $645 | -5% $596 | +0% $546 | +5% $497 | +10% $447 |
|---|---|---|---|---|---|
| Rent | -10% $371 | -5% $458 | +0% $546 | +5% $634 | +10% $722 |
| Rate | -1.0pp $634 | -0.5pp $591 | base $546 | +0.5pp $501 | +1.0pp $455 |
2-unit breakdown (identical units grouped — click to expand)
| Units | Beds | Baths | Est. rent |
|---|---|---|---|
| 1× unit | 1 | 1 | $913 |
| 1× unit | 3 | 2.5 | $1,311 |
| Total (2 units) | $2,223 | ||
UW: 25.0% down · 7.5% · 30yr · 1.5% tax · 5.0% vac · 8.0% maint · 8.0% mgmt
Financing live
Cash to close
- Down payment
- $43,750
- Closing costs
- $5,250
- Reserves months
- —
- Total cash needed
- —
Loan-product check · same deal, 3 products live
Conventional
25% down · 7.5% · 30yr
- Down + closing
- —
- Monthly P&I
- —
- Monthly cashflow
- —
- DSCR
- —
- Eligible?
- —
Personal DTI + credit; lowest rate.
DSCR
20% down · 8.5% · 30yr
- Down + closing
- —
- Monthly P&I
- —
- Monthly cashflow
- —
- DSCR
- —
- Eligible?
- —
No personal income docs; deal must DSCR.
Hard money
10% down · 12.0% · 12mo
- Down + closing
- —
- Monthly P&I
- —
- Monthly cashflow
- —
- DSCR
- —
- Eligible?
- —
Short-term bridge; refi at stabilization.
Rent comps 19 comps
| Address | Beds | Baths | Sqft | Rent | $/sqft | DOM | Units | Dist |
|---|---|---|---|---|---|---|---|---|
| 7514 Bertha Ave Cleveland, OH | 5.0 | 2.0 | 1672 | $1,776 | $1.06 | 2d | 1 | 0.33mi |
| 6505 Snow Rd Unit REAR Parma, OH | 3.0 | 1.5 | 1312 | $1,599 | $1.22 | 8d | 1 | 0.42mi |
| 8326 Fernhill Ave Cleveland, OH | 3.0 | 1.0 | 1350 | $1,700 | $1.26 | 44d | 1 | 0.46mi |
| 6511 Luelda Ave Unit Na Parma, OH | 3.0 | 2.0 | 1577 | $1,975 | $1.25 | 44d | 1 | 0.63mi |
| 5606 Theota Ave Cleveland, OH | 3.0 | 1.5 | 1676 | $1,400 | $0.84 | 8d | 1 | 0.71mi |
| 5606 Theota Ave Cleveland, OH | 3.0 | 1.5 | 1676 | $1,400 | $0.84 | 4d | 1 | 0.71mi |
| 5876 Wickfield Dr Cleveland, OH | 5.0 | 2.0 | 1316 | $1,900 | $1.44 | 2d | 1 | 0.75mi |
| 7906 Lanyard Dr Unit 1496071P Parma, OH | 4.0 | 1.5 | 1227 | $5,834 | $4.75 | 8d | 1 | 0.81mi |
| 6007 Merkle Ave Unit Down Parma, OH | 3.0 | 1.0 | 1250 | $1,399 | $1.12 | 2d | 1 | 0.81mi |
| 9703 Snow Rd Cleveland, OH | 3.0 | 1.0 | 1103 | $1,675 | $1.52 | 3d | 1 | 0.91mi |
| 4606 Lincoln Ave Cleveland, OH | 3.0 | 2.0 | 1418 | $1,995 | $1.41 | 2d | 1 | 1.04mi |
| 6236 Westminster Dr Cleveland, OH | 3.0 | 1.0 | 1131 | $1,700 | $1.50 | 15d | 1 | 1.06mi |
| 7903 Ackley Rd Unit 7903 Parma, OH | 3.0 | 1.0 | 1100 | $1,600 | $1.45 | 44d | 1 | 1.12mi |
| 5252 W 45th St Unit 1496134P Parma, OH | 3.0 | 2.0 | 1065 | $5,388 | $5.06 | 15d | 1 | 1.20mi |
| 4407 Woodway Ave Cleveland, OH | 3.0 | 2.0 | 1728 | $1,750 | $1.01 | 24d | 1 | 1.23mi |
| 9474 Roxbury Rd Cleveland, OH | 3.0 | 2.0 | 1050 | $2,000 | $1.90 | 24d | 1 | 1.27mi |
| 9474 Roxbury Rd Cleveland, OH | 3.0 | 2.0 | 1050 | $1,850 | $1.76 | 4d | 1 | 1.27mi |
| 6227 Traymore Ave Cleveland, OH | 3.0 | 2.0 | 1221 | $1,575 | $1.29 | 2d | 1 | 1.43mi |
| 3330 Fortune Ave Cleveland, OH | 3.0 | 1.5 | 1258 | $1,775 | $1.41 | 44d | 1 | 1.49mi |
Listing history 35 events
-
2026-06-13statusdays on market $175,000 Pending 36 DOM
-
2026-06-13days on market $175,000 Active 35 DOM
-
2026-06-09days on market $175,000 Active 32 DOM
-
2026-06-08days on market $175,000 Active 31 DOM
-
2026-06-07days on market $175,000 Active 30 DOM
-
2026-06-05days on market $175,000 Active 27 DOM
-
2026-06-03days on market $175,000 Active 26 DOM
-
2026-06-02days on market $175,000 Active 25 DOM
-
2026-06-01days on market $175,000 Active 24 DOM
-
2026-05-31days on market $175,000 Active 23 DOM
-
2026-05-07$199,990 Active 761-char remark
-
2007-02-20soldstatus $98,000 277-char remark
Show marketing remark (277 chars)
Very Unique Opportunity * * Large Single Family Home In Front W/ A Small Home In The Rear * * Front Home-brick Tudor, Hardwood Floors, Fireplace, Full Finished Bsmt-absolutely Stunning * * Rear Home-1 Bedroom, 1 Bath, 2nd Floor, Full Basement * * Tons Of Possibilities * *
-
2007-02-20soldstatus $98,000
Show marketing remark (277 chars)
Very Unique Opportunity * * Large Single Family Home In Front W/ A Small Home In The Rear * * Front Home-brick Tudor, Hardwood Floors, Fireplace, Full Finished Bsmt-absolutely Stunning * * Rear Home-1 Bedroom, 1 Bath, 2nd Floor, Full Basement * * Tons Of Possibilities * *
-
2006-09-12$99,900 277-char remark
Show marketing remark (277 chars)
Very Unique Opportunity * * Large Single Family Home In Front W/ A Small Home In The Rear * * Front Home-brick Tudor, Hardwood Floors, Fireplace, Full Finished Bsmt-absolutely Stunning * * Rear Home-1 Bedroom, 1 Bath, 2nd Floor, Full Basement * * Tons Of Possibilities * *
-
2006-09-12$99,900
Show marketing remark (277 chars)
Very Unique Opportunity * * Large Single Family Home In Front W/ A Small Home In The Rear * * Front Home-brick Tudor, Hardwood Floors, Fireplace, Full Finished Bsmt-absolutely Stunning * * Rear Home-1 Bedroom, 1 Bath, 2nd Floor, Full Basement * * Tons Of Possibilities * *
-
2006-09-10historical
-
2006-09-10historical
-
2006-08-07$139,900
-
2006-08-07$139,900
-
2006-07-31historical
-
2006-07-31historical
-
2006-04-05$149,900
-
2006-04-05$149,900
-
2005-11-12historical
-
2005-08-12$169,900
-
2005-05-19historical
-
2005-01-19$169,500
-
2003-05-30soldstatus $152,160
-
2003-05-28soldstatus $170,200
-
2003-01-28$158,500
-
2002-10-31historical
-
2002-09-06$178,500
-
1995-07-12soldstatus $107,500
-
1995-06-03historical
-
1995-05-03$127,900
ⓘ Source: listings_history table (triggers on properties + properties_extension) + one-shot
backfill from property_details.listing_events for pre-trigger history.
Tax reassessment forecast OH · Partial reset (capped growth)
- Current annual tax
- $2,631 · $219/mo
- Projected year-2 tax
- $2,681 · $223/mo
- Expected delta
- +$49/yr (+$4/mo · 1.9%)
ⓘ Screening estimate from a state-policy table — verify with the county assessor before closing.
Climate risk First Street
- Flood 1/10 Low FEMA zone X (unshaded) · 0% chance over 30 yrs
- Wildfire 1/10 Low
- Heat 3/10 Moderate 7 d/yr ≥95°F today · 17 d/yr by 30 yrs out
- Wind 1/10 Low
- Air quality 3/10 Moderate 2 unhealthy d/yr today · 4 by 30 yrs out
Nearby sold comps map
Loading sold comps map…
Walkable amenities ~0.75 mi
Loading nearby amenities…
Taxation est. · year 1
- Rental income
- $26,676
- − Mortgage interest
- −$9,803
- − Property taxes
- −$2,631
- − Insurance
- −$875
- − Repairs & maintenance
- −$2,134
- − Management
- −$2,134
- − Depreciation
- −$5,091
- Taxable income
- $4,008
- Est. tax owed @ 24.0%
- −$962
- After-tax cash flow
- $5,593/yr
For passive investors: Depreciation is non-cash, so a rental often shows a tax loss while cash-flowing — sheltering income. Rental losses are passive: they offset passive income freely, and up to $25,000/yr can offset ordinary (W-2) income if you actively participate and your MAGI is under $100k (phasing out to $0 by $150k); unused losses carry forward. On sale, claimed depreciation is recaptured at up to 25%, and gains may owe capital-gains tax (a 1031 exchange can defer both). Figures are a year-1 estimate at your 24.0% rate — not tax advice; consult a CPA.
Schools (NCES district)
- District
- Parma City
- NCES district ID
- 3904463
- Math proficiency
- 43% ▼ -18.00%
- Reading proficiency
- 52% ▼ -10.00%
- Median HH income
- $50,371
- Composite
- 40.72/100
- National rank
- #3662
- State rank
- #469 of 656 in OH
Livability — Parma
- Score
- 82/100
- State rank
- #84
- US rank
- #1232
Category grades
Schools grade is shown separately in the Schools card above.
Census & demographics
- Census place
- Parma, OH
- County
- Cuyahoga County · 1,090,369 people
- City population
- 66,574
- Metro
- Cleveland-Elyria, OH
- Population (ZIP)
- 28,800
- Household income
- $70,651
- Rent vs Own
- Severe rent burden
- 541.0
Population outlook (Cuyahoga County) Hauer SSP2
- Today (2025)
- 1,244,621 people
- By 2030
- 1,230,093 · -1.2%
- By 2040
- 1,189,108 · -4.5%
- By 2050
- 1,145,706 · -7.9%
- By 2075
- 1,076,557 · -13.5%
- By 2100
- 978,987 · -21.3%
Race, ethnicity, and origin ACS 2023
- Neighborhood character
- Predominantly White (76%)
- Race & ethnicity
- White 76% Hispanic / Latino 13% Two or more races 8% Black 7% Asian 2%
- Hispanic origin (detail)
- Puerto Rican 9%
- Common ancestry
- Romanian 12% Subsaharan African 3% Scandinavian 1%
- Foreign-born
- 11% · Canada, India, Vietnam
- Languages at home
- 82% English-only · Spanish 7% Russian/Polish/Slavic 4% Other Indo-European 3%
Political lean MEDSL · Cuyahoga
- 2024 margin
- Solid D (+31.5) · D 65.4% · R 33.9%
- 2008→2024 swing
- -7.4pp toward R · 2008: 38.9pp · 2024: 31.5pp
- All cycles
- 2024: D+31.5 2020: D+34.1 2016: D+35.0 2012: D+38.7 2008: D+38.9
Not yet ingested
- Civics
- —
Market trends
- HPI YoY
- ▼ -143.31%
- Current HPI
- 184.2628
- Rent YoY
- ▲ 4.29%
- Metro
- Cleveland-Elyria, OH
- State GDP YoY
- ▲ 1.98%
- F500 in state
- 48
Industry mix (Fortune 500 HQ in OH)
| Industry | F500 HQs | Revenue |
|---|---|---|
| Insurance | 3 | $145B |
|
||
| Industrial Machinery | 3 | $49B |
|
||
| Financial Services | 3 | $24B |
|
||
| Consumer Goods | 2 | $93B |
|
||
| Aerospace / Defense | 2 | $47B |
|
||
| Utilities | 2 | $33B |
|
||
Price history
+36.8% since first listed27 events — show timeline
- 2026-06-13 Pending — MLSNOW
- 2026-05-21 Price Changed $175,000 MLSNOW
- 2026-05-07 Listed $199,990 MLSNOW
- 2007-02-20 Sold (MLS) $98,000 MLSNOW
- 2007-02-20 Sold (MLS) $98,000 MLSNOW
- 2006-09-12 Listed $99,900 MLSNOW
- 2006-09-12 Listed $99,900 MLSNOW
- 2006-09-10 Listing Removed — MLSNOW
- 2006-09-10 Listing Removed — MLSNOW
- 2006-08-07 Listed $139,900 MLSNOW
- 2006-08-07 Listed $139,900 MLSNOW
- 2006-07-31 Listing Removed — MLSNOW
- 2006-07-31 Listing Removed — MLSNOW
- 2006-04-05 Listed $149,900 MLSNOW
- 2006-04-05 Listed $149,900 MLSNOW
- 2005-11-12 Listing Removed — MLSNOW
- 2005-08-12 Listed $169,900 MLSNOW
- 2005-05-19 Listing Removed — MLSNOW
- 2005-01-19 Listed $169,500 MLSNOW
- 2003-05-30 Sold (MLS) $152,160 MLSNOW
- 2003-05-28 Sold (Public Records) $170,200 Public Records
- 2003-01-28 Listed $158,500 MLSNOW
- 2002-10-31 Listing Removed — MLSNOW
- 2002-09-06 Listed $178,500 MLSNOW
- 1995-07-12 Sold (Public Records) $107,500 Public Records
- 1995-06-03 Listing Removed — MLSNOW
- 1995-05-03 Listed $127,900 MLSNOW
Property tax history
+3.2%/yrLatest (2025): $2,631 · -3.5% YoY. Source: county tax records.
Cash-flow waterfall
monthlySold comps — $/sqft
last 12 mo · ≤1 miLoading sold comps…