25 Central Park W Unit 1F · New York, NY
Flood risk 1/10 · Minimal
- FEMA flood zone
- X (unshaded)
- Chance of flooding over 30 yrs
- 0.0%
- Est. flood insurance / yr
- $507 – $1,088
Fire risk 1/10 · Minimal
- Est. fire insurance / yr
- $691 – $1,283
Heat risk 6/10 · Moderate
- Hot days now (above 99°F)
- 7 days/yr
- Hot days in 30 yrs
- 14 days/yr
Wind risk 6/10 · Moderate
- Chance of severe wind over 30 yrs
- 27.0%
Air-quality risk 4/10 · Minor
- Unhealthy air days now
- 5 days/yr
- Unhealthy air days in 30 yrs
- 6 days/yr
Risk factors via First Street. Map © Google.
Why this score? — see what drove the A- grade
The composite is a weighted blend of 9 inputs, each scored 0–100. Each bar is that input's sub-score; the figure is the points it added to the 100-point composite (weight × sub-score).
- Cash flow +30.0/30.0
- 1% rule +10.0/10.0
- DSCR +10.0/10.0
- ARV discount +7.5/15.0
- Appreciation +7.5/10.0
- Schools +5.0/10.0
- Rent growth +4.0/5.0
- Condition / age +4.0/5.0
- Livability +3.8/5.0
$650,000
🖨 Deal sheet 📄 Offer letter ✓ Due diligence
Listing remarks
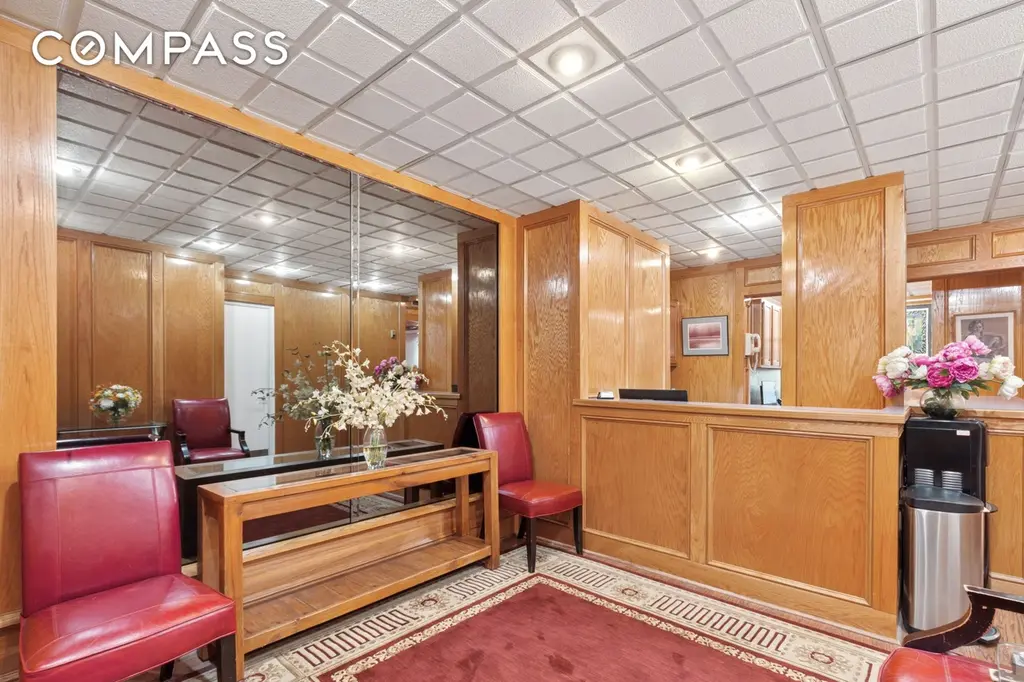
1290 SF Medical Condo Office at 25 CPW, priced to sell at only 650K!!! Beautifully renovated, wood paneled medical office located off the lobby in a prestigious luxury full-service CONDO on 62nd Street and Central Park West! The office features a gracious waiting room and windowed reception area with an adjacent file storage room that could be converted into another room, a spacious, windowed doctor’s office, 2 generously sized exam rooms, a windowed eat-in kitchen which can also be used as an exam room, 2 half bathrooms, numerous closets and a laundry room with shower. The office is in excellent condition, has central air conditioning and windows with serene, pretty views to the g
Key facts
- Half bathrooms
- Exam rooms
- File storage room
Tags
Property features AI
Finance
- Other: Pets allowed in building
- Financial info: Building contains 422 total units
- HOA & community: Monthly association fee of $2,360
Exterior
- Utilities: Has cooling (central air)
- Home design: Condominium (The Century Condominium); 33-story building; Entry on level 1
- Construction: Lot dimensions approximately 200.83 x 250
- Exterior features: Building courtyard; Building garden; Private outdoor space under 60 sqft
Interior
- Bedrooms: 6 total rooms (total rooms listed)
- Bathrooms: 2 half bathrooms
- Heating & cooling: Central air conditioning
- Interior features: Unfurnished
- Laundry & utility: Laundry allowed in-unit; Building washer/dryer installation allowed; Common on-floor laundry; Common area laundry
Neighborhood map
What this means for you Summary
Snapshot
- This is a 4-bed/1.0-bath single-family listed at $650k. Condition is rated good.
Deal economics
- At list price, monthly cash flow is $3k ($33k/yr) — positive.
- The deal already cash-flows at list — no discount required.
- Meets the 1% rule at list price ($12k rent vs $650k).
- Recommended offer: $611k (6.0% below list) — sets the bar for market timing.
- Cap rate 11.4% vs local median 2.6% in New York — top-decile yield for the area; either an underpriced asset or a hidden risk that comps aren't pricing in. Stress-test before assuming the spread holds.
Location & tenants
- Location reads 75/100 on livability (#268 in NY, #4,188 nationally) — a middle-class / working-renter tenant base. Strengths: amenities A+, commute A+, health & safety A; Watch: crime F, cost of living F.
- Market conditions: Rents rising fast (+6.2%/yr); 419 active listings in the ZIP; 28 comparable units currently listed for rent nearby; rentals leasing fast (median 8d on market — plan ~1-2 weeks tenant-placement turnaround); high-income renter base; 4,467 units permitted in New York County in 2024 (4,463 in 5+ unit buildings).
- At $12,152/mo this rent would consume 91% of the median local household income ($160k/yr) (locally 4887% of renters already pay >50% of income on rent) — very limited rent-growth headroom before tenants either downsize or default.
Forward outlook
- In year one you build about $37k of equity ($4k loan paydown + $33k appreciation (5.1% local appreciation)).
- New York County population projected at +21% by 2050 — long-run rental-demand tailwind backs the buy-and-hold thesis.
- At projected returns (5.1% appreciation + 6.2% rent growth), your $182k cash investment doubles in ~3 years — after that, you're playing with house money.
- By year 2, paydown + projected appreciation supports a ~$60k cash-out refi (75% LTV) — recoverable capital for the next deal without selling this one.
Negotiation context
- It's been on market 63 days — a 6% lower offer ($611k) is reasonable based on typical stale-listing flexibility.
Risks & watch-outs
- Watch-outs: built in 1932 — expect roof / HVAC / electrical / plumbing capex.
- Climate carrying-cost: major wind risk, 27% chance of damaging wind over 30y; extreme-heat days projected 7→14/yr by 2055 (HVAC capex compounding) — expect insurance premiums to compound above CPI over the hold.
Questions for the listing agent
- It's been on market 63 days. Have you received any prior offers? Is the seller open to a 6% concession, seller financing, or rate buy-down credit?
- Built in 1932 — when were the roof, HVAC, electrical panel, plumbing, and water heater last replaced?
- What does the HOA fee cover, when was the last increase, and are there any pending special assessments or reserve-fund shortfalls?
- Why hasn't it sold? Are there any deal-killer items the seller is aware of (foundation, flood, title, zoning, code violations)?
- Is there a deadline driving the sale (1031 exchange, divorce, estate, relocation)? That informs how much negotiation room exists.
- Schools are B-rated — typically a magnet for longer-tenancy family renters. What's the average tenant stay here, and is there a school-zone premium baked into asking?
- Crime grade is F in this area — have there been break-ins, vandalism, or insurance claims at this property in the last 3 years? What carrier currently insures it and at what premium?
- What's the average days-on-market for RENTAL listings here right now (not sales)? A rising rental-DOM trend means longer vacancies and softer asking-rent achievability than the comps imply.
- What's the recent tenant-quality profile in this submarket — average credit score on applications, eviction rate, late-payment / NSF rate, and stable-employment percentage? A property-management company in the area should have these aggregated.
- How much new for-sale + rental construction is in the pipeline within 1–3 miles? Heavy new supply typically softens prices + rents 12–24 months out; constrained supply supports both.
Investment metrics
- 1% rule
- 1.87% ✓
- Cap rate
- 11.37%
- Cash-on-cash
- 18.12%
- DSCR
- 1.81
- GRM
- 4.5
CMA / ARV
No comps found within radius.
Projected returns pro-forma
5.06% appreciation · 6.16% rent growth · sell at horizon
- IRR
- 31.5%
- Equity multiple
- 3.03×
- Total profit
- $368,710
- Equity at exit
- $370,882
- IRR
- 32.1%
- Equity multiple
- 6.79×
- Total profit
- $1,054,194
- Equity at exit
- $642,198
Cash invested: $182,000 (down + closing). Projections, not guarantees.
Landlord ↔ Tenant lean methodology
- Overall (CITY)
- 0 Strongly Tenant-Friendly
- State New York
- 15 Strongly Tenant-Friendly · D+10
- County
- — inherits STATE
- City New York
- 0 Strongly Tenant-Friendly · D+34
ZIP-level market 10023
- Home prices YoY
- 2.1%
- Rents YoY
- 6.2%
- Active inventory
- 419
- Price-to-rent
- 4.5×
Monthly cashflow live
- Estimated rent
- $12,152 high interval (Pro) →
- Mortgage (P&I)
- −$3,409
- Tax est. 1.5%
- −$812 /mo · $9,750/yr
- Insurance
- −$271
- HOA
- −$2,360
- Vacancy / Maint / Mgmt
- −$2,552
- Net cashflow
- $2,748
Break-even live
UW: 25.0% down · 7.5% · 30yr · 1.5% tax · 5.0% vac · 8.0% maint · 8.0% mgmt
Financing live
Cash to close
- Down payment
- $162,500
- Closing costs
- $19,500
- Reserves months
- —
- Total cash needed
- —
Loan-product check · same deal, 3 products live
Conventional
25% down · 7.5% · 30yr
- Down + closing
- —
- Monthly P&I
- —
- Monthly cashflow
- —
- DSCR
- —
- Eligible?
- —
Personal DTI + credit; lowest rate.
DSCR
20% down · 8.5% · 30yr
- Down + closing
- —
- Monthly P&I
- —
- Monthly cashflow
- —
- DSCR
- —
- Eligible?
- —
No personal income docs; deal must DSCR.
Hard money
10% down · 12.0% · 12mo
- Down + closing
- —
- Monthly P&I
- —
- Monthly cashflow
- —
- DSCR
- —
- Eligible?
- —
Short-term bridge; refi at stabilization.
Rent comps 28 comps
| Address | Beds | Baths | Sqft | Rent | $/sqft | DOM | Units | Dist |
|---|---|---|---|---|---|---|---|---|
| 160 Central Park S New York, NY | 1.0–3.0 | 1.0–3.5 | 1550 | $50,000 | $32.26 | 7d | 9 | 0.35mi |
| 160 Central Park S New York, NY | 1.0–3.0 | 1.5–3.5 | 1578 | $50,000 | $31.68 | 2d | 9 | 0.35mi |
| 160 Central Park S New York, NY | 1.0–3.0 | 1.0–3.5 | 1550 | $50,000 | $32.26 | 7d | 10 | 0.35mi |
| 155 W 70th St New York, NY | 2.0–3.0 | 2.0–2.5 | 1300 | $13,750 | $10.58 | 20d | 3 | 0.43mi |
| 155 W 70th St New York, NY | 2.0–3.0 | 2.0–2.5 | 1112 | $14,995 | $13.48 | 22d | 4 | 0.43mi |
| 400 W 61st St New York, NY | 4.0 | 1.0–4.0 | 1567 | $43,500 | $27.76 | 1d | 48 | 0.57mi |
| 550 W 54th St Unit 1243 New York, NY | 1.0–3.0 | 1.0–2.0 | 913 | $8,170 | $8.94 | 7d | 3 | 0.61mi |
| 20 Riverside Blvd Unit 20P New York, NY | 3.0 | 3.5 | 1735 | $19,000 | $10.95 | 22d | 1 | 0.61mi |
| 15 W 55th St #736 New York, NY | 2.0–3.0 | 1.0–2.0 | 1250 | $8,630 | $6.90 | 1d | 2 | 0.66mi |
| 2150 Broadway Unit 10E New York, NY | 3.0 | 3.0 | 1727 | $16,000 | $9.26 | 19d | 1 | 0.72mi |
| 50 E 72nd St Unit 10B New York, NY | 3.0 | 3.0 | 1645 | $17,500 | $10.64 | 19d | 1 | 0.86mi |
| 50 E 72nd St New York, NY | 2.0–3.0 | 3.0 | 1647 | $17,500 | $10.62 | 7d | 2 | 0.86mi |
| 150 E 57th St New York, NY | 5.0 | 1.0–7.5 | 2750 | $26,206 | $9.53 | 1d | 5 | 0.98mi |
| 207 E 57th St Unit 16A New York, NY | 3.0 | 3.0 | 1551 | $13,750 | $8.87 | 24d | 1 | 1.04mi |
| 560 W 43rd St New York, NY | 3.0 | 1.0–2.0 | 769 | $8,222 | $10.68 | 7d | 5 | 1.11mi |
| 14 W 86th St New York, NY | 3.0 | 3.0 | 1580 | $13,500 | $8.54 | 15d | 1 | 1.14mi |
| 160 E 48th St New York, NY | 3.0 | 1.0–2.0 | 878 | $10,150 | $11.55 | 3d | 9 | 1.22mi |
| 1435 2nd Ave Unit 1021957P New York, NY | 3.0 | 2.0 | 1194 | $7,740 | $6.48 | 12d | 1 | 1.24mi |
| 360 E 65th St #1283 New York, NY | 1.0–3.0 | 1.0–2.0 | 1059 | $8,790 | $8.30 | 3d | 3 | 1.24mi |
| 401 E 60th St Unit 37B New York, NY | 3.0 | 3.0 | 1560 | $10,000 | $6.41 | 11d | 1 | 1.28mi |
| 323 E 51st St Unit 1024750P New York, NY | 2.0–4.0 | 2.0–3.5 | 2093 | $34,650 | $16.56 | 7d | 2 | 1.31mi |
| 403 E 69th St #1518 New York, NY | 1.0–3.0 | 1.0 | 745 | $9,507 | $12.76 | 24d | 3 | 1.32mi |
| 400 E 54th St Unit 409 New York, NY | 4.0 | 2.0 | 1130 | $9,695 | $8.58 | 22d | 1 | 1.36mi |
| 420 E 54th St New York, NY | 3.0 | 1.0–2.5 | 1104 | $13,336 | $12.07 | 1d | 14 | 1.40mi |
| 300-302 E 46th St Unit 12J New York, NY | 3.0 | 1.0 | 900 | $8,000 | $8.89 | 5d | 1 | 1.42mi |
| 300 E 46th St New York, NY | 2.0–3.0 | 1.0 | 716 | $7,510 | $10.48 | 24d | 2 | 1.42mi |
| 4 Ave at Port Imperial West New York, NJ | 1.0–3.0 | 1.0–2.0 | 1110 | $5,571 | $5.02 | 2d | 16 | 1.45mi |
| 11 Ave At Port Imperial West New York, NJ | 3.0 | 1.0–2.0 | 1047 | $6,634 | $6.33 | 1d | 12 | 1.50mi |
HOA detail
- Monthly dues
- $2,360 · $28,320/yr
Listing history 14 events
-
2026-06-18days on market $650,000 Active 63 DOM
-
2026-06-17days on market $650,000 Active 62 DOM
-
2026-06-15days on market $650,000 Active 60 DOM
-
2026-06-13days on market $650,000 Active 58 DOM
-
2026-06-10days on market $650,000 Active 54 DOM
-
2026-06-08days on market $650,000 Active 53 DOM
-
2026-06-08days on market $650,000 Active 52 DOM
-
2026-06-04days on market $650,000 Active 49 DOM
-
2026-06-03days on market $650,000 Active 48 DOM
-
2026-06-01days on market $650,000 Active 47 DOM
-
2026-05-31days on market $650,000 Active 46 DOM
-
2026-04-15$699,000 Active
-
2026-02-11price $699,000
-
2026-01-07price $895,000
ⓘ Source: listings_history table (triggers on properties + properties_extension) + one-shot
backfill from property_details.listing_events for pre-trigger history.
Climate risk First Street
- Flood 1/10 Low FEMA zone X (unshaded) · 0% chance over 30 yrs
- Wildfire 1/10 Low
- Heat 6/10 Major 7 d/yr ≥99°F today · 14 d/yr by 30 yrs out
- Wind 6/10 Major 27% chance of damaging wind over 30 yrs
- Air quality 4/10 Moderate 5 unhealthy d/yr today · 6 by 30 yrs out
Nearby sold comps map
Loading sold comps map…
Walkable amenities ~0.75 mi
Loading nearby amenities…
Taxation est. · year 1
- Rental income
- $145,822
- − Mortgage interest
- −$36,410
- − Property taxes
- −$9,750
- − Insurance
- −$3,250
- − Repairs & maintenance
- −$11,666
- − Management
- −$11,666
- − HOA
- −$28,320
- − Depreciation
- −$18,909
- Taxable income
- $25,851
- Est. tax owed @ 24.0%
- −$6,204
- After-tax cash flow
- $26,771/yr
For passive investors: Depreciation is non-cash, so a rental often shows a tax loss while cash-flowing — sheltering income. Rental losses are passive: they offset passive income freely, and up to $25,000/yr can offset ordinary (W-2) income if you actively participate and your MAGI is under $100k (phasing out to $0 by $150k); unused losses carry forward. On sale, claimed depreciation is recaptured at up to 25%, and gains may owe capital-gains tax (a 1031 exchange can defer both). Figures are a year-1 estimate at your 24.0% rate — not tax advice; consult a CPA.
Condition & rehab AI · 1 photo
This medical office is in good condition with cosmetic updates needed to enhance its resale and rental value. The interior is clean and functional, with potential for a fresh paint job and new flooring to improve the overall appearance.
Value-add opportunities
- Both Update the flooring in the waiting room and reception area. — New flooring can enhance the overall appearance and feel of the space.
- Both Paint the walls and ceiling to refresh the interior. — Fresh paint can make the space feel more inviting and modern.
- Both Install new window treatments. — New window treatments can improve the aesthetic appeal and energy efficiency of the windows.
- Resale Upgrade the kitchen appliances. — Modern appliances can attract more buyers and renters.
- Both Install a new HVAC system. — A new HVAC system can improve comfort and energy efficiency, making the space more attractive to buyers and renters.
- Both Improve the landscaping and curb appeal. — A well-maintained exterior can enhance the overall appeal and marketability of the property.
Renovation cost estimate screening
Value-add ROI direction
- Both Update the flooring in the waiting room and reception area. — New flooring can enhance the overall appearance and feel of the space. ↑
- Both Paint the walls and ceiling to refresh the interior. — Fresh paint can make the space feel more inviting and modern. ↑
- Both Install new window treatments. — New window treatments can improve the aesthetic appeal and energy efficiency of the windows. ↑
- Resale Upgrade the kitchen appliances. — Modern appliances can attract more buyers and renters. ↑
- Both Install a new HVAC system. — A new HVAC system can improve comfort and energy efficiency, making the space more attractive to buyers and renters. ↑
- Both Improve the landscaping and curb appeal. — A well-maintained exterior can enhance the overall appeal and marketability of the property. ↑
ⓘ Cost ranges are severity-bucket heuristics (US national rule-of-thumb). Get contractor quotes + a written scope before underwriting a rehab budget.
Schools (NCES district)
No district data.
Livability — New York
- Score
- 75/100
- State rank
- #268
- US rank
- #4188
Category grades
Schools grade is shown separately in the Schools card above.
Census & demographics
- Census place
- New York, NY
- County
- New York County · 1,599,927 people
- City population
- 7,731,280
- Metro
- New York-Newark-Jersey City, NY-NJ-PA
- Population (ZIP)
- 69,455
- Household income
- $159,874
- Rent vs Own
- Severe rent burden
- 4887.0
Population outlook (New York County) Hauer SSP2
- Today (2025)
- 1,825,725 people
- By 2030
- 1,904,611 · +4.3%
- By 2040
- 2,052,719 · +12.4%
- By 2050
- 2,206,601 · +20.9%
- By 2075
- 2,509,427 · +37.4%
- By 2100
- 2,702,933 · +48.0%
Race, ethnicity, and origin ACS 2023
- Neighborhood character
- Predominantly White (65%)
- Race & ethnicity
- White 65% Asian 16% Hispanic / Latino 10% Two or more races 7% Black 4%
- Hispanic origin (detail)
- Puerto Rican 2% Dominican 2%
- Common ancestry
- Scotch-Irish 6% Romanian 5% Italian 2%
- Foreign-born
- 27% · Canada, China, South Korea
- Languages at home
- 70% English-only · Spanish 7% Other Indo-European 5% Chinese 5%
Political lean MEDSL · New York
- 2024 margin
- Solid D (+64.8) · D 82.4% · R 17.6%
- 2008→2024 swing
- -7.4pp toward R · 2008: 72.2pp · 2024: 64.8pp
- All cycles
- 2024: D+64.8 2020: D+74.5 2016: D+77.2 2012: D+69.6 2008: D+72.2
Not yet ingested
- Civics
- —
Market trends
- HPI YoY
- ▲ 5.06%
- Current HPI
- 246.4186
- Rent YoY
- ▲ 6.16%
- Metro
- New York-Newark-Jersey City, NY-NJ-PA
- State GDP YoY
- ▲ 2.60%
- F500 in state
- 92
Industry mix (Fortune 500 HQ in NY)
| Industry | F500 HQs | Revenue |
|---|---|---|
| Financial Services | 10 | $950B |
|
||
| Consumer Goods | 9 | $162B |
|
||
| Insurance | 4 | $225B |
|
||
| Telecommunications | 2 | $144B |
|
||
| Pharmaceuticals | 2 | $112B |
|
||
| Media / Entertainment | 2 | $69B |
|
||
Price history
-21.9% since first listed3 events — show timeline
- 2026-04-15 Listed $699,000 RLS at REBNY
- 2026-02-11 Price Changed $699,000 RLS at REBNY
- 2026-01-07 Price Changed $895,000 RLS at REBNY
Cash-flow waterfall
monthlySold comps — $/sqft
last 12 mo · ≤1 miLoading sold comps…