 Duplex
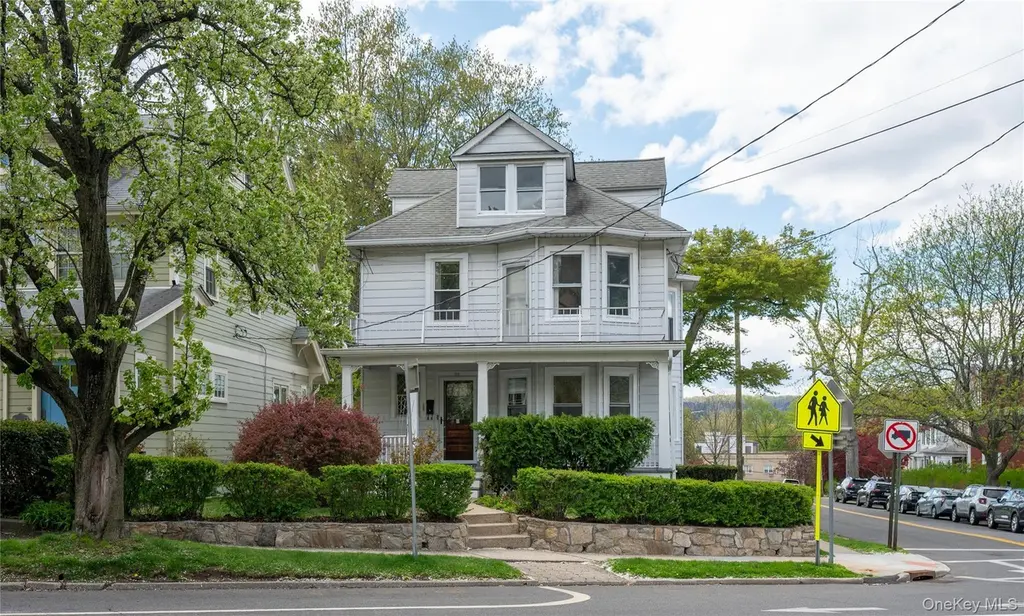
58 Farragut Ave · Hastings-on-Hudson, NY
Flood risk 1/10 · Minimal
- FEMA flood zone
- X (unshaded)
- Chance of flooding over 30 yrs
- 0.0%
- Est. flood insurance / yr
- $473 – $860
Fire risk 1/10 · Minimal
- Est. fire insurance / yr
- $691 – $1,283
Heat risk 6/10 · Moderate
- Hot days now (above 99°F)
- 7 days/yr
- Hot days in 30 yrs
- 15 days/yr
Wind risk 6/10 · Moderate
- Chance of severe wind over 30 yrs
- 27.0%
Air-quality risk 4/10 · Minor
- Unhealthy air days now
- 4 days/yr
- Unhealthy air days in 30 yrs
- 6 days/yr
Risk factors via First Street. Map © Google.
Why this score? — see what drove the D grade
The composite is a weighted blend of 9 inputs, each scored 0–100. Each bar is that input's sub-score; the figure is the points it added to the 100-point composite (weight × sub-score).
- ARV discount +15.0/15.0
- Cash flow +8.0/30.0
- Schools +7.8/10.0
- 1% rule +3.3/10.0
- Rent growth +2.5/5.0
- Livability +2.5/5.0
- Condition / age +2.5/5.0
- DSCR +2.0/10.0
- Appreciation +0.0/10.0
$1,099,900
🖨 Deal sheet (PDF) 📄 Offer letter ✓ Due diligence
Multi-family units
County records classify this as Multi-Family (2-4 Unit). Listing-text estimate: 2 units. confirmed
Listing remarks
Welcome to 58 Farragut Avenue, a charming circa 1922 two-family home nestled in the heart of Hastings-on Hudson. Rich in character and timeless appeal, this property blends early 20th-century craftmanship with updated flexibility-ideal for owner-occupants, investors, or multi-family living. Each unit features a spacious and well-proportioned layout with sunlit living areas, original hardwood floors, and classic architectural details. Period touches such as moldings and beamed ceilings add warmth and personality throughout, while large windows invite natural light. The first floor offers 2 bedrooms, an updated kitchen and bathroom, a beautiful front porch and convenient access to the fenced
Key facts
- 4,792 sq ft lot
- Garage
- Built 1922
Property features AI
Exterior
- Parking: Garage (1 garage space); Total parking for 3 vehicles
- Utilities: Electric service provided by Con-Edison; Public sewer; Sewer and water connected
- Home design: Duplex
- Construction: Clapboard siding; Concrete perimeter foundation
- Exterior features: Balcony; Back yard with wood fencing (fenced)
Interior
- Bedrooms: Three 4-bedroom units
- Flooring: Carpet; Ceramic tile; Hardwood; Laminate; Tile; Wood
- Bathrooms: Three full bathrooms
- Heating & cooling: Oil heating; No central cooling
- Interior features: First-floor bedroom and a first-floor full bathroom; Bay and casement windows; Covered patio/porch; Finished walk-out basement (common area)
- Laundry & utility: Laundry in basement
Neighborhood map
What this means for you Summary
Snapshot
- This is a 2 × 2-bed/1.5-bath units multifamily listed at $1.10M.
Deal economics
- At list price, monthly cash flow is $-1k ($-14k/yr) — negative. Per door: $-570/mo.
- To cash-flow at today's rent, offer at most $899k (18.3% below list).
- To meet the 1% rule (rent ≥ 1% of price), the offer needs to be $909k (17.3% below list).
- Recommended offer: $899k (18.3% below list) — sets the bar for cash-flow.
- Cap rate 5.0% vs local median 2.3% in Hastings-on-Hudson — top-decile yield for the area; either an underpriced asset or a hidden risk that comps aren't pricing in. Stress-test before assuming the spread holds.
Location & tenants
- Location reads: area grade D — affects rentability + tenant quality, not the cash-flow math above.
- Hastings-On-Hudson Union Free School District (suburban): math 79% / reading 88% proficiency, ranked #27 of 590 in NY (top 5%) — strong family-tenant draw, lease renewals of 3-5y typical; only 3% free/reduced lunch — higher-income household profile.
- Zoned schools: Hillside Elementary School (math 89% / reading 87%, grade A+, #64 of 2,108 statewide, top 3%, 564 students, 0% FRL); Farragut Middle School (math 67% / reading 84%, grade A, #51 of 729 statewide, top 7%, 527 students, 0% FRL); Hastings High School (math 98% / reading 98%, grade A+, #19 of 1,100 statewide, top 4%, 519 students, 0% FRL) — zoned schools at 0% FRL track the district average.
- Market conditions: 47 active listings in the ZIP; 12 comparable units currently listed for rent nearby; rentals leasing fast (median 13d on market — plan ~1-2 weeks tenant-placement turnaround); 954 units permitted in Westchester County in 2024 (649 in 5+ unit buildings).
Forward outlook
- Local home prices are declining (-3.0%/yr); year-one equity from $8k of loan paydown is wiped out by about $33k of value loss. Plan a longer hold.
- Westchester County population projected at +10% by 2050 — modest demand growth; plan on rents tracking national, not racing it.
Negotiation context
- It's been on market 25 days — a 2% lower offer ($1.08M) is reasonable based on typical stale-listing flexibility.
- 3 sale attempts since 29y ago with the ask held roughly flat each time — persistent listings suggest the price (not the market) is what's stuck; bring a comps-based counter.
- Current owner paid $335k; list at $1.10M implies a 228% gain — meaningful room to come down on a strong offer.
Risks & watch-outs
- Watch-outs: built in 1922 — expect roof / HVAC / electrical / plumbing capex.
- Climate carrying-cost: major wind risk, 27% chance of damaging wind over 30y; extreme-heat days projected 7→15/yr by 2055 (HVAC capex compounding) — expect insurance premiums to compound above CPI over the hold.
Questions for the listing agent
- What do current leases actually rent for vs. the listed asking? Can we see a recent rent roll and the last 12 months of T-12 income?
- Can we see the unit-by-unit rent roll, current vacancy, and any below-market leases? What's the average tenancy length?
- What capital expenditures (roof, boiler, parking lot, exteriors) have been made in the last 5 years, and what's planned in the next 2?
- Built in 1922 — when were the roof, HVAC, electrical panel, plumbing, and water heater last replaced?
- Is there a deadline driving the sale (1031 exchange, divorce, estate, relocation)? That informs how much negotiation room exists.
- The area grade is low — what's the realistic commute time and amenity access for the typical tenant pool here? Any planned neighborhood developments (good or bad) we should know about?
- What's the average days-on-market for RENTAL listings here right now (not sales)? A rising rental-DOM trend means longer vacancies and softer asking-rent achievability than the comps imply.
- What's the recent tenant-quality profile in this submarket — average credit score on applications, eviction rate, late-payment / NSF rate, and stable-employment percentage? A property-management company in the area should have these aggregated.
- How much new apartment / multifamily construction is in the pipeline within 1–3 miles? Heavy new supply (>2% of stock underway) typically softens rents 12–24 months out; light construction supports rent growth.
Investment metrics
- 1% rule
- 0.83% ✗
- Cap rate
- 5.05%
- Cash-on-cash
- -4.44%
- DSCR
- 0.80
- GRM
- 10.1
CMA / ARV
- ARV (median comp)
- $1,584,133
- List price
- $1,099,900
- Delta
- -30.57%
- Verdict
- UNDERPRICED
- Comps
- 20 within 1.0 mi
Show comp detail 7 sales within ~0.75 mi
| Address | Dist | Beds/Ba | Sqft | Sold | Price | $/sf | Match |
|---|---|---|---|---|---|---|---|
| 2 Marble Ter | 0.39mi | 5/3.0 (+1) | 3,000 | 6mo | $735,000 | $245 | 59 |
| 46 Rose St | 0.61mi | 4/2.0 | 1,930 | 0mo | $923,500 | $478 | 55 |
| 90 Rose St | 0.52mi | 4/2.0 | 2,460 | 8mo | $800,000 | $325 | 53 |
| 93 Washington Ave | 0.19mi | 5/3.5 (+1) | 2,800 | 23mo | $1,270,000 | $454 | 52 |
| 29 Brandt St | 0.60mi | 5/3.0 (+1) | 1,888 | 6mo | $629,000 | $333 | 50 |
| 2 Fulton St | 0.67mi | 4/3.0 | 1,900 | 23mo | $904,500 | $476 | 37 |
| 20 Rose St | 0.67mi | 5/2.0 (+1) | 2,187 | 22mo | $825,000 | $377 | 29 |
Match score weights: distance 35% · size 25% · config 20% · recency 20%. Top-matched comps best support the ARV.
Projected returns pro-forma
-3.0% appreciation · 3.0% rent growth · sell at horizon
- IRR
- -23.7%
- Equity multiple
- 0.19×
- Total profit
- $-250,230
- Equity at exit
- $163,999
- IRR
- -18.5%
- Equity multiple
- -0.00×
- Total profit
- $-308,994
- Equity at exit
- $95,099
Cash invested: $307,972 (down + closing). Projections, not guarantees.
Landlord ↔ Tenant lean methodology
- Overall (STATE)
- 15 Strongly Tenant-Friendly
- State New York
- 15 Strongly Tenant-Friendly · D+10
- County
- — inherits STATE
- City
- — inherits STATE
ZIP-level market 10706
- Active inventory
- 47
- Price-to-rent
- 20.2×
Monthly cashflow live
- Estimated rent
- $9,093 high interval (Pro) →
- Mortgage (P&I)
- −$5,768
- Tax from tax record
- −$2,097 /mo · $25,161/yr
- Insurance
- −$458
- HOA
- −$0
- Vacancy / Maint / Mgmt
- −$1,910
- Net cashflow
- $-1,140
Break-even live
Sensitivity live
| Price | -10% $-517 | -5% $-828 | +0% $-1,140 | +5% $-1,451 | +10% $-1,762 |
|---|---|---|---|---|---|
| Rent | -10% $-1,858 | -5% $-1,499 | +0% $-1,140 | +5% $-780 | +10% $-421 |
| Rate | -1.0pp $-586 | -0.5pp $-860 | base $-1,140 | +0.5pp $-1,425 | +1.0pp $-1,715 |
2-unit breakdown (identical units grouped — click to expand)
| Units | Beds | Baths | Est. rent |
|---|---|---|---|
| 2× units | 2 | 1.5 | $9,094 |
| #1 | 2 | 1.5 | $4,547 |
| #2 | 2 | 1.5 | $4,547 |
| Total (2 units) | $9,093 | ||
UW: 25.0% down · 7.5% · 30yr · 1.5% tax · 5.0% vac · 8.0% maint · 8.0% mgmt
Financing live
Cash to close
- Down payment
- $274,975
- Closing costs
- $32,997
- Reserves months
- —
- Total cash needed
- —
Loan-product check · same deal, 3 products live
Conventional
25% down · 7.5% · 30yr
- Down + closing
- —
- Monthly P&I
- —
- Monthly cashflow
- —
- DSCR
- —
- Eligible?
- —
Personal DTI + credit; lowest rate.
DSCR
20% down · 8.5% · 30yr
- Down + closing
- —
- Monthly P&I
- —
- Monthly cashflow
- —
- DSCR
- —
- Eligible?
- —
No personal income docs; deal must DSCR.
Hard money
10% down · 12.0% · 12mo
- Down + closing
- —
- Monthly P&I
- —
- Monthly cashflow
- —
- DSCR
- —
- Eligible?
- —
Short-term bridge; refi at stabilization.
Rent comps 12 comps
| Address | Beds | Baths | Sqft | Rent | $/sqft | DOM | Units | Dist |
|---|---|---|---|---|---|---|---|---|
| 493 Warburton Ave Hastings on Hudson, NY | 4.0 | 3.5 | 2723 | $9,995 | $3.67 | 18d | 1 | 0.37mi |
| 493 Warburton Ave Hastings on Hudson, NY | 4.0 | 5.0 | 2723 | $9,995 | $3.67 | 15d | 1 | 0.37mi |
| 4 Edmarth Pl Hastings on Hudson, NY | 3.0 | 1.5 | — | $5,300 | — | 0d | 1 | 0.51mi |
| 53 Prince St Hastings on Hudson, NY | 3.0 | 2.0 | 1473 | $4,500 | $3.05 | 6d | 1 | 0.58mi |
| 53 Prince St Hastings on Hudson, NY | 3.0 | 2.0 | 1950 | $4,500 | $2.31 | 45d | 1 | 0.58mi |
| 42 Clarewood Dr Hastings on Hudson, NY | 3.0 | 3.5 | 2800 | $8,000 | $2.86 | 12d | 1 | 1.17mi |
| 42 Clarewood Dr Hastings on Hudson, NY | 3.0 | 3.5 | 2800 | $7,800 | $2.79 | 0d | 1 | 1.17mi |
| 29 Ridge Rd Dobbs Ferry, NY | 3.0 | 2.0 | 1400 | $4,750 | $3.39 | 23d | 1 | 1.30mi |
| 29 Ridge Rd Dobbs Ferry, NY | 3.0 | 2.0 | 1400 | $5,500 | $3.93 | 12d | 1 | 1.30mi |
| 5 Ridge Rd Unit 2 Dobbs Ferry, NY | 3.0 | 1.5 | 1419 | $4,300 | $3.03 | 45d | 1 | 1.35mi |
| 104 Ogden Ave Dobbs Ferry, NY | 3.0 | 2.5 | 2018 | $6,000 | $2.97 | 0d | 1 | 1.39mi |
| 43 Main St Unit 2 Dobbs Ferry, NY | 3.0 | 1.0 | 1050 | $4,000 | $3.81 | 9d | 1 | 1.40mi |
Listing history 7 events
-
2026-05-02$1,099,900 Active 1640-char remark
-
2026-05-01historical $1,099,900 1640-char remark
-
2017-11-02historical
-
2017-08-31$790,000 Active
-
2000-03-31soldstatus $335,000
-
1997-03-06
-
1986-07-01soldstatus $215,000
ⓘ Source: listings_history table (triggers on properties + properties_extension) + one-shot
backfill from property_details.listing_events for pre-trigger history.
Tax reassessment forecast NY · Partial reset (capped growth)
- Current annual tax
- $25,161 · $2,097/mo
- Projected year-2 tax
- $25,161 · $2,097/mo
- Expected delta
- $0/yr ($0/mo · 0.0%)
ⓘ Screening estimate from a state-policy table — verify with the county assessor before closing.
Climate risk First Street
- Flood 1/10 Low FEMA zone X (unshaded) · 0% chance over 30 yrs
- Wildfire 1/10 Low
- Heat 6/10 Major 7 d/yr ≥99°F today · 15 d/yr by 30 yrs out
- Wind 6/10 Major 27% chance of damaging wind over 30 yrs
- Air quality 4/10 Moderate 4 unhealthy d/yr today · 6 by 30 yrs out
Nearby sold comps map
Loading sold comps map…
Walkable amenities ~0.75 mi
Loading nearby amenities…
Taxation est. · year 1
- Rental income
- $109,116
- − Mortgage interest
- −$61,612
- − Property taxes
- −$25,161
- − Insurance
- −$5,500
- − Repairs & maintenance
- −$8,729
- − Management
- −$8,729
- − Depreciation
- −$31,997
- Taxable loss
- −$32,612
- Est. tax savings @ 24.0%
- +$7,827
- After-tax cash flow
- $-5,848/yr
For passive investors: Depreciation is non-cash, so a rental often shows a tax loss while cash-flowing — sheltering income. Rental losses are passive: they offset passive income freely, and up to $25,000/yr can offset ordinary (W-2) income if you actively participate and your MAGI is under $100k (phasing out to $0 by $150k); unused losses carry forward. On sale, claimed depreciation is recaptured at up to 25%, and gains may owe capital-gains tax (a 1031 exchange can defer both). Figures are a year-1 estimate at your 24.0% rate — not tax advice; consult a CPA.
Schools (NCES district)
- District
- Hastings-On-Hudson Union Free School District
- NCES district ID
- 3613950
- Math proficiency
- 79% ▲ 2.00%
- Reading proficiency
- 88% ▲ 11.00%
- Median HH income
- $122,901
- Composite
- 77.5/100
- National rank
- #94
- State rank
- #27 of 590 in NY
Livability — Hastings-on-Hudson
No livability data for this city. (Only ~50 U.S. cities are tracked.)
Census & demographics
- Census place
- Hastings-on-Hudson, NY
- City population
- 9,119
- Population (ZIP)
- 9,119
Population outlook (Westchester County) Hauer SSP2
- Today (2025)
- 1,028,035 people
- By 2030
- 1,051,636 · +2.3%
- By 2040
- 1,098,520 · +6.9%
- By 2050
- 1,136,044 · +10.5%
- By 2075
- 1,196,925 · +16.4%
- By 2100
- 1,175,147 · +14.3%
Race, ethnicity, and origin ACS 2023
- Neighborhood character
- Predominantly White (80%)
- Race & ethnicity
- White 80% Hispanic / Latino 8% Two or more races 7% Asian 5% Black 2%
- Hispanic origin (detail)
- Mexican 2% Puerto Rican 2% Dominican 1%
- Common ancestry
- Scotch-Irish 4% Romanian 4% Subsaharan African 2%
- Foreign-born
- 14% · Canada, Vietnam, Dominican Republic
- Languages at home
- 84% English-only · Other Indo-European 4% Spanish 4% Russian/Polish/Slavic 2%
Political lean MEDSL · Westchester
- 2024 margin
- Strong D (+26.3) · D 63.1% · R 36.9%
- 2008→2024 swing
- -1.3pp toward R · 2008: 27.6pp · 2024: 26.3pp
- All cycles
- 2024: D+26.3 2020: D+36.3 2016: D+32.8 2012: D+22.2 2008: D+27.6
Not yet ingested
- Civics
- —
Market trends
- HPI YoY
- ▼ -808.24%
- Current HPI
- 319.1863
- Rent YoY
- —
- Metro
- —
- State GDP YoY
- ▲ 2.60%
- F500 in state
- 92
Industry mix (Fortune 500 HQ in NY)
| Industry | F500 HQs | Revenue |
|---|---|---|
| Financial Services | 10 | $950B |
|
||
| Consumer Goods | 9 | $162B |
|
||
| Insurance | 4 | $225B |
|
||
| Telecommunications | 2 | $144B |
|
||
| Pharmaceuticals | 2 | $112B |
|
||
| Media / Entertainment | 2 | $69B |
|
||
Price history
+411.6% since first listed8 events — show timeline
- 2026-05-26 Pending — OneKey® MLS as Distributed by MLS Grid
- 2026-05-02 Listed $1,099,900 OneKey® MLS as Distributed by MLS Grid
- 2026-05-01 Coming Soon $1,099,900 OneKey® MLS as Distributed by MLS Grid
- 2017-11-02 Listing Removed — OneKey® MLS as Distributed by MLS Grid
- 2017-08-31 Listed $790,000 OneKey® MLS as Distributed by MLS Grid
- 2000-03-31 Sold (Public Records) $335,000 Public Records
- 1997-03-06 Listed — HGMLS
- 1986-07-01 Sold (Public Records) $215,000 Public Records
Property tax history
+6.2%/yrLatest (2025): $25,161 · +16.1% YoY. Source: county tax records.
Cash-flow waterfall
monthlySold comps — $/sqft
last 12 mo · ≤1 miLoading sold comps…