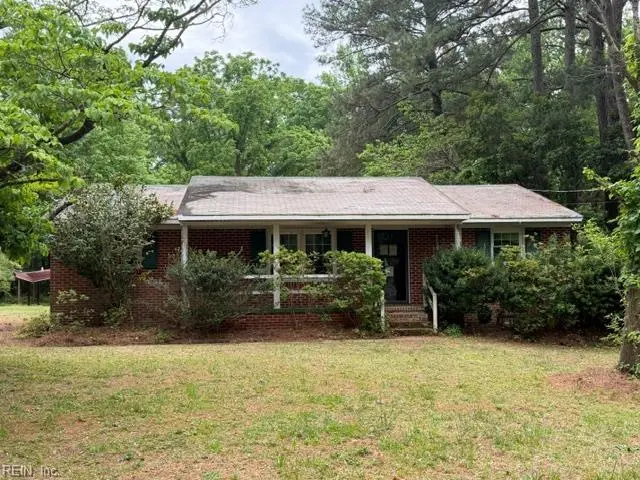
29186 Hunt Club Dr · Franklin, VA
Flood risk 1/10 · Minimal
- FEMA flood zone
- AE
- Chance of flooding over 30 yrs
- 0.0%
- Est. flood insurance / yr
- $1,737 – $8,500
Fire risk 3/10 · Minor
- Est. fire insurance / yr
- $666 – $1,236
Heat risk 8/10 · Major
- Hot days now (above 108°F)
- 7 days/yr
- Hot days in 30 yrs
- 16 days/yr
Wind risk 7/10 · Major
- Chance of severe wind over 30 yrs
- 74.0%
Air-quality risk 1/10 · Minimal
- Unhealthy air days now
- 0 days/yr
- Unhealthy air days in 30 yrs
- 0 days/yr
Risk factors via First Street. Map © Google.
Why this score? — see what drove the C- grade
The composite is a weighted blend of 9 inputs, each scored 0–100. Each bar is that input's sub-score; the figure is the points it added to the 100-point composite (weight × sub-score).
- ARV discount +15.0/15.0
- Cash flow +11.3/30.0
- Appreciation +10.0/10.0
- Schools +4.6/10.0
- DSCR +3.3/10.0
- Livability +3.0/5.0
- Rent growth +2.5/5.0
- Condition / age +2.5/5.0
- 1% rule +2.4/10.0
$164,900
🖨 Deal sheet (PDF) 📄 Offer letter ✓ Due diligence
Listing remarks
Great Opportunity to Gain Some Equity with this 3 Bedroom, 2 Bath Brick Ranch on a 1/2 Acre Lot. This home has a large Den and Kitchen are and a enclosed porch the entire width of the home on the rear. Large Utility Room. There are 2 large buildings for lots of outside storage with lots of possibilities. This is located on a shorter dead end road so limited traffic. This would be a great property for a homeowner or for an investor for a flip or rental.
Key facts
- 0.49 acre lot
- Built 1973
- Listed 27 days
Property features AI
Finance
- HOA & community: No HOA fees
Exterior
- Parking: Driveway parking spaces
- Utilities: Septic sewer; Well water; Electric water heater
- Home design: Detached ranch; Single-story
- Construction: Brick siding; Asphalt shingle roof; Crawlspace foundation
- Exterior features: Well water; Ramp for accessibility; Storage shed; Other additional structure
Interior
- Kitchen: Kitchen
- Bedrooms: Master bedroom on first floor; Additional bedroom (first floor)
- Flooring: Carpet; Vinyl
- Bathrooms: Two full bathrooms
- Heating & cooling: Heat pump heating; Heat pump cooling; Window/wall cooling units
- Interior features: Pull-down attic stairs; Scuttle access
- Laundry & utility: Washer; Dryer; Utility room
Neighborhood map
What this means for you Summary
Snapshot
- This is a 3-bed/2.0-bath single-family listed at $165k.
Deal economics
- At list price, monthly cash flow is $-487 ($-6k/yr) — negative.
- To cash-flow at today's rent, offer at most $79k (52.2% below list).
- To meet the 1% rule (rent ≥ 1% of price), the offer needs to be $122k (25.9% below list).
- Recommended offer: $79k (52.2% below list) — sets the bar for cash-flow.
- Cap rate 5.9% vs local median 3.8% in Franklin — top-decile yield for the area; either an underpriced asset or a hidden risk that comps aren't pricing in. Stress-test before assuming the spread holds.
Location & tenants
- Location reads 59/100 on livability (#461 in VA) — a working-class tenant base; expect higher turnover. Strengths: cost of living A+, housing A+, health & safety B+; Watch: crime F, amenities F, commute F.
- Southampton County Public School District (rural): math 43% / reading 66% proficiency, ranked #85 of 131 in VA (top 65%) — acceptable for families but not a draw, mixed tenant base, ~2y average lease.
- Zoned schools: Riverdale Elementary (math 52% / reading 67%, grade B-, #536 of 1,108 statewide, top 51%, 548 students, 76% FRL); Southampton Middle (math 31% / reading 56%, grade D, #285 of 342 statewide, top 84%, 566 students, 76% FRL); Southampton High (math 47% / reading 77%, grade B-, #231 of 319 statewide, top 75%, 769 students, 75% FRL) — zoned schools average 76% FRL vs 41% district-wide (35 pts higher); higher-poverty schools than district average — tighter screening recommended.
- Market conditions: 42 active listings in the ZIP; 60 units permitted in Southampton County in 2024 (0 in 5+ unit buildings).
Forward outlook
- In year one you build about $18k of equity ($1k loan paydown + $16k appreciation (10.0% local appreciation)).
- Southampton County population projected at -18% by 2050 — secular population decline; favor cash flow + early exit over multi-decade hold.
- By year 3, paydown + projected appreciation supports a ~$45k cash-out refi (75% LTV) — recoverable capital for the next deal without selling this one.
Negotiation context
- It's been on market 27 days — a 2% lower offer ($162k) is reasonable based on typical stale-listing flexibility.
Risks & watch-outs
- Watch-outs: flood insurance adds $427/mo.
- Climate carrying-cost: in FEMA flood zone AE (mandatory federal flood insurance); major wind risk, 74% chance of damaging wind over 30y; extreme-heat days projected 7→16/yr by 2055 (HVAC capex compounding) — expect insurance premiums to compound above CPI over the hold.
Questions for the listing agent
- What do current leases actually rent for vs. the listed asking? Can we see a recent rent roll and the last 12 months of T-12 income?
- Built in 1973 — when were the roof, HVAC, electrical panel, plumbing, and water heater last replaced?
- What's the actual annual flood-insurance premium (NFIP or private), and is the property in a SFHA with mandatory coverage?
- Is there a deadline driving the sale (1031 exchange, divorce, estate, relocation)? That informs how much negotiation room exists.
- Schools are B-rated — typically a magnet for longer-tenancy family renters. What's the average tenant stay here, and is there a school-zone premium baked into asking?
- Crime grade is F in this area — have there been break-ins, vandalism, or insurance claims at this property in the last 3 years? What carrier currently insures it and at what premium?
- What's the average days-on-market for RENTAL listings here right now (not sales)? A rising rental-DOM trend means longer vacancies and softer asking-rent achievability than the comps imply.
- What's the recent tenant-quality profile in this submarket — average credit score on applications, eviction rate, late-payment / NSF rate, and stable-employment percentage? A property-management company in the area should have these aggregated.
- How much new for-sale + rental construction is in the pipeline within 1–3 miles? Heavy new supply typically softens prices + rents 12–24 months out; constrained supply supports both.
Investment metrics
- 1% rule
- 0.74% ✗
- Cap rate
- 5.85%
- Cash-on-cash
- -1.57%
- DSCR
- 0.93
- GRM
- 11.2
CMA / ARV
- ARV (median comp)
- $293,026
- List price
- $164,900
- Delta
- -43.73%
- Verdict
- UNDERPRICED
- Comps
- 4 within 2.0 mi
Show comp detail 1 sale within ~0.75 mi
| Address | Dist | Beds/Ba | Sqft | Sold | Price | $/sf | Match |
|---|---|---|---|---|---|---|---|
| 29213 Hunt Club Dr | 0.07mi | 3/2.0 | 1,290 (-6%) | 9mo | $299,000 | $232 | 79 |
Match score weights: distance 35% · size 25% · config 20% · recency 20%. Top-matched comps best support the ARV.
Projected returns pro-forma
10.0% appreciation · 3.0% rent growth · sell at horizon
- IRR
- 15.5%
- Equity multiple
- 2.28×
- Total profit
- $59,004
- Equity at exit
- $148,555
- IRR
- 15.1%
- Equity multiple
- 5.30×
- Total profit
- $198,568
- Equity at exit
- $320,364
Cash invested: $46,172 (down + closing). Projections, not guarantees.
Landlord ↔ Tenant lean methodology
- Overall (STATE)
- 55 Moderately Landlord-Leaning
- State Virginia
- 55 Moderately Landlord-Leaning · D+2
- County
- — inherits STATE
- City
- — inherits STATE
ZIP-level market 23837
- Home prices YoY
- 4.9%
- Active inventory
- 42
- Price-to-rent
- 11.2×
Monthly cashflow live
- Estimated rent
- $1,222 medium interval (Pro) →
- Mortgage (P&I)
- −$865
- Tax from tax record
- −$93 /mo · $1,112/yr
- Insurance
- −$69
- Flood insurance flood zone
- −$427 /mo · $5,118/yr
- HOA
- −$0
- Vacancy / Maint / Mgmt
- −$257
- Net cashflow
- $-487
Break-even live
Sensitivity live
| Price | -10% $-394 | -5% $-440 | +0% $-487 | +5% $-534 | +10% $-580 |
|---|---|---|---|---|---|
| Rent | -10% $-584 | -5% $-535 | +0% $-487 | +5% $-439 | +10% $-390 |
| Rate | -1.0pp $-404 | -0.5pp $-445 | base $-487 | +0.5pp $-530 | +1.0pp $-573 |
UW: 25.0% down · 7.5% · 30yr · 1.5% tax · 5.0% vac · 8.0% maint · 8.0% mgmt
Financing live
Cash to close
- Down payment
- $41,225
- Closing costs
- $4,947
- Reserves months
- —
- Total cash needed
- —
Loan-product check · same deal, 3 products live
Conventional
25% down · 7.5% · 30yr
- Down + closing
- —
- Monthly P&I
- —
- Monthly cashflow
- —
- DSCR
- —
- Eligible?
- —
Personal DTI + credit; lowest rate.
DSCR
20% down · 8.5% · 30yr
- Down + closing
- —
- Monthly P&I
- —
- Monthly cashflow
- —
- DSCR
- —
- Eligible?
- —
No personal income docs; deal must DSCR.
Hard money
10% down · 12.0% · 12mo
- Down + closing
- —
- Monthly P&I
- —
- Monthly cashflow
- —
- DSCR
- —
- Eligible?
- —
Short-term bridge; refi at stabilization.
Listing history 6 events
-
2026-06-04status $164,900 Under Contract 27 DOM
-
2026-06-03days on market $164,900 Active 27 DOM
-
2026-06-02days on market $164,900 Active 26 DOM
-
2026-06-01days on market $164,900 Active 25 DOM
-
2026-05-31days on market $164,900 Active 24 DOM
-
2026-05-06$174,900 Active 461-char remark
ⓘ Source: listings_history table (triggers on properties + properties_extension) + one-shot
backfill from property_details.listing_events for pre-trigger history.
Tax reassessment forecast VA · Resets to sale price
- Current annual tax
- $1,112 · $93/mo
- Projected year-2 tax
- $1,352 · $113/mo
- Expected delta
- +$240/yr (+$20/mo · 21.6%)
ⓘ Screening estimate from a state-policy table — verify with the county assessor before closing.
Climate risk First Street
- Flood 1/10 Low FEMA zone AE · 0% chance over 30 yrs
- Wildfire 3/10 Moderate
- Heat 8/10 Severe 7 d/yr ≥108°F today · 16 d/yr by 30 yrs out
- Wind 7/10 Severe 74% chance of damaging wind over 30 yrs
- Air quality 1/10 Low 0 unhealthy d/yr today · 0 by 30 yrs out
Nearby sold comps map
Loading sold comps map…
Walkable amenities ~0.75 mi
Loading nearby amenities…
Taxation est. · year 1
- Rental income
- $14,669
- − Mortgage interest
- −$9,237
- − Property taxes
- −$1,112
- − Insurance
- −$5,943
- − Repairs & maintenance
- −$1,173
- − Management
- −$1,173
- − Depreciation
- −$4,797
- Taxable loss
- −$8,767
- Est. tax savings @ 24.0%
- +$2,104
- After-tax cash flow
- $-3,740/yr
For passive investors: Depreciation is non-cash, so a rental often shows a tax loss while cash-flowing — sheltering income. Rental losses are passive: they offset passive income freely, and up to $25,000/yr can offset ordinary (W-2) income if you actively participate and your MAGI is under $100k (phasing out to $0 by $150k); unused losses carry forward. On sale, claimed depreciation is recaptured at up to 25%, and gains may owe capital-gains tax (a 1031 exchange can defer both). Figures are a year-1 estimate at your 24.0% rate — not tax advice; consult a CPA.
Schools (NCES district)
- District
- Southampton County Public School District
- NCES district ID
- 5103600
- Math proficiency
- 43% ▼ -42.00%
- Reading proficiency
- 66% ▼ -14.00%
- Median HH income
- $48,952
- Composite
- 46.32/100
- National rank
- #2472
- State rank
- #85 of 131 in VA
Livability — Franklin
- Score
- 59/100
- State rank
- #461
- US rank
- #19645
Category grades
Schools grade is shown separately in the Schools card above.
Census & demographics
- Population (ZIP)
- 4,414
Population outlook (Southampton County) Hauer SSP2
- Today (2025)
- 17,420 people
- By 2030
- 16,944 · -2.7%
- By 2040
- 15,790 · -9.4%
- By 2050
- 14,244 · -18.2%
- By 2075
- 11,048 · -36.6%
- By 2100
- 7,838 · -55.0%
Race, ethnicity, and origin ACS 2023
- Neighborhood character
- Majority White (59%)
- Race & ethnicity
- White 59% Black 37% Two or more races 3%
- Common ancestry
- Romanian 1% Lithuanian 1%
- Foreign-born
- 3%
- Languages at home
- 96% English-only · German/W. Germanic 2% Other Asian/Pacific 1% Spanish 1%
Political lean MEDSL · Southampton
- 2024 margin
- Strong R (+25.5) · D 36.9% · R 62.4%
- 2008→2024 swing
- -23.5pp toward R · 2008: -2.0pp · 2024: -25.5pp
- All cycles
- 2024: R+25.5 2020: R+18.0 2016: R+16.2 2012: R+3.2 2008: R+2.0
Not yet ingested
- Civics
- —
Market trends
- HPI YoY
- ▲ 13.64%
- Current HPI
- 292.9774
- Rent YoY
- —
- Metro
- —
- State GDP YoY
- ▲ 2.40%
- F500 in state
- 50
Industry mix (Fortune 500 HQ in VA)
| Industry | F500 HQs | Revenue |
|---|---|---|
| Aerospace / Defense | 4 | $236B |
|
||
| Technology / Defense | 3 | $32B |
|
||
| Financial Services | 2 | $176B |
|
||
| Utilities | 2 | $27B |
|
||
| Insurance | 2 | $25B |
|
||
| Technology | 2 | $15B |
|
||
Price history
-5.7% since first listed3 events — show timeline
- 2026-06-04 Pending — REINMLS
- 2026-05-27 Price Changed $164,900 REINMLS
- 2026-05-06 Listed $174,900 REINMLS
Property tax history
+1.8%/yrLatest (2025): $1,112 · +0.0% YoY. Source: county tax records.
Cash-flow waterfall
monthlySold comps — $/sqft
last 12 mo · ≤1 miLoading sold comps…