60 School View Dr · Prattsville, NY
Flood risk 9/10 · Severe
- FEMA flood zone
- X (unshaded)
- Chance of flooding over 30 yrs
- 0.99%
- Est. flood insurance / yr
- $473 – $860
Fire risk 1/10 · Minimal
- Est. fire insurance / yr
- $691 – $1,283
Heat risk 2/10 · Minimal
- Hot days now (above 89°F)
- 8 days/yr
- Hot days in 30 yrs
- 18 days/yr
Wind risk 2/10 · Minimal
- Chance of severe wind over 30 yrs
- 3.0%
Air-quality risk 1/10 · Minimal
- Unhealthy air days now
- 0 days/yr
- Unhealthy air days in 30 yrs
- 0 days/yr
Risk factors via First Street. Map © Google.
Why this score? — see what drove the F grade
The composite is a weighted blend of 9 inputs, each scored 0–100. Each bar is that input's sub-score; the figure is the points it added to the 100-point composite (weight × sub-score).
- Cash flow +7.7/30.0
- Appreciation +5.0/10.0
- ARV discount +4.6/15.0
- Schools +3.5/10.0
- Livability +2.7/5.0
- Rent growth +2.5/5.0
- Condition / age +2.5/5.0
- 1% rule +2.3/10.0
- DSCR +1.8/10.0
$145,000
🖨 Deal sheet (PDF) 📄 Offer letter ✓ Due diligence
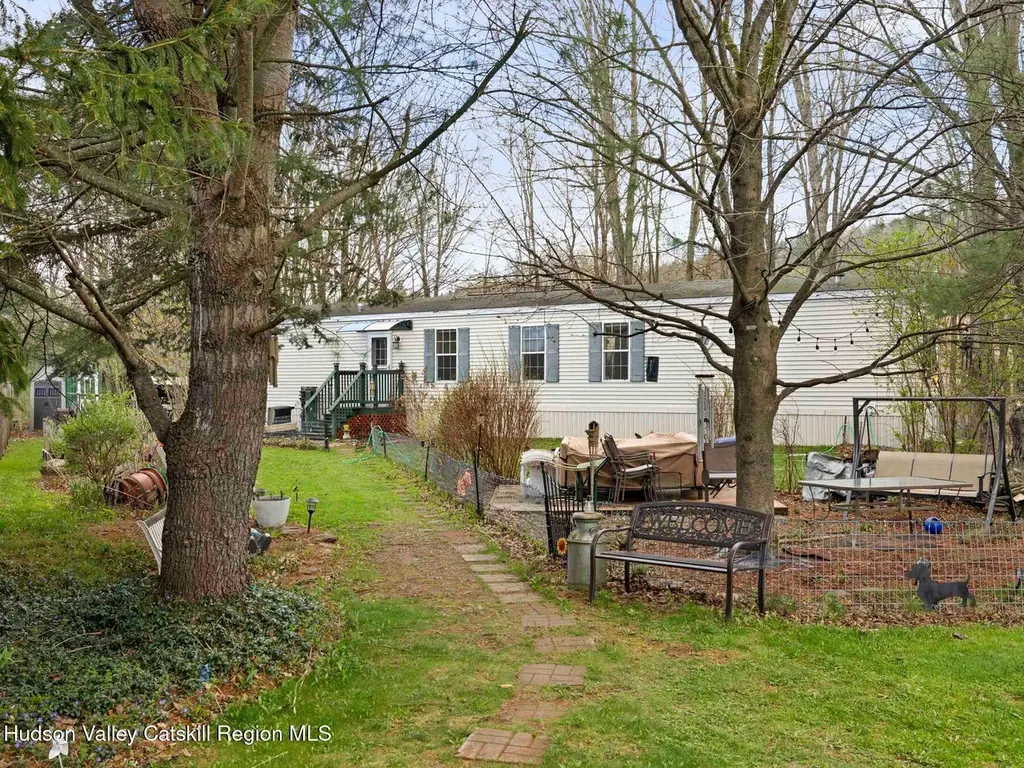
Listing remarks
Sweet and well cared for manufactured home with 2 bedrooms (office could be the 3rd) and 2 full baths. Primary suite features 2 closets and a corner tub. Stainless steel gas range and dishwasher in the kitchen. Perenneal landscaping and a lovely view of the stream from the back deck. Super low taxes in lovely Grand Gorge, 20 minutes to Windham, 25 to Hunter
Key facts
- Primary suite
- View of the stream
- 0.3 acre lot
Tags
Property features AI
Exterior
- Home design: Single-family residence
- Construction: 952 above-grade finished area
- Exterior features: 0.3-acre lot; Residential zoning
Interior
- Bathrooms: 2 full bathrooms
- Interior features: Two full bathrooms
Neighborhood map
What this means for you Summary
Snapshot
- This is a 2-bed/2.0-bath single-family listed at $145k.
Deal economics
- At list price, monthly cash flow is $-222 ($-3k/yr) — negative.
- To cash-flow at today's rent, offer at most $113k (22.2% below list).
- To meet the 1% rule (rent ≥ 1% of price), the offer needs to be $106k (27.1% below list).
- Recommended offer: $106k (27.1% below list) — sets the bar for 1% rule.
- Cap rate 4.9% vs local median 2.6% in Prattsville — top-decile yield for the area; either an underpriced asset or a hidden risk that comps aren't pricing in. Stress-test before assuming the spread holds.
Location & tenants
- Location reads 53/100 on livability (#1,160 in NY) — a working-class tenant base; expect higher turnover. Strengths: housing A, cost of living B+; Watch: schools F, crime D-, amenities F.
- Roxbury Central School District (rural): math 40% / reading 35% proficiency, ranked #668 of 755 in NY (top 88%) — families likely to look elsewhere, expect single-tenant / working-renter base with shorter leases.
- Market conditions: 8 active listings in the ZIP; 66 units permitted in Delaware County in 2024 (0 in 5+ unit buildings).
Forward outlook
- In year one you build about $5k of equity ($1k loan paydown + $4k appreciation (3.0% local appreciation)).
- Delaware County population projected at -27% by 2050 — secular population decline; favor cash flow + early exit over multi-decade hold.
- By year 7, paydown + projected appreciation supports a ~$34k cash-out refi (75% LTV) — recoverable capital for the next deal without selling this one.
Negotiation context
- It's been on market 52 days — a 3% lower offer ($141k) is reasonable based on typical stale-listing flexibility.
- 2 sale attempts since 5y ago with the ask held roughly flat each time — persistent listings suggest the price (not the market) is what's stuck; bring a comps-based counter.
Risks & watch-outs
- Watch-outs: flood insurance adds $56/mo.
- Climate carrying-cost: severe flood risk — expect insurance premiums to compound above CPI over the hold.
Questions for the listing agent
- What do current leases actually rent for vs. the listed asking? Can we see a recent rent roll and the last 12 months of T-12 income?
- It's been on market 52 days. Have you received any prior offers? Is the seller open to a 27% concession, seller financing, or rate buy-down credit?
- What's the actual annual flood-insurance premium (NFIP or private), and is the property in a SFHA with mandatory coverage?
- Is there a deadline driving the sale (1031 exchange, divorce, estate, relocation)? That informs how much negotiation room exists.
- Schools are F-rated, which usually means shorter tenancies and higher turnover. Who's the typical renter profile here, and what's been the actual vacancy rate?
- Crime grade is D in this area — have there been break-ins, vandalism, or insurance claims at this property in the last 3 years? What carrier currently insures it and at what premium?
- The area grade is low — what's the realistic commute time and amenity access for the typical tenant pool here? Any planned neighborhood developments (good or bad) we should know about?
- What's the average days-on-market for RENTAL listings here right now (not sales)? A rising rental-DOM trend means longer vacancies and softer asking-rent achievability than the comps imply.
- What's the recent tenant-quality profile in this submarket — average credit score on applications, eviction rate, late-payment / NSF rate, and stable-employment percentage? A property-management company in the area should have these aggregated.
- How much new for-sale + rental construction is in the pipeline within 1–3 miles? Heavy new supply typically softens prices + rents 12–24 months out; constrained supply supports both.
Investment metrics
- 1% rule
- 0.73% ✗
- Cap rate
- 4.91%
- Cash-on-cash
- -4.93%
- DSCR
- 0.78
- GRM
- 11.4
CMA / ARV
- ARV (median comp)
- $136,126
- List price
- $145,000
- Delta
- 6.52%
- Verdict
- FAIR
- Comps
- 5 within 1.0 mi
Projected returns pro-forma
3.0% appreciation · 3.0% rent growth · sell at horizon
- IRR
- 1.4%
- Equity multiple
- 1.08×
- Total profit
- $3,355
- Equity at exit
- $65,198
- IRR
- 5.1%
- Equity multiple
- 1.79×
- Total profit
- $31,883
- Equity at exit
- $100,478
Cash invested: $40,600 (down + closing). Projections, not guarantees.
Landlord ↔ Tenant lean methodology
- Overall (STATE)
- 15 Strongly Tenant-Friendly
- State New York
- 15 Strongly Tenant-Friendly · D+10
- County
- — inherits STATE
- City
- — inherits STATE
ZIP-level market 12434
- Active inventory
- 8
- Price-to-rent
- 11.4×
Monthly cashflow live
- Estimated rent
- $1,057 medium interval (Pro) →
- Mortgage (P&I)
- −$760
- Tax est. 1.5%
- −$181 /mo · $2,175/yr
- Insurance
- −$60
- Flood insurance flood zone
- −$56 /mo · $666/yr
- HOA
- −$0
- Vacancy / Maint / Mgmt
- −$222
- Net cashflow
- $-222
Break-even live
Sensitivity live
| Price | -10% $-122 | -5% $-172 | +0% $-222 | +5% $-272 | +10% $-323 |
|---|---|---|---|---|---|
| Rent | -10% $-306 | -5% $-264 | +0% $-222 | +5% $-181 | +10% $-139 |
| Rate | -1.0pp $-149 | -0.5pp $-185 | base $-222 | +0.5pp $-260 | +1.0pp $-298 |
UW: 25.0% down · 7.5% · 30yr · 1.5% tax · 5.0% vac · 8.0% maint · 8.0% mgmt
Financing live
Cash to close
- Down payment
- $36,250
- Closing costs
- $4,350
- Reserves months
- —
- Total cash needed
- —
Loan-product check · same deal, 3 products live
Conventional
25% down · 7.5% · 30yr
- Down + closing
- —
- Monthly P&I
- —
- Monthly cashflow
- —
- DSCR
- —
- Eligible?
- —
Personal DTI + credit; lowest rate.
DSCR
20% down · 8.5% · 30yr
- Down + closing
- —
- Monthly P&I
- —
- Monthly cashflow
- —
- DSCR
- —
- Eligible?
- —
No personal income docs; deal must DSCR.
Hard money
10% down · 12.0% · 12mo
- Down + closing
- —
- Monthly P&I
- —
- Monthly cashflow
- —
- DSCR
- —
- Eligible?
- —
Short-term bridge; refi at stabilization.
Listing history 18 events
-
2026-06-21days on market $145,000 Active 52 DOM
-
2026-06-21days on market $145,000 Active 51 DOM
-
2026-06-18days on market $145,000 Active 49 DOM
-
2026-06-17days on market $145,000 Active 48 DOM
-
2026-06-16days on market $145,000 Active 47 DOM
-
2026-06-15days on market $145,000 Active 46 DOM
-
2026-06-13days on market $145,000 Active 44 DOM
-
2026-06-12days on market $145,000 Active 43 DOM
-
2026-06-09days on market $145,000 Active 40 DOM
-
2026-06-08days on market $145,000 Active 39 DOM
-
2026-06-07days on market $145,000 Active 38 DOM
-
2026-06-07days on market $145,000 Active 37 DOM
-
2026-06-04days on market $145,000 Active 34 DOM
-
2026-06-02days on market $145,000 Active 33 DOM
-
2026-06-01days on market $145,000 Active 32 DOM
-
2026-05-31days on market $145,000 Active 31 DOM
-
2026-04-30$145,000 Active 359-char remark
-
2021-11-02$360,000
ⓘ Source: listings_history table (triggers on properties + properties_extension) + one-shot
backfill from property_details.listing_events for pre-trigger history.
Climate risk First Street
- Flood 9/10 Extreme FEMA zone X (unshaded) · 99% chance over 30 yrs
- Wildfire 1/10 Low
- Heat 2/10 Low 8 d/yr ≥89°F today · 18 d/yr by 30 yrs out
- Wind 2/10 Low 3% chance of damaging wind over 30 yrs
- Air quality 1/10 Low 0 unhealthy d/yr today · 0 by 30 yrs out
Nearby sold comps map
Loading sold comps map…
Walkable amenities ~0.75 mi
Loading nearby amenities…
Taxation est. · year 1
- Rental income
- $12,687
- − Mortgage interest
- −$8,122
- − Property taxes
- −$2,175
- − Insurance
- −$1,392
- − Repairs & maintenance
- −$1,015
- − Management
- −$1,015
- − Depreciation
- −$4,218
- Taxable loss
- −$5,250
- Est. tax savings @ 24.0%
- +$1,260
- After-tax cash flow
- $-1,408/yr
For passive investors: Depreciation is non-cash, so a rental often shows a tax loss while cash-flowing — sheltering income. Rental losses are passive: they offset passive income freely, and up to $25,000/yr can offset ordinary (W-2) income if you actively participate and your MAGI is under $100k (phasing out to $0 by $150k); unused losses carry forward. On sale, claimed depreciation is recaptured at up to 25%, and gains may owe capital-gains tax (a 1031 exchange can defer both). Figures are a year-1 estimate at your 24.0% rate — not tax advice; consult a CPA.
Schools (NCES district)
- District
- Roxbury Central School District
- NCES district ID
- 3625110
- Math proficiency
- 40% ▼ -10.00%
- Reading proficiency
- 35% ▼ -10.00%
- Median HH income
- $47,744
- Composite
- 34.74/100
- National rank
- #10038
- State rank
- #668 of 755 in NY
Livability — Prattsville
- Score
- 53/100
- State rank
- #1160
- US rank
- #24537
Category grades
Schools grade is shown separately in the Schools card above.
Census & demographics
- Population (ZIP)
- 892
Population outlook (Delaware County) Hauer SSP2
- Today (2025)
- 42,668 people
- By 2030
- 40,337 · -5.5%
- By 2040
- 35,514 · -16.8%
- By 2050
- 31,265 · -26.7%
- By 2075
- 24,455 · -42.7%
- By 2100
- 19,529 · -54.2%
Race, ethnicity, and origin ACS 2023
- Neighborhood character
- Predominantly White (91%)
- Race & ethnicity
- White 91% Two or more races 5% Black 3% Hispanic / Latino 1%
- Common ancestry
- Romanian 5% Iranian 4% Slovak 2%
- Foreign-born
- 2%
- Languages at home
- 99% English-only · German/W. Germanic 1%
Political lean MEDSL · Delaware
- 2024 margin
- R (+19.8) · D 40.1% · R 59.9%
- 2008→2024 swing
- -14.6pp toward R · 2008: -5.2pp · 2024: -19.8pp
- All cycles
- 2024: R+19.8 2020: R+18.4 2016: R+29.2 2012: R+9.6 2008: R+5.2
Not yet ingested
- Civics
- —
Market trends
- HPI YoY
- —
- Current HPI
- —
- Rent YoY
- —
- Metro
- —
- State GDP YoY
- ▲ 2.60%
- F500 in state
- 92
Industry mix (Fortune 500 HQ in NY)
| Industry | F500 HQs | Revenue |
|---|---|---|
| Financial Services | 10 | $950B |
|
||
| Consumer Goods | 9 | $162B |
|
||
| Insurance | 4 | $225B |
|
||
| Telecommunications | 2 | $144B |
|
||
| Pharmaceuticals | 2 | $112B |
|
||
| Media / Entertainment | 2 | $69B |
|
||
Price history
-59.7% since first listed2 events — show timeline
- 2026-04-30 Listed $145,000 HVCRMLS
- 2021-11-02 Listed $360,000 UNYREIS
Cash-flow waterfall
monthlySold comps — $/sqft
last 12 mo · ≤1 miLoading sold comps…