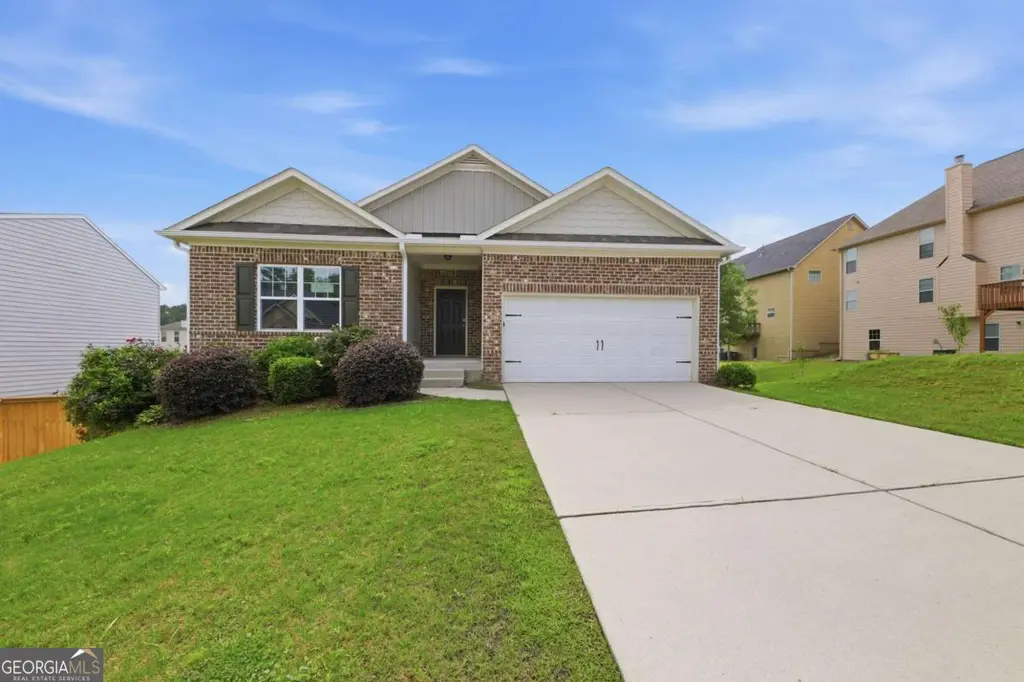
34 Dalgety Xing · Dallas, GA
Flood risk 1/10 · Minimal
- FEMA flood zone
- X (unshaded)
- Chance of flooding over 30 yrs
- 0.0%
- Est. flood insurance / yr
- $507 – $1,088
Fire risk 4/10 · Minor
- Est. fire insurance / yr
- $963 – $1,789
Heat risk 6/10 · Moderate
- Hot days now (above 105°F)
- 7 days/yr
- Hot days in 30 yrs
- 20 days/yr
Wind risk 4/10 · Minor
- Chance of severe wind over 30 yrs
- 20.0%
Air-quality risk 4/10 · Minor
- Unhealthy air days now
- 4 days/yr
- Unhealthy air days in 30 yrs
- 5 days/yr
Risk factors via First Street. Map © Google.
Why this score? — see what drove the D- grade
The composite is a weighted blend of 9 inputs, each scored 0–100. Each bar is that input's sub-score; the figure is the points it added to the 100-point composite (weight × sub-score).
- Cash flow +12.1/30.0
- ARV discount +6.8/15.0
- DSCR +3.6/10.0
- Schools +3.6/10.0
- Livability +3.3/5.0
- 1% rule +3.2/10.0
- Rent growth +3.0/5.0
- Condition / age +2.5/5.0
- Appreciation +0.0/10.0
$319,900
🖨 Deal sheet 📄 Offer letter ✓ Due diligence
Listing remarks MLS
Discover modern suburban living at its finest in this beautiful 3-bedroom, 2-bathroom single-family ranch in the Highlands North community! Boasting an open-concept design with vaulted ceilings, an eat-in kitchen with stainless steel appliances, this 2019-built home is designed for comfort. Enjoy the ease of a single-story layout paired with a massive daylight basement, ideal for extensive storage or recreational space. Equipped with an attached 2-car garage, and a charming elevated and sheltered rear porch. Conveniently located near local parks, retail hubs, and steps from Northside Elementary. Pet-friendly community!
Key facts
- Open-concept design
- Eat-in kitchen
- Elevated rear porch
Tags
Property features AI
Finance
- HOA & community: Homeowners association with an annual fee of $495
Exterior
- Parking: Garage (2 spaces)
- Utilities: Public water; Public sewer; Electricity available; Natural gas available; Cable available; Phone available; Sewer available; Water available
- Home design: Single-level home; Resale property
- Construction: Brick construction; Shingle roof; Block foundation
- Exterior features: Rear porch; Other exterior features; Asphalt road frontage on a private road
Interior
- Kitchen: Dishwasher; Disposal; Gas range; Refrigerator; Cabinets
- Bedrooms: Three main-level bedrooms; Other bedroom features; Master bathroom with other features
- Flooring: Other flooring
- Bathrooms: Two full bathrooms (both on the main level)
- Heating & cooling: Other heating; Other cooling
- Interior features: No common walls; Unfinished basement; Other interior features
- Laundry & utility: Laundry closet
Neighborhood map
What this means for you Summary
Snapshot
- This is a 4-bed/2.0-bath single-family listed at $320k.
Deal economics
- At list price, monthly cash flow is $-73 ($-877/yr) — negative.
- To cash-flow at today's rent, offer at most $307k (4.0% below list).
- To meet the 1% rule (rent ≥ 1% of price), the offer needs to be $263k (17.8% below list).
- Recommended offer: $263k (17.8% below list) — sets the bar for 1% rule.
- Cap rate 6.0% vs local median 4.2% in Dallas — top-decile yield for the area; either an underpriced asset or a hidden risk that comps aren't pricing in. Stress-test before assuming the spread holds.
Location & tenants
- Location reads 66/100 on livability (#192 in GA) — a middle-class / working-renter tenant base. Strengths: crime A+, cost of living A+, housing A+; Watch: employment C-, amenities F, commute F.
- Paulding County (suburban): math 39% / reading 42% proficiency, ranked #33 of 174 in GA (top 19%) — families likely to look elsewhere, expect single-tenant / working-renter base with shorter leases.
- Zoned schools: Lena Mae Moses Middle School (math 38% / reading 53%, grade D+, #97 of 470 statewide, top 22%, 907 students, 42% FRL); North Paulding High School (math 12% / reading 37%, grade F, #184 of 424 statewide, top 48%, 2,986 students, 21% FRL) — zoned schools at 32% FRL track the district average.
- Market conditions: Rents rising (+1.8%/yr); 652 active listings in the ZIP; 2 comparable units currently listed for rent nearby; solid renter incomes; 1,458 units permitted in Paulding County in 2024 (0 in 5+ unit buildings).
Forward outlook
- Local home prices are declining (-3.0%/yr); year-one equity from $2k of loan paydown is wiped out by about $10k of value loss. Plan a longer hold.
- Paulding County population projected at +24% by 2050 — long-run rental-demand tailwind backs the buy-and-hold thesis.
Negotiation context
- Only 13 days on market — expect competitive offers; lowballing is unlikely to land.
- 12 sale attempts since 8y ago with the ask held roughly flat each time — persistent listings suggest the price (not the market) is what's stuck; bring a comps-based counter.
- Current owner paid $269k; 19% above their basis — modest negotiation headroom, anchor on the comps not their cost.
Risks & watch-outs
- Climate carrying-cost: extreme-heat days projected 7→20/yr by 2055 (HVAC capex compounding) — expect insurance premiums to compound above CPI over the hold.
Questions for the listing agent
- What do current leases actually rent for vs. the listed asking? Can we see a recent rent roll and the last 12 months of T-12 income?
- What does the HOA fee cover, when was the last increase, and are there any pending special assessments or reserve-fund shortfalls?
- Is there a deadline driving the sale (1031 exchange, divorce, estate, relocation)? That informs how much negotiation room exists.
- Schools are D-rated, which usually means shorter tenancies and higher turnover. Who's the typical renter profile here, and what's been the actual vacancy rate?
- The area grade is low — what's the realistic commute time and amenity access for the typical tenant pool here? Any planned neighborhood developments (good or bad) we should know about?
- What's the average days-on-market for RENTAL listings here right now (not sales)? A rising rental-DOM trend means longer vacancies and softer asking-rent achievability than the comps imply.
- What's the recent tenant-quality profile in this submarket — average credit score on applications, eviction rate, late-payment / NSF rate, and stable-employment percentage? A property-management company in the area should have these aggregated.
- How much new for-sale + rental construction is in the pipeline within 1–3 miles? Heavy new supply typically softens prices + rents 12–24 months out; constrained supply supports both.
Investment metrics
- 1% rule
- 0.82% ✗
- Cap rate
- 6.02%
- Cash-on-cash
- -0.98%
- DSCR
- 0.96
- GRM
- 10.1
CMA / ARV
- ARV (on-the-fly)
- $314,840
- Comps found
- 11
Show comp detail 11 sales within ~0.75 mi
| Address | Dist | Beds/Ba | Sqft | Sold | Price | $/sf | Match |
|---|---|---|---|---|---|---|---|
| 219 Aberdeen Way | 0.14mi | 4/2.5 | 1,889 (+2%) | 6mo | $305,000 | $161 | 83 |
| 675 Scotland Dr | 0.20mi | 3/2.0 (-1) | 1,832 (-1%) | 4mo | $295,000 | $161 | 80 |
| 283 Scotland Dr | 0.16mi | 4/2.5 | 1,868 (+1%) | 14mo | $329,000 | $176 | 77 |
| 274 Caledonian Cir | 0.11mi | 3/2.0 (-1) | 1,852 (0%) | 21mo | $289,900 | $157 | 72 |
| 38 Kelso Way | 0.11mi | 3/2.5 (-1) | 1,632 (-12%) | 6mo | $285,000 | $175 | 63 |
| 320 Aberdeen Way | 0.19mi | 4/2.0 | 1,965 (+6%) | 23mo | $300,000 | $153 | 61 |
| 320 Aberdeen Way | 0.20mi | 4/2.0 | 1,965 (+6%) | 23mo | $300,000 | $153 | 61 |
| 140 Cyrilla Walk | 0.63mi | 4/2.0 | 1,791 (-3%) | 8mo | $385,000 | $215 | 59 |
| 79 Cyrilla Walk | 0.71mi | 4/2.0 | 1,774 (-4%) | 2mo | $381,115 | $215 | 58 |
| 125 Cyrilla Walk | 0.67mi | 4/2.0 | 1,774 (-4%) | 6mo | $384,990 | $217 | 57 |
| 207 John Walraven Rd | 0.75mi | 3/2.0 (-1) | 1,944 (+5%) | 4mo | $330,000 | $170 | 49 |
Match score weights: distance 35% · size 25% · config 20% · recency 20%. Top-matched comps best support the ARV.
Projected returns pro-forma
-3.0% appreciation · 1.84% rent growth · sell at horizon
- IRR
- -19.2%
- Equity multiple
- 0.34×
- Total profit
- $-59,525
- Equity at exit
- $47,698
- IRR
- -14.3%
- Equity multiple
- 0.22×
- Total profit
- $-69,981
- Equity at exit
- $27,659
Cash invested: $89,572 (down + closing). Projections, not guarantees.
Landlord ↔ Tenant lean methodology
- Overall (STATE)
- 90 Strongly Landlord-Friendly
- State Georgia
- 90 Strongly Landlord-Friendly · R+3
- County
- — inherits STATE
- City
- — inherits STATE
ZIP-level market 30132
- Home prices YoY
- -33.1%
- Rents YoY
- 1.8%
- Active inventory
- 652
- Price-to-rent
- 10.1×
Monthly cashflow live
- Estimated rent
- $2,629 medium interval (Pro) →
- Mortgage (P&I)
- −$1,678
- Tax from tax record
- −$298 /mo · $3,582/yr
- Insurance
- −$133
- HOA
- −$41
- Vacancy / Maint / Mgmt
- −$552
- Net cashflow
- $-73
Break-even live
UW: 25.0% down · 7.5% · 30yr · 1.5% tax · 5.0% vac · 8.0% maint · 8.0% mgmt
Financing live
Cash to close
- Down payment
- $79,975
- Closing costs
- $9,597
- Reserves months
- —
- Total cash needed
- —
Loan-product check · same deal, 3 products live
Conventional
25% down · 7.5% · 30yr
- Down + closing
- —
- Monthly P&I
- —
- Monthly cashflow
- —
- DSCR
- —
- Eligible?
- —
Personal DTI + credit; lowest rate.
DSCR
20% down · 8.5% · 30yr
- Down + closing
- —
- Monthly P&I
- —
- Monthly cashflow
- —
- DSCR
- —
- Eligible?
- —
No personal income docs; deal must DSCR.
Hard money
10% down · 12.0% · 12mo
- Down + closing
- —
- Monthly P&I
- —
- Monthly cashflow
- —
- DSCR
- —
- Eligible?
- —
Short-term bridge; refi at stabilization.
Rent comps 2 comps
| Address | Beds | Baths | Sqft | Rent | $/sqft | DOM | Units | Dist |
|---|---|---|---|---|---|---|---|---|
| 109 Caledonian Cir Dallas, GA | 3.0 | 2.0 | 1852 | $1,986 | $1.07 | 2d | 1 | 0.03mi |
| 215 Scotland Dr Dallas, GA | 4.0 | 2.5 | 1813 | $1,999 | $1.10 | 5d | 1 | 0.12mi |
HOA detail
- Monthly dues
- $41 · $492/yr
Listing history 10 events
-
2026-06-18days on market $319,900 Active 13 DOM
-
2026-06-17days on market $319,900 Active 12 DOM
-
2026-06-16days on market $319,900 Active 11 DOM
-
2026-06-15days on market $319,900 Active 10 DOM
-
2026-06-13days on market $319,900 Active 8 DOM
-
2026-06-13days on market $319,900 Active 7 DOM
-
2026-06-09days on market $319,900 Active 4 DOM
-
2026-06-08days on market $319,900 Active 3 DOM
-
2026-06-07remarks 626-char remark
-
2026-06-07$319,900 Active 2 DOM
ⓘ Source: listings_history table (triggers on properties + properties_extension) + one-shot
backfill from property_details.listing_events for pre-trigger history.
Tax reassessment forecast GA · Resets to sale price
- Current annual tax
- $3,582 · $298/mo
- Projected year-2 tax
- $3,582 · $298/mo
- Expected delta
- $0/yr ($0/mo · 0.0%)
ⓘ Screening estimate from a state-policy table — verify with the county assessor before closing.
Climate risk First Street
- Flood 1/10 Low FEMA zone X (unshaded) · 0% chance over 30 yrs
- Wildfire 4/10 Moderate
- Heat 6/10 Major 7 d/yr ≥105°F today · 20 d/yr by 30 yrs out
- Wind 4/10 Moderate 20% chance of damaging wind over 30 yrs
- Air quality 4/10 Moderate 4 unhealthy d/yr today · 5 by 30 yrs out
Nearby sold comps map
Loading sold comps map…
Walkable amenities ~0.75 mi
Loading nearby amenities…
Taxation est. · year 1
- Rental income
- $31,554
- − Mortgage interest
- −$17,919
- − Property taxes
- −$3,582
- − Insurance
- −$1,600
- − Repairs & maintenance
- −$2,524
- − Management
- −$2,524
- − HOA
- −$492
- − Depreciation
- −$9,306
- Taxable loss
- −$6,394
- Est. tax savings @ 24.0%
- +$1,535
- After-tax cash flow
- $657/yr
For passive investors: Depreciation is non-cash, so a rental often shows a tax loss while cash-flowing — sheltering income. Rental losses are passive: they offset passive income freely, and up to $25,000/yr can offset ordinary (W-2) income if you actively participate and your MAGI is under $100k (phasing out to $0 by $150k); unused losses carry forward. On sale, claimed depreciation is recaptured at up to 25%, and gains may owe capital-gains tax (a 1031 exchange can defer both). Figures are a year-1 estimate at your 24.0% rate — not tax advice; consult a CPA.
Schools (NCES district)
- District
- Paulding County
- NCES district ID
- 1304020
- Math proficiency
- 39% ▼ -6.00%
- Reading proficiency
- 42% ▼ -7.00%
- Median HH income
- $61,447
- Composite
- 36.0/100
- National rank
- #4784
- State rank
- #33 of 174 in GA
Livability — Dallas
- Score
- 66/100
- State rank
- #192
- US rank
- #11802
Category grades
Schools grade is shown separately in the Schools card above.
Census & demographics
- County
- Paulding County · 134,013 people
- City population
- 106,793
- Metro
- Atlanta-Sandy Springs-Alpharetta, GA
- Population (ZIP)
- 53,348
- Household income
- $109,914
- Rent vs Own
- Severe rent burden
- 593.0
Population outlook (Paulding County) Hauer SSP2
- Today (2025)
- 175,714 people
- By 2030
- 186,082 · +5.9%
- By 2040
- 204,414 · +16.3%
- By 2050
- 217,040 · +23.5%
- By 2075
- 236,980 · +34.9%
- By 2100
- 238,314 · +35.6%
Race, ethnicity, and origin ACS 2023
- Neighborhood character
- Majority White (64%)
- Race & ethnicity
- White 64% Black 19% Hispanic / Latino 9% Two or more races 8% Asian 2%
- Hispanic origin (detail)
- Mexican 3% Puerto Rican 2%
- Common ancestry
- Slovak 2% Romanian 2% Lithuanian 2%
- Foreign-born
- 8% · Canada, China
- Languages at home
- 91% English-only · Spanish 5% Other Indo-European 1% Tagalog/Filipino 1%
Political lean MEDSL · Paulding
- 2024 margin
- Strong R (+24.1) · D 37.6% · R 61.7%
- 2008→2024 swing
- +14.4pp toward D · 2008: -38.5pp · 2024: -24.1pp
- All cycles
- 2024: R+24.1 2020: R+29.1 2016: R+41.2 2012: R+43.6 2008: R+38.5
Not yet ingested
- Civics
- —
Market trends
- HPI YoY
- ▼ -92.85%
- Current HPI
- 187.6553
- Rent YoY
- ▲ 1.84%
- Metro
- Atlanta-Sandy Springs-Alpharetta, GA
- State GDP YoY
- ▲ 2.66%
- F500 in state
- 28
Industry mix (Fortune 500 HQ in GA)
| Industry | F500 HQs | Revenue |
|---|---|---|
| Paper / Packaging | 2 | $29B |
|
||
| Retail | 1 | $160B |
|
||
| Transportation / Logistics | 1 | $91B |
|
||
| Airlines | 1 | $62B |
|
||
| Consumer Goods | 1 | $47B |
|
||
| Utilities | 1 | $25B |
|
||
Price history
-93.2% since first listed42 events — show timeline
- 2026-06-03 Listed $319,900 FMLS
- 2026-06-03 Listed $319,900 GAMLS
- 2026-02-15 Rental Removed $1,910 RENTPROGRESS
- 2026-02-06 Price Changed $1,910 RENTPROGRESS
- 2026-02-03 Price Changed $1,890 RENTPROGRESS
- 2026-01-29 Price Changed $1,880 RENTPROGRESS
- 2026-01-26 Price Changed $1,940 RENTPROGRESS
- 2026-01-21 Price Changed $2,000 RENTPROGRESS
- 2026-01-15 Price Changed $2,060 RENTPROGRESS
- 2026-01-14 Price Changed $2,020 RENTPROGRESS
- 2026-01-10 Price Changed $2,000 RENTPROGRESS
- 2026-01-08 Listed for Rent $2,800 RENTPROGRESS
- 2021-06-28 Sold (Public Records) $269,000 Public Records
- 2021-06-28 Sold (MLS) $269,000 FMLS
- 2021-05-13 Pending — FMLS
- 2021-04-24 Listed $260,000 FMLS
- 2019-07-29 Sold (MLS) $226,900 GAMLS
- 2019-06-26 Pending — GAMLS
- 2019-06-14 Relisted — GAMLS
- 2019-06-11 Pending — GAMLS
- 2019-05-30 Relisted — GAMLS
- 2019-05-29 Pending — GAMLS
- 2019-05-17 Price Changed $226,900 GAMLS
- 2019-05-17 Relisted — GAMLS
- 2019-05-08 Listing Removed — GAMLS
- 2019-04-05 Relisted — GAMLS
- 2019-04-01 Listing Removed — GAMLS
- 2019-03-15 Price Changed $224,900 GAMLS
- 2019-03-01 Relisted — GAMLS
- 2019-01-31 Listing Removed — GAMLS
- 2019-01-03 Price Changed $219,900 GAMLS
- 2019-01-02 Relisted — GAMLS
- 2018-12-31 Listing Removed — GAMLS
- 2018-11-30 Relisted — GAMLS
- 2018-10-31 Listing Removed — GAMLS
- 2018-10-12 Price Changed $220,900 GAMLS
- 2018-10-09 Price Changed $216,900 GAMLS
- 2018-10-03 Price Changed $231,900 GAMLS
- 2018-08-31 Listed $236,900 GAMLS
- 2016-09-08 Sold (Public Records) $280,000 Public Records
- 2012-12-19 Sold (Public Records) $42,000 Public Records
- 2006-01-27 Sold (Public Records) $4,735,500 Public Records
Property tax history
+13.6%/yrLatest (2025): $3,582 · -3.1% YoY. Source: county tax records.
Cash-flow waterfall
monthlySold comps — $/sqft
last 12 mo · ≤1 miLoading sold comps…