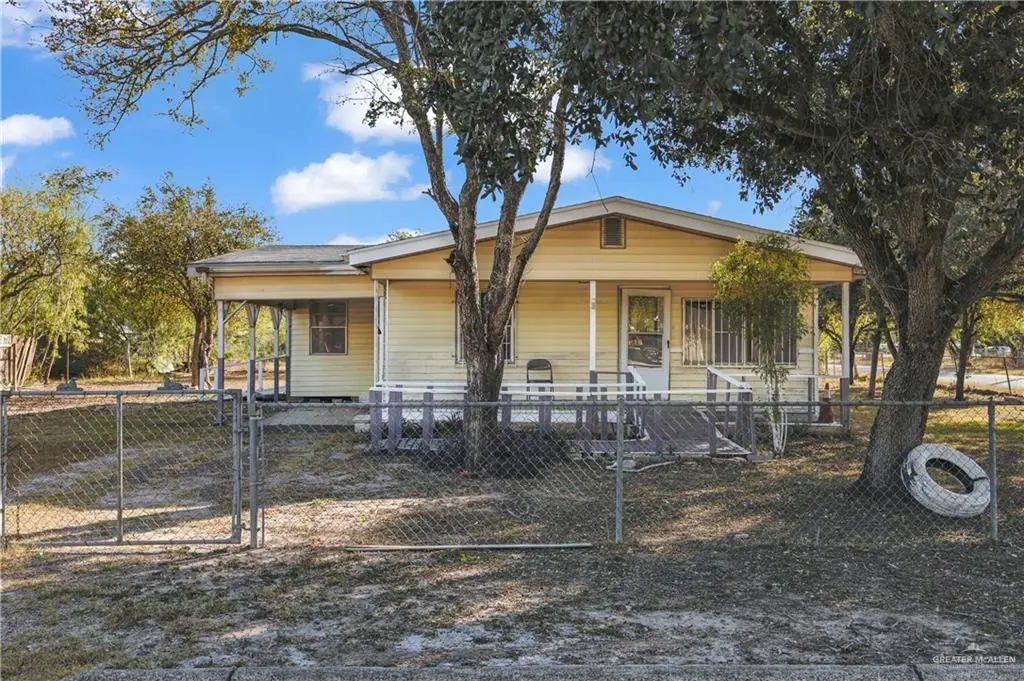
613 Ebony St · San Juan, TX
Flood risk 6/10 · Moderate
- FEMA flood zone
- —
- Chance of flooding over 30 yrs
- 0.72%
- Est. flood insurance / yr
- —
Fire risk 2/10 · Minimal
- Est. fire insurance / yr
- $1,222 – $2,270
Heat risk 9/10 · Severe
- Hot days now (above 111°F)
- 7 days/yr
- Hot days in 30 yrs
- 23 days/yr
Wind risk 8/10 · Major
- Chance of severe wind over 30 yrs
- 99.0%
Air-quality risk 3/10 · Minor
- Unhealthy air days now
- 1 days/yr
- Unhealthy air days in 30 yrs
- 4 days/yr
Risk factors via First Street. Map © Google.
Why this score? — see what drove the D- grade
The composite is a weighted blend of 9 inputs, each scored 0–100. Each bar is that input's sub-score; the figure is the points it added to the 100-point composite (weight × sub-score).
- Cash flow +17.0/30.0
- DSCR +5.3/10.0
- 1% rule +4.2/10.0
- Livability +3.6/5.0
- Rent growth +2.5/5.0
- Condition / age +2.5/5.0
- ARV discount +2.3/15.0
- Schools +2.0/10.0
- Appreciation +0.0/10.0
$135,000
🖨 Deal sheet (PDF) 📄 Offer letter ✓ Due diligence
Listing remarks
Investor special or first-time remodel opportunity in San Juan, TX! This pier-and-beam wood-frame home sits across two adjoining 50’ x 140’ lots (613 & 615 Ebony Ave, & Home= $135K), and both lots must be purchased together. The home retains its complete original layout with 3 bedrooms, a living area, dining area, kitchen, and laundry room, offering great bones for a full remodel. The seller removed the original wall paneling, and drywall was never installed, leaving the interior with exposed framing—perfect for someone ready to redesign the space to modern standards. Per seller, plumbing and electrical systems are operational. The pier-and-beam structure allows
Key facts
- Exposed framing
- Minutes from i-2
- Minutes from airport
Tags
Property features AI
Finance
- Other: Lot area approximately 7,000 sq. ft.; Living area reported by appraiser
- HOA & community: No HOA; Community features: Other
Exterior
- Parking: 1 total parking space; 1 covered space; 1-car carport (attached)
- Utilities: City sewer; Public water
- Home design: Frame/wood construction; Pillar/post/pier foundation
- Construction: Frame/wood construction; Shingle roof; Pillar/post/pier foundation
- Exterior features: Mature trees; Other exterior features; Chain link fencing; Shingle roof; Paved road access; Public water
Interior
- Kitchen: Electric water heater; Water heater (other); No conveying appliances
- Flooring: Hardwood
- Bathrooms: 1 full bathroom
- Interior features: Hardwood flooring; Window coverings (other); Countertops (other); Other interior features
- Laundry & utility: Laundry area
Neighborhood map
What this means for you Summary
Snapshot
- This is a 3-bed/2.0-bath single-family listed at $135k.
Deal economics
- At list price, monthly cash flow is $92 ($1k/yr) — positive.
- The deal already cash-flows at list — no discount required.
- To meet the 1% rule (rent ≥ 1% of price), the offer needs to be $125k (7.7% below list).
- Recommended offer: $125k (7.7% below list) — sets the bar for 1% rule.
- Cap rate 7.1% vs local median 3.4% in San Juan — top-decile yield for the area; either an underpriced asset or a hidden risk that comps aren't pricing in. Stress-test before assuming the spread holds.
Location & tenants
- Location reads 71/100 on livability (#294 in TX) — a middle-class / working-renter tenant base. Strengths: cost of living A+, housing A+, health & safety A+; Watch: amenities F, commute F, employment D-.
- Pharr-San Juan-Alamo ISD (suburban): math 18% / reading 30% proficiency, ranked #740 of 826 in TX (top 90%) — low school quality limits family demand, transient renter base, plan for 1-2y turnover; 72% free/reduced lunch — lower-income household profile, screen leases tightly.
- Zoned schools: Vida N Clover El (math 17% / reading 17%, grade F, #3,836 of 4,322 statewide, top 91%, 426 students, 93% FRL); Austin Middle (math 14% / reading 18%, grade F, #1,543 of 1,662 statewide, top 94%, 951 students, 85% FRL); Psja Early College H S (math 33% / reading 65%, grade D, #553 of 1,632 statewide, top 34%, 2,459 students, 93% FRL) — zoned schools average 90% FRL vs 72% district-wide (19 pts higher); higher-poverty schools than district average — tighter screening recommended.
- Market conditions: 363 active listings in the ZIP; 9 comparable units currently listed for rent nearby; rentals lingering (median 46d on market — plan ~5-8 weeks vacancy on turnover, expect pricing pressure); 67% of comp listings sitting > 30 days — soft ceiling on asking rent; 7,378 units permitted in Hidalgo County in 2024 (641 in 5+ unit buildings).
Forward outlook
- Local home prices are declining (-3.0%/yr); year-one equity from $933 of loan paydown is wiped out by about $4k of value loss. Plan a longer hold.
- Hidalgo County population projected at +28% by 2050 — long-run rental-demand tailwind backs the buy-and-hold thesis.
Negotiation context
- Only 9 days on market — expect competitive offers; lowballing is unlikely to land.
- 2 sale attempts with the ask held roughly flat each time — persistent listings suggest the price (not the market) is what's stuck; bring a comps-based counter.
Risks & watch-outs
- Climate carrying-cost: major flood risk; severe wind risk, 99% chance of damaging wind over 30y; extreme-heat days projected 7→23/yr by 2055 (HVAC capex compounding) — expect insurance premiums to compound above CPI over the hold.
Questions for the listing agent
- Is there a deadline driving the sale (1031 exchange, divorce, estate, relocation)? That informs how much negotiation room exists.
- Schools are D-rated, which usually means shorter tenancies and higher turnover. Who's the typical renter profile here, and what's been the actual vacancy rate?
- The area grade is low — what's the realistic commute time and amenity access for the typical tenant pool here? Any planned neighborhood developments (good or bad) we should know about?
- What's the average days-on-market for RENTAL listings here right now (not sales)? A rising rental-DOM trend means longer vacancies and softer asking-rent achievability than the comps imply.
- What's the recent tenant-quality profile in this submarket — average credit score on applications, eviction rate, late-payment / NSF rate, and stable-employment percentage? A property-management company in the area should have these aggregated.
- How much new for-sale + rental construction is in the pipeline within 1–3 miles? Heavy new supply typically softens prices + rents 12–24 months out; constrained supply supports both.
Investment metrics
- 1% rule
- 0.92% ✗
- Cap rate
- 7.11%
- Cash-on-cash
- 2.92%
- DSCR
- 1.13
- GRM
- 9.0
CMA / ARV
- ARV (median comp)
- $121,097
- List price
- $135,000
- Delta
- 11.48%
- Verdict
- OVERPRICED
- Comps
- 20 within 1.0 mi
Show comp detail 12 sales within ~0.75 mi
| Address | Dist | Beds/Ba | Sqft | Sold | Price | $/sf | Match |
|---|---|---|---|---|---|---|---|
| 605 Ebony St | 0.04mi | 3/1.5 | 1,168 (-1%) | 8mo | $72,000 | $62 | 88 |
| 812 N Oblate Dr | 0.25mi | 3/1.0 | 1,217 (+4%) | 16mo | $95,000 | $78 | 65 |
| 306 W 3rd St | 0.51mi | 3/2.0 | 1,134 (-4%) | 10mo | $134,900 | $119 | 62 |
| 704 E Egly Ave | 0.74mi | 2/2.0 (-1) | 1,170 (-0%) | 4mo | $99,500 | $85 | 56 |
| 310 W 2nd St | 0.45mi | 3/1.5 | 1,040 (-12%) | 6mo | $129,000 | $124 | 53 |
| 813 E Villegas Ave | 0.67mi | 3/2.0 | 1,275 (+8%) | 3mo | $195,000 | $153 | 52 |
| 109 E Sgt. Leonel Trevino Rd | 0.70mi | 3/2.0 | 1,193 (+1%) | 18mo | $189,000 | $158 | 50 |
| 609 Alameda St | 0.15mi | 2/1.0 (-1) | 1,040 (-12%) | 19mo | $80,000 | $77 | 49 |
| 811 E Villegas Ave | 0.67mi | 3/2.0 | 1,275 (+8%) | 8mo | $195,000 | $153 | 48 |
| 412 W Chaparral St | 0.30mi | 2/1.0 (-1) | 1,008 (-14%) | 8mo | $170,500 | $169 | 47 |
| 1207 E Alan St | 0.64mi | 3/2.0 | 1,299 (+10%) | 14mo | $210,000 | $162 | 41 |
| 205 San Diego Cir | 0.67mi | 3/1.0 | 1,008 (-14%) | 18mo | $130,000 | $129 | 26 |
Match score weights: distance 35% · size 25% · config 20% · recency 20%. Top-matched comps best support the ARV.
Projected returns pro-forma
-3.0% appreciation · 3.0% rent growth · sell at horizon
- IRR
- -11.7%
- Equity multiple
- 0.58×
- Total profit
- $-16,028
- Equity at exit
- $20,129
- IRR
- -2.5%
- Equity multiple
- 0.83×
- Total profit
- $-6,445
- Equity at exit
- $11,672
Cash invested: $37,800 (down + closing). Projections, not guarantees.
Landlord ↔ Tenant lean methodology
- Overall (STATE)
- 87 Strongly Landlord-Friendly
- State Texas
- 87 Strongly Landlord-Friendly · R+5
- County
- — inherits STATE
- City
- — inherits STATE
ZIP-level market 78589
- Home prices YoY
- -12.1%
- Active inventory
- 363
- Price-to-rent
- 9.0×
Monthly cashflow live
- Estimated rent
- $1,246 high interval (Pro) →
- Mortgage (P&I)
- −$708
- Tax from tax record
- −$128 /mo · $1,538/yr
- Insurance
- −$56
- HOA
- −$0
- Vacancy / Maint / Mgmt
- −$262
- Net cashflow
- $92
Break-even live
Sensitivity live
| Price | -10% $168 | -5% $130 | +0% $92 | +5% $54 | +10% $15 |
|---|---|---|---|---|---|
| Rent | -10% $-7 | -5% $43 | +0% $92 | +5% $141 | +10% $190 |
| Rate | -1.0pp $160 | -0.5pp $126 | base $92 | +0.5pp $57 | +1.0pp $21 |
UW: 25.0% down · 7.5% · 30yr · 1.5% tax · 5.0% vac · 8.0% maint · 8.0% mgmt
Financing live
Cash to close
- Down payment
- $33,750
- Closing costs
- $4,050
- Reserves months
- —
- Total cash needed
- —
Loan-product check · same deal, 3 products live
Conventional
25% down · 7.5% · 30yr
- Down + closing
- —
- Monthly P&I
- —
- Monthly cashflow
- —
- DSCR
- —
- Eligible?
- —
Personal DTI + credit; lowest rate.
DSCR
20% down · 8.5% · 30yr
- Down + closing
- —
- Monthly P&I
- —
- Monthly cashflow
- —
- DSCR
- —
- Eligible?
- —
No personal income docs; deal must DSCR.
Hard money
10% down · 12.0% · 12mo
- Down + closing
- —
- Monthly P&I
- —
- Monthly cashflow
- —
- DSCR
- —
- Eligible?
- —
Short-term bridge; refi at stabilization.
Rent comps 9 comps
| Address | Beds | Baths | Sqft | Rent | $/sqft | DOM | Units | Dist |
|---|---|---|---|---|---|---|---|---|
| 300 W Amy Dr Unit C San Juan, TX | 2.0 | 2.0 | 958 | $995 | $1.04 | 45d | 1 | 0.47mi |
| 103 E Segment Leonel Trevino Rd Unit C San Juan, TX | 2.0 | 2.0 | 962 | $1,075 | $1.12 | 45d | 1 | 0.63mi |
| 204 E Gomez Dr San Juan, TX | 3.0 | 1.5 | 1464 | $1,650 | $1.13 | 16d | 1 | 0.68mi |
| 808 E Evans Ave Pharr, TX | 3.0 | 2.0 | 1093 | $1,400 | $1.28 | 45d | 1 | 0.80mi |
| 234 W Jaime St San Juan, TX | 2.0 | 1.0 | 1012 | $1,150 | $1.14 | 25d | 1 | 1.01mi |
| 1109 Del Monte Dr San Juan, TX | 3.0 | 2.0 | 989 | $1,300 | $1.31 | 45d | 1 | 1.09mi |
| 518 E Kelly Ave Pharr, TX | 2.0 | 2.0 | 1482 | $1,300 | $0.88 | 45d | 1 | 1.17mi |
| 418 Chula Vista Dr San Juan, TX | 3.0 | 2.0 | 1382 | $1,600 | $1.16 | 45d | 1 | 1.30mi |
| 405 E Sam Houston Blvd Apt 15 Pharr, TX | 2.0 | 1.0 | 750 | $750 | $1.00 | 25d | 1 | 1.38mi |
Listing history 4 events
-
2026-05-02status Pending 1031-char remark
-
2026-04-23$135,000 Active 1031-char remark
-
2025-11-24$90,000 Active
-
2025-08-15soldstatus
ⓘ Source: listings_history table (triggers on properties + properties_extension) + one-shot
backfill from property_details.listing_events for pre-trigger history.
Tax reassessment forecast TX · Resets to sale price
- Current annual tax
- $1,538 · $128/mo
- Projected year-2 tax
- $2,470 · $206/mo
- Expected delta
- +$933/yr (+$78/mo · 60.7%)
ⓘ Screening estimate from a state-policy table — verify with the county assessor before closing.
Climate risk First Street
- Flood 6/10 Major 72% chance over 30 yrs
- Wildfire 2/10 Low
- Heat 9/10 Extreme 7 d/yr ≥111°F today · 23 d/yr by 30 yrs out
- Wind 8/10 Severe 99% chance of damaging wind over 30 yrs
- Air quality 3/10 Moderate 1 unhealthy d/yr today · 4 by 30 yrs out
Nearby sold comps map
Loading sold comps map…
Walkable amenities ~0.75 mi
Loading nearby amenities…
Taxation est. · year 1
- Rental income
- $14,951
- − Mortgage interest
- −$7,562
- − Property taxes
- −$1,538
- − Insurance
- −$675
- − Repairs & maintenance
- −$1,196
- − Management
- −$1,196
- − Depreciation
- −$3,927
- Taxable loss
- −$1,143
- Est. tax savings @ 24.0%
- +$274
- After-tax cash flow
- $1,377/yr
For passive investors: Depreciation is non-cash, so a rental often shows a tax loss while cash-flowing — sheltering income. Rental losses are passive: they offset passive income freely, and up to $25,000/yr can offset ordinary (W-2) income if you actively participate and your MAGI is under $100k (phasing out to $0 by $150k); unused losses carry forward. On sale, claimed depreciation is recaptured at up to 25%, and gains may owe capital-gains tax (a 1031 exchange can defer both). Figures are a year-1 estimate at your 24.0% rate — not tax advice; consult a CPA.
Schools (NCES district)
- District
- Pharr-San Juan-Alamo ISD
- NCES district ID
- 4834860
- Math proficiency
- 18% ▼ -34.00%
- Reading proficiency
- 30% ▼ -11.00%
- Median HH income
- $33,757
- Composite
- 19.63/100
- National rank
- #8744
- State rank
- #740 of 826 in TX
Livability — San Juan
- Score
- 71/100
- State rank
- #294
- US rank
- #6725
Category grades
Schools grade is shown separately in the Schools card above.
Census & demographics
- Census place
- San Juan, TX
- Population (ZIP)
- 39,958
Population outlook (Hidalgo County) Hauer SSP2
- Today (2025)
- 955,232 people
- By 2030
- 1,009,774 · +5.7%
- By 2040
- 1,120,332 · +17.3%
- By 2050
- 1,225,036 · +28.2%
- By 2075
- 1,439,189 · +50.7%
- By 2100
- 1,533,429 · +60.5%
Race, ethnicity, and origin ACS 2023
- Neighborhood character
- Predominantly Hispanic (97%)
- Race & ethnicity
- Hispanic / Latino 97% Two or more races 43% White 3%
- Hispanic origin (detail)
- Mexican 94%
- Foreign-born
- 26% · Canada
- Languages at home
- 18% English-only · Spanish 82%
Political lean MEDSL · Hidalgo
- 2024 margin
- Toss-up / Even · D 48.1% · R 51.0%
- 2008→2024 swing
- -41.6pp toward R · 2008: 38.7pp · 2024: -2.9pp
- All cycles
- 2024: R+2.9 2020: D+17.1 2016: D+40.5 2012: D+41.8 2008: D+38.7
Not yet ingested
- Civics
- —
Market trends
- HPI YoY
- ▼ -32.82%
- Current HPI
- 239.3829
- Rent YoY
- —
- Metro
- —
- State GDP YoY
- ▲ 3.95%
- F500 in state
- 110
Industry mix (Fortune 500 HQ in TX)
| Industry | F500 HQs | Revenue |
|---|---|---|
| Energy | 16 | $1,198B |
|
||
| Technology | 5 | $198B |
|
||
| Engineering / Construction | 4 | $72B |
|
||
| Energy Services | 3 | $60B |
|
||
| Utilities | 3 | $41B |
|
||
| Healthcare | 2 | $330B |
|
||
Price history
+50.0% since first listed4 events — show timeline
- 2026-05-02 Pending — MCALLENMLS
- 2026-04-23 Listed $135,000 MCALLENMLS
- 2025-11-24 Listed $90,000 MCALLENMLS
- 2025-08-15 Sold (Public Records) — Public Records
Property tax history
+4.9%/yrLatest (2025): $1,538 · +9.8% YoY. Source: county tax records.
Cash-flow waterfall
monthlySold comps — $/sqft
last 12 mo · ≤1 miLoading sold comps…