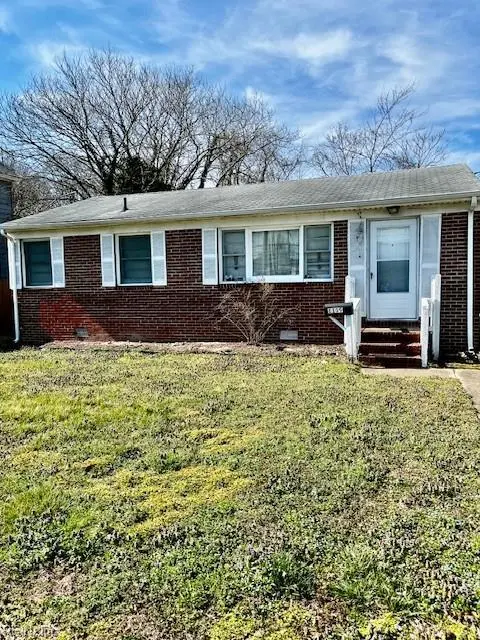
1119 N Mallory St · Hampton, VA
Flood risk 7/10 · Major
- FEMA flood zone
- X (unshaded)
- Chance of flooding over 30 yrs
- 0.96%
- Est. flood insurance / yr
- $473 – $860
Fire risk 1/10 · Minimal
- Est. fire insurance / yr
- $666 – $1,236
Heat risk 9/10 · Severe
- Hot days now (above 104°F)
- 7 days/yr
- Hot days in 30 yrs
- 16 days/yr
Wind risk 8/10 · Major
- Chance of severe wind over 30 yrs
- 80.0%
Air-quality risk 2/10 · Minimal
- Unhealthy air days now
- 2 days/yr
- Unhealthy air days in 30 yrs
- 2 days/yr
Risk factors via First Street. Map © Google.
Why this score? — see what drove the D grade
The composite is a weighted blend of 9 inputs, each scored 0–100. Each bar is that input's sub-score; the figure is the points it added to the 100-point composite (weight × sub-score).
- Cash flow +13.6/30.0
- ARV discount +8.7/15.0
- Schools +5.5/10.0
- DSCR +4.1/10.0
- Livability +3.8/5.0
- Rent growth +3.3/5.0
- 1% rule +3.2/10.0
- Condition / age +2.5/5.0
- Appreciation +0.0/10.0
$219,000
🖨 Deal sheet (PDF) 📄 Offer letter ✓ Due diligence
Listing remarks MLS
Prime opportunity for a starter . All brick 3 BR rancher with features including appliance pkg and washer / Dryer . Extended driveway and annex area for parking. Large utility room with washer and dryer.
Key facts
- Extended driveway
- Appliance pkg
- Large utility room
Tags
Neighborhood map
What this means for you Summary
Snapshot
- This is a 3-bed/1.0-bath single-family listed at $219k.
Deal economics
- At list price, monthly cash flow is $-45 ($-542/yr) — negative.
- To cash-flow at today's rent, offer at most $211k (3.6% below list).
- To meet the 1% rule (rent ≥ 1% of price), the offer needs to be $179k (18.5% below list).
- Recommended offer: $179k (18.5% below list) — sets the bar for 1% rule.
- Cap rate 6.3% vs local median 4.5% in Hampton — top-decile yield for the area; either an underpriced asset or a hidden risk that comps aren't pricing in. Stress-test before assuming the spread holds.
Location & tenants
- Location reads 75/100 on livability (#133 in VA, #4,302 nationally) — a middle-class / working-renter tenant base. Strengths: housing A+, health & safety A+, cost of living A; Watch: crime C-, amenities D+, commute F.
- Hampton City Public School District (urban): math 60% / reading 70% proficiency, ranked #40 of 131 in VA (top 30%) — acceptable for families but not a draw, mixed tenant base, ~2y average lease.
- Zoned schools: William Mason Cooper Elementary (math 62% / reading 82%, grade A-, #273 of 1,108 statewide, top 27%, 386 students, 89% FRL); Benjamin Syms Middle (math 62% / reading 64%, grade B+, #134 of 342 statewide, top 40%, 897 students, 69% FRL); Phoebus High (math 57% / reading 76%, grade B, #195 of 319 statewide, top 62%, 1,365 students, 86% FRL) — zoned schools average 81% FRL vs 49% district-wide (32 pts higher); higher-poverty schools than district average — tighter screening recommended.
- Market conditions: Rents rising (+3.1%/yr); 80 active listings in the ZIP; 19 comparable units currently listed for rent nearby; rentals at typical pace (median 17d on market — plan ~3-4 weeks tenant-placement turnaround); 68 units permitted in Hampton city in 2024 (0 in 5+ unit buildings).
- This rent runs 39% of the median local income ($54k/yr) — at the standard rent-burdened threshold; future hikes will face affordability resistance.
Forward outlook
- Local home prices are declining (-3.0%/yr); year-one equity from $2k of loan paydown is wiped out by about $7k of value loss. Plan a longer hold.
- Hampton County population projected at -13% by 2050 — secular population decline; favor cash flow + early exit over multi-decade hold.
Negotiation context
- It's been on market 101 days — a 9% lower offer ($199k) is reasonable based on typical stale-listing flexibility.
- Current owner paid $31k; list at $219k implies a 608% gain — meaningful room to come down on a strong offer.
Risks & watch-outs
- Watch-outs: flood insurance adds $56/mo.
- Climate carrying-cost: major flood risk; severe wind risk, 80% chance of damaging wind over 30y; extreme-heat days projected 7→16/yr by 2055 (HVAC capex compounding) — expect insurance premiums to compound above CPI over the hold.
Questions for the listing agent
- What do current leases actually rent for vs. the listed asking? Can we see a recent rent roll and the last 12 months of T-12 income?
- It's been on market 101 days. Have you received any prior offers? Is the seller open to a 18% concession, seller financing, or rate buy-down credit?
- Built in 1974 — when were the roof, HVAC, electrical panel, plumbing, and water heater last replaced?
- What's the actual annual flood-insurance premium (NFIP or private), and is the property in a SFHA with mandatory coverage?
- Why hasn't it sold? Are there any deal-killer items the seller is aware of (foundation, flood, title, zoning, code violations)?
- Is there a deadline driving the sale (1031 exchange, divorce, estate, relocation)? That informs how much negotiation room exists.
- Schools are B-rated — typically a magnet for longer-tenancy family renters. What's the average tenant stay here, and is there a school-zone premium baked into asking?
- The area grade is low — what's the realistic commute time and amenity access for the typical tenant pool here? Any planned neighborhood developments (good or bad) we should know about?
- What's the average days-on-market for RENTAL listings here right now (not sales)? A rising rental-DOM trend means longer vacancies and softer asking-rent achievability than the comps imply.
- What's the recent tenant-quality profile in this submarket — average credit score on applications, eviction rate, late-payment / NSF rate, and stable-employment percentage? A property-management company in the area should have these aggregated.
- How much new for-sale + rental construction is in the pipeline within 1–3 miles? Heavy new supply typically softens prices + rents 12–24 months out; constrained supply supports both.
Investment metrics
- 1% rule
- 0.82% ✗
- Cap rate
- 6.35%
- Cash-on-cash
- 0.20%
- DSCR
- 1.01
- GRM
- 10.2
CMA / ARV
- ARV (median comp)
- $224,950
- List price
- $219,000
- Delta
- -2.65%
- Verdict
- FAIR
- Comps
- 20 within 1.0 mi
Show comp detail 12 sales within ~0.75 mi
| Address | Dist | Beds/Ba | Sqft | Sold | Price | $/sf | Match |
|---|---|---|---|---|---|---|---|
| 6 Langille Ct | 0.38mi | 3/2.0 | 1,096 (-1%) | 2mo | $282,000 | $257 | 74 |
| 75 W Virginia Ave | 0.40mi | 3/1.0 | 1,025 (-8%) | 1mo | $140,000 | $137 | 68 |
| 704 Old Buckroe Rd | 0.30mi | 3/1.0 | 1,001 (-10%) | 3mo | $224,900 | $225 | 67 |
| 414 Institute Dr | 0.26mi | 3/1.5 | 1,000 (-10%) | 3mo | $225,000 | $225 | 67 |
| 213 Ireland St | 0.57mi | 3/2.0 | 1,110 (-0%) | 3mo | $280,000 | $252 | 67 |
| 401 Institute Dr | 0.18mi | 3/1.0 | 946 (-15%) | 2mo | $259,900 | $275 | 65 |
| 814 Old Point Ave | 0.49mi | 3/2.0 | 1,042 (-6%) | 4mo | $263,000 | $252 | 60 |
| 106 E Cummings Ave | 0.57mi | 3/2.0 | 1,170 (+5%) | 3mo | $270,000 | $231 | 58 |
| 7 Ambrose Ln | 0.56mi | 3/1.0 | 1,011 (-9%) | 1mo | $247,000 | $244 | 58 |
| 29 Scotland Rd | 0.38mi | 3/2.0 | 975 (-12%) | 1mo | $215,000 | $221 | 57 |
| 112 W Kelly Ave | 0.41mi | 3/1.0 | 947 (-15%) | 2mo | $205,000 | $216 | 54 |
| 1510 Denton Dr | 0.75mi | 3/2.0 | 1,051 (-6%) | 3mo | $263,000 | $250 | 50 |
Match score weights: distance 35% · size 25% · config 20% · recency 20%. Top-matched comps best support the ARV.
Projected returns pro-forma
-3.0% appreciation · 3.13% rent growth · sell at horizon
- IRR
- -17.6%
- Equity multiple
- 0.38×
- Total profit
- $-38,141
- Equity at exit
- $32,654
- IRR
- -9.5%
- Equity multiple
- 0.41×
- Total profit
- $-35,992
- Equity at exit
- $18,935
Cash invested: $61,320 (down + closing). Projections, not guarantees.
Landlord ↔ Tenant lean methodology
- Overall (STATE)
- 55 Moderately Landlord-Leaning
- State Virginia
- 55 Moderately Landlord-Leaning · D+2
- County
- — inherits STATE
- City
- — inherits STATE
ZIP-level market 23663
- Home prices YoY
- -4.3%
- Rents YoY
- 3.1%
- Active inventory
- 80
- Price-to-rent
- 10.2×
Monthly cashflow live
- Estimated rent
- $1,785 high interval (Pro) →
- Mortgage (P&I)
- −$1,148
- Tax from tax record
- −$160 /mo · $1,923/yr
- Insurance
- −$91
- Flood insurance flood zone
- −$56 /mo · $666/yr
- HOA
- −$0
- Vacancy / Maint / Mgmt
- −$375
- Net cashflow
- $-45
Break-even live
Sensitivity live
| Price | -10% $79 | -5% $17 | +0% $-45 | +5% $-107 | +10% $-169 |
|---|---|---|---|---|---|
| Rent | -10% $-186 | -5% $-116 | +0% $-45 | +5% $25 | +10% $96 |
| Rate | -1.0pp $65 | -0.5pp $11 | base $-45 | +0.5pp $-102 | +1.0pp $-160 |
UW: 25.0% down · 7.5% · 30yr · 1.5% tax · 5.0% vac · 8.0% maint · 8.0% mgmt
Financing live
Cash to close
- Down payment
- $54,750
- Closing costs
- $6,570
- Reserves months
- —
- Total cash needed
- —
Loan-product check · same deal, 3 products live
Conventional
25% down · 7.5% · 30yr
- Down + closing
- —
- Monthly P&I
- —
- Monthly cashflow
- —
- DSCR
- —
- Eligible?
- —
Personal DTI + credit; lowest rate.
DSCR
20% down · 8.5% · 30yr
- Down + closing
- —
- Monthly P&I
- —
- Monthly cashflow
- —
- DSCR
- —
- Eligible?
- —
No personal income docs; deal must DSCR.
Hard money
10% down · 12.0% · 12mo
- Down + closing
- —
- Monthly P&I
- —
- Monthly cashflow
- —
- DSCR
- —
- Eligible?
- —
Short-term bridge; refi at stabilization.
Rent comps 19 comps
| Address | Beds | Baths | Sqft | Rent | $/sqft | DOM | Units | Dist |
|---|---|---|---|---|---|---|---|---|
| 949 N Mallory St Hampton, VA | 2.0 | 1.5 | 1054 | $1,250 | $1.19 | 0d | 1 | 0.13mi |
| 1210 Pansy St Hampton, VA | 2.0 | 2.0 | 1409 | $2,000 | $1.42 | 45d | 1 | 0.18mi |
| 221 W Kelly Ave Hampton, VA | 3.0 | 1.0 | 1200 | $2,350 | $1.96 | 45d | 1 | 0.47mi |
| 4 Bainbridge Ave Unit B Hampton, VA | 2.0 | 1.5 | 1050 | $1,550 | $1.48 | 45d | 1 | 0.83mi |
| 25 Bainbridge Ave Hampton, VA | 2.0 | 1.5 | 1306 | $1,600 | $1.23 | 0d | 1 | 0.86mi |
| 2010 E Pembroke Ave Hampton, VA | 2.0 | 1.0 | 900 | $1,150 | $1.28 | 6d | 1 | 0.97mi |
| 1115 E Pembroke Ave Hampton, VA | 2.0 | 1.0 | 850 | $1,275 | $1.50 | 0d | 1 | 1.01mi |
| 1665 N Mallory St Hampton, VA | 2.0 | 1.0 | 1250 | $1,785 | $1.43 | 45d | 1 | 1.04mi |
| 229 Atlantic Ave Hampton, VA | 2.0 | 1.0 | 1170 | $1,600 | $1.37 | 14d | 1 | 1.10mi |
| 1802 Moger Dr Hampton, VA | 3.0 | 1.0 | 900 | $1,700 | $1.89 | 14d | 1 | 1.13mi |
| 305 Old Point Ave Hampton, VA | 3.0 | 1.0 | 1186 | $1,750 | $1.48 | 45d | 1 | 1.13mi |
| 150 Ingalls Rd Unit 204 Fort Monroe, VA | 2.0 | 1.0 | 872 | $2,060 | $2.36 | 19d | 1 | 1.23mi |
| 19 Magnolia Pl Hampton, VA | 3.0 | 1.5 | 1405 | $2,100 | $1.49 | 16d | 1 | 1.26mi |
| 1805 Nickerson Blvd Hampton, VA | 3.0 | 1.5 | 1393 | $1,695 | $1.22 | 45d | 1 | 1.27mi |
| 216 S 2nd St Hampton, VA | 2.0 | 2.0 | 1429 | $2,295 | $1.61 | 0d | 1 | 1.33mi |
| 2304 Burnette Dr Hampton, VA | 4.0 | 2.0 | 1322 | $2,100 | $1.59 | 16d | 1 | 1.40mi |
| 2000 Neville Cir Hampton, VA | 3.0 | 1.0 | 1100 | $1,750 | $1.59 | 45d | 1 | 1.41mi |
| 2001 Neville Cir Hampton, VA | 4.0 | 1.0 | 1320 | $1,800 | $1.36 | 0d | 1 | 1.42mi |
| 2001 Grimes Rd Hampton, VA | 4.0 | 2.0 | 1430 | $2,100 | $1.47 | 5d | 1 | 1.48mi |
Listing history 18 events
-
2026-06-21days on market $219,000 Active 101 DOM
-
2026-06-18days on market $219,000 Active 98 DOM
-
2026-06-17days on market $219,000 Active 97 DOM
-
2026-06-16days on market $219,000 Active 96 DOM
-
2026-06-15days on market $219,000 Active 95 DOM
-
2026-06-13days on market $219,000 Active 93 DOM
-
2026-06-13days on market $219,000 Active 92 DOM
-
2026-06-09days on market $219,000 Active 89 DOM
-
2026-06-08days on market $219,000 Active 88 DOM
-
2026-06-07days on market $219,000 Active 87 DOM
-
2026-06-03days on market $219,000 Active 83 DOM
-
2026-06-02days on market $219,000 Active 82 DOM
-
2026-06-01days on market $219,000 Active 81 DOM
-
2026-05-31days on market $219,000 Active 80 DOM
-
2026-04-07price $219,000 203-char remark
Show marketing remark (203 chars)
Prime opportunity for a starter . All brick 3 BR rancher with features including appliance pkg and washer / Dryer . Extended driveway and annex area for parking. Large utility room with washer and dryer.
-
2026-03-12$225,000 Active 203-char remark
Show marketing remark (203 chars)
Prime opportunity for a starter . All brick 3 BR rancher with features including appliance pkg and washer / Dryer . Extended driveway and annex area for parking. Large utility room with washer and dryer.
-
1978-10-01soldstatus $30,950
-
1974-11-01soldstatus $23,950
ⓘ Source: listings_history table (triggers on properties + properties_extension) + one-shot
backfill from property_details.listing_events for pre-trigger history.
Tax reassessment forecast VA · Resets to sale price
- Current annual tax
- $1,923 · $160/mo
- Projected year-2 tax
- $1,923 · $160/mo
- Expected delta
- $0/yr ($0/mo · 0.0%)
ⓘ Screening estimate from a state-policy table — verify with the county assessor before closing.
Climate risk First Street
- Flood 7/10 Severe FEMA zone X (unshaded) · 96% chance over 30 yrs
- Wildfire 1/10 Low
- Heat 9/10 Extreme 7 d/yr ≥104°F today · 16 d/yr by 30 yrs out
- Wind 8/10 Severe 80% chance of damaging wind over 30 yrs
- Air quality 2/10 Low 2 unhealthy d/yr today · 2 by 30 yrs out
Nearby sold comps map
Loading sold comps map…
Walkable amenities ~0.75 mi
Loading nearby amenities…
Taxation est. · year 1
- Rental income
- $21,423
- − Mortgage interest
- −$12,267
- − Property taxes
- −$1,923
- − Insurance
- −$1,762
- − Repairs & maintenance
- −$1,714
- − Management
- −$1,714
- − Depreciation
- −$6,371
- Taxable loss
- −$4,328
- Est. tax savings @ 24.0%
- +$1,039
- After-tax cash flow
- $496/yr
For passive investors: Depreciation is non-cash, so a rental often shows a tax loss while cash-flowing — sheltering income. Rental losses are passive: they offset passive income freely, and up to $25,000/yr can offset ordinary (W-2) income if you actively participate and your MAGI is under $100k (phasing out to $0 by $150k); unused losses carry forward. On sale, claimed depreciation is recaptured at up to 25%, and gains may owe capital-gains tax (a 1031 exchange can defer both). Figures are a year-1 estimate at your 24.0% rate — not tax advice; consult a CPA.
Schools (NCES district)
- District
- Hampton City Public School District
- NCES district ID
- 5101800
- Math proficiency
- 60% ▼ -21.00%
- Reading proficiency
- 70% ▼ -4.00%
- Median HH income
- $50,089
- Composite
- 55.19/100
- National rank
- #1272
- State rank
- #40 of 131 in VA
Livability — Hampton
- Score
- 75/100
- State rank
- #133
- US rank
- #4302
Category grades
Schools grade is shown separately in the Schools card above.
Census & demographics
- Census place
- Hampton, VA
- County
- Hampton City · 132,421 people
- City population
- 132,421
- Metro
- Virginia Beach-Norfolk-Newport News, VA-NC
- Population (ZIP)
- 14,656
- Household income
- $54,336
- Rent vs Own
- Severe rent burden
- 803.0
Population outlook (Hampton County) Hauer SSP2
- Today (2025)
- 134,055 people
- By 2030
- 131,753 · -1.7%
- By 2040
- 125,017 · -6.7%
- By 2050
- 116,825 · -12.9%
- By 2075
- 97,033 · -27.6%
- By 2100
- 76,188 · -43.2%
Race, ethnicity, and origin ACS 2023
- Neighborhood character
- Diverse neighborhood (Simpson 0.63)
- Race & ethnicity
- Black 48% White 37% Two or more races 11% Hispanic / Latino 5%
- Common ancestry
- Romanian 1% Serbian 1% Lithuanian 1%
- Foreign-born
- 3% · Canada
- Languages at home
- 95% English-only · Spanish 3%
Political lean MEDSL · Hampton
- 2024 margin
- Solid D (+39.9) · D 69.2% · R 29.4% · Other 1.4%
- 2008→2024 swing
- +1.0pp no change · 2008: 38.9pp · 2024: 39.9pp
- All cycles
- 2024: D+39.9 2020: D+42.2 2016: D+37.8 2012: D+45.4 2008: D+38.9
Not yet ingested
- Civics
- —
Market trends
- HPI YoY
- ▼ -14.71%
- Current HPI
- 328.8386
- Rent YoY
- ▲ 3.13%
- Metro
- Virginia Beach-Norfolk-Newport News, VA-NC
- State GDP YoY
- ▲ 2.40%
- F500 in state
- 50
Industry mix (Fortune 500 HQ in VA)
| Industry | F500 HQs | Revenue |
|---|---|---|
| Aerospace / Defense | 4 | $236B |
|
||
| Technology / Defense | 3 | $32B |
|
||
| Financial Services | 2 | $176B |
|
||
| Utilities | 2 | $27B |
|
||
| Insurance | 2 | $25B |
|
||
| Technology | 2 | $15B |
|
||
Price history
+814.4% since first listed4 events — show timeline
- 2026-04-07 Price Changed $219,000 REINMLS
- 2026-03-12 Listed $225,000 REINMLS
- 1978-10-01 Sold (Public Records) $30,950 Public Records
- 1974-11-01 Sold (Public Records) $23,950 Public Records
Property tax history
+9.7%/yrLatest (2025): $1,923 · -0.9% YoY. Source: county tax records.
Cash-flow waterfall
monthlySold comps — $/sqft
last 12 mo · ≤1 miLoading sold comps…