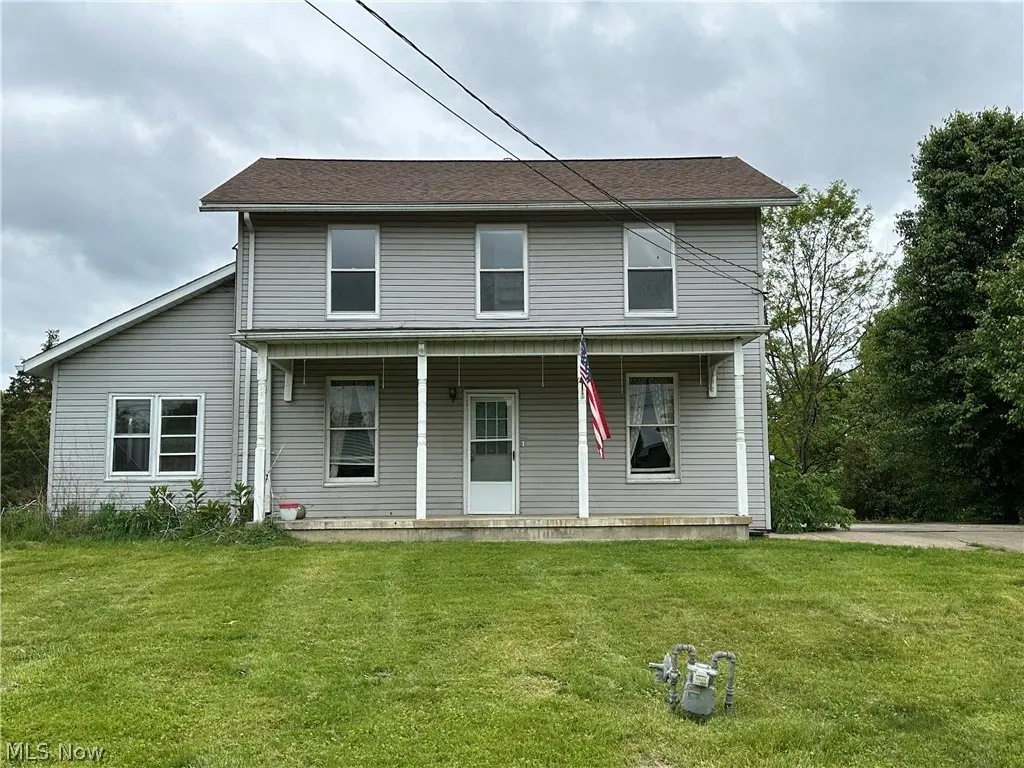
102 Summerset Dr · Reno, OH
Flood risk 5/10 · Moderate
- FEMA flood zone
- X (unshaded)
- Chance of flooding over 30 yrs
- 0.27%
- Est. flood insurance / yr
- $473 – $860
Fire risk 1/10 · Minimal
- Est. fire insurance / yr
- $713 – $1,323
Heat risk 5/10 · Moderate
- Hot days now (above 99°F)
- 7 days/yr
- Hot days in 30 yrs
- 19 days/yr
Wind risk 2/10 · Minimal
- Chance of severe wind over 30 yrs
- 1.0%
Air-quality risk 2/10 · Minimal
- Unhealthy air days now
- 1 days/yr
- Unhealthy air days in 30 yrs
- 2 days/yr
Risk factors via First Street. Map © Google.
Why this score? — see what drove the B- grade
The composite is a weighted blend of 9 inputs, each scored 0–100. Each bar is that input's sub-score; the figure is the points it added to the 100-point composite (weight × sub-score).
- Cash flow +30.0/30.0
- 1% rule +10.0/10.0
- DSCR +10.0/10.0
- ARV discount +7.5/15.0
- Schools +3.5/10.0
- Livability +3.2/5.0
- Rent growth +2.5/5.0
- Condition / age +2.5/5.0
- Appreciation +0.0/10.0
$95,000
🖨 Deal sheet 📄 Offer letter ✓ Due diligence
Listing remarks
A true fixer-upper in a great neighborhood. Decent sized rooms, roof is approx. 3 years old. DO NOT WALK ON DECK!
Key facts
- 0.3 acre lot
- Built 1900
- Listed 36 days
Property features AI
Exterior
- Parking: Off-street parking
- Utilities: Public water; Public sewer
- Home design: Two-story home; Fixer condition
- Construction: Vinyl siding; Asbestos shingle roof; Stone foundation; Built according to public records
- Exterior features: Front porch; Cul-de-sac lot
Interior
- Bathrooms: Two full bathrooms; One main-level bathroom
- Heating & cooling: Central air conditioning; Forced air heating (gas)
- Interior features: Full unfinished basement; One fireplace
Neighborhood map
What this means for you Summary
Snapshot
- This is a 3-bed/2.0-bath single-family listed at $95k.
Deal economics
- At list price, monthly cash flow is $719 ($9k/yr) — positive.
- The deal already cash-flows at list — no discount required.
- Meets the 1% rule at list price ($2k rent vs $95k).
- Recommended offer: $92k (3.0% below list) — sets the bar for market timing.
Location & tenants
- Location reads 63/100 on livability (#812 in OH) — a middle-class / working-renter tenant base. Strengths: crime A+, cost of living A+, housing B; Watch: schools D+, health & safety D, amenities F.
- Marietta City (town): math 35% / reading 49% proficiency, ranked #534 of 656 in OH (top 81%) — families likely to look elsewhere, expect single-tenant / working-renter base with shorter leases.
- Market conditions: 118 active listings in the ZIP; 3 units permitted in Washington County in 2024 (0 in 5+ unit buildings).
- This rent runs 34% of the median local income ($60k/yr) — at the standard rent-burdened threshold; future hikes will face affordability resistance.
Forward outlook
- Local home prices are declining (-3.0%/yr); year-one equity from $657 of loan paydown is wiped out by about $3k of value loss. Plan a longer hold.
- Washington County population projected at -12% by 2050 — secular population decline; favor cash flow + early exit over multi-decade hold.
- At projected returns (-3.0% appreciation + 3.0% rent growth), your $27k cash investment doubles in ~4 years — after that, you're playing with house money.
Negotiation context
- It's been on market 37 days — a 3% lower offer ($92k) is reasonable based on typical stale-listing flexibility.
Risks & watch-outs
- Watch-outs: built in 1900 — expect roof / HVAC / electrical / plumbing capex.
- Climate carrying-cost: moderate flood risk; extreme-heat days projected 7→19/yr by 2055 (HVAC capex compounding) — expect insurance premiums to compound above CPI over the hold.
Questions for the listing agent
- It's been on market 37 days. Have you received any prior offers? Is the seller open to a 3% concession, seller financing, or rate buy-down credit?
- Built in 1900 — when were the roof, HVAC, electrical panel, plumbing, and water heater last replaced?
- Is there a deadline driving the sale (1031 exchange, divorce, estate, relocation)? That informs how much negotiation room exists.
- Schools are D-rated, which usually means shorter tenancies and higher turnover. Who's the typical renter profile here, and what's been the actual vacancy rate?
- What's the average days-on-market for RENTAL listings here right now (not sales)? A rising rental-DOM trend means longer vacancies and softer asking-rent achievability than the comps imply.
- What's the recent tenant-quality profile in this submarket — average credit score on applications, eviction rate, late-payment / NSF rate, and stable-employment percentage? A property-management company in the area should have these aggregated.
- How much new for-sale + rental construction is in the pipeline within 1–3 miles? Heavy new supply typically softens prices + rents 12–24 months out; constrained supply supports both.
Investment metrics
- 1% rule
- 1.81% ✓
- Cap rate
- 15.38%
- Cash-on-cash
- 32.46%
- DSCR
- 2.44
- GRM
- 4.6
CMA / ARV
- ARV (median comp)
- $285,235
- List price
- $95,000
- Delta
- -66.69%
- Verdict
- UNDERPRICED
- Comps
- 20 within 1.0 mi
Show comp detail 1 sale within ~0.75 mi
| Address | Dist | Beds/Ba | Sqft | Sold | Price | $/sf | Match |
|---|---|---|---|---|---|---|---|
| 1585 County Road 9 | 0.35mi | 3/2.0 | 1,974 (+12%) | 0mo | $375,000 | $190 | 63 |
Match score weights: distance 35% · size 25% · config 20% · recency 20%. Top-matched comps best support the ARV.
Projected returns pro-forma
-3.0% appreciation · 3.0% rent growth · sell at horizon
- IRR
- 27.5%
- Equity multiple
- 2.14×
- Total profit
- $30,448
- Equity at exit
- $14,165
- IRR
- 35.1%
- Equity multiple
- 4.22×
- Total profit
- $85,591
- Equity at exit
- $8,214
Cash invested: $26,600 (down + closing). Projections, not guarantees.
Landlord ↔ Tenant lean methodology
- Overall (STATE)
- 73 Landlord-Friendly
- State Ohio
- 73 Landlord-Friendly · R+6
- County
- — inherits STATE
- City
- — inherits STATE
ZIP-level market 45750
- Home prices YoY
- -32.4%
- Active inventory
- 118
- Price-to-rent
- 4.6×
Monthly cashflow live
- Estimated rent
- $1,724 medium interval (Pro) →
- Mortgage (P&I)
- −$498
- Tax from tax record
- −$104 /mo · $1,252/yr
- Insurance
- −$40
- HOA
- −$0
- Vacancy / Maint / Mgmt
- −$362
- Net cashflow
- $719
Break-even live
UW: 25.0% down · 7.5% · 30yr · 1.5% tax · 5.0% vac · 8.0% maint · 8.0% mgmt
Financing live
Cash to close
- Down payment
- $23,750
- Closing costs
- $2,850
- Reserves months
- —
- Total cash needed
- —
Loan-product check · same deal, 3 products live
Conventional
25% down · 7.5% · 30yr
- Down + closing
- —
- Monthly P&I
- —
- Monthly cashflow
- —
- DSCR
- —
- Eligible?
- —
Personal DTI + credit; lowest rate.
DSCR
20% down · 8.5% · 30yr
- Down + closing
- —
- Monthly P&I
- —
- Monthly cashflow
- —
- DSCR
- —
- Eligible?
- —
No personal income docs; deal must DSCR.
Hard money
10% down · 12.0% · 12mo
- Down + closing
- —
- Monthly P&I
- —
- Monthly cashflow
- —
- DSCR
- —
- Eligible?
- —
Short-term bridge; refi at stabilization.
Listing history 18 events
-
2026-06-19days on market $95,000 Active 37 DOM
-
2026-06-18days on market $95,000 Active 36 DOM
-
2026-06-17days on market $95,000 Active 35 DOM
-
2026-06-16days on market $95,000 Active 34 DOM
-
2026-06-15days on market $95,000 Active 33 DOM
-
2026-06-14days on market $95,000 Active 31 DOM
-
2026-06-12days on market $95,000 Active 30 DOM
-
2026-06-09days on market $95,000 Active 27 DOM
-
2026-06-09price $95,000 Active 26 DOM
-
2026-06-08days on market $112,000 Active 26 DOM
-
2026-06-07days on market $112,000 Active 25 DOM
-
2026-06-07days on market $112,000 Active 24 DOM
-
2026-06-03days on market $112,000 Active 21 DOM
-
2026-06-02days on market $112,000 Active 20 DOM
-
2026-06-01days on market $112,000 Active 19 DOM
-
2026-05-31days on market $112,000 Active 18 DOM
-
2026-05-30days on market $112,000 Active 17 DOM
-
2026-05-12$112,000 Active 113-char remark
ⓘ Source: listings_history table (triggers on properties + properties_extension) + one-shot
backfill from property_details.listing_events for pre-trigger history.
Tax reassessment forecast OH · Partial reset (capped growth)
- Current annual tax
- $1,252 · $104/mo
- Projected year-2 tax
- $1,367 · $114/mo
- Expected delta
- +$115/yr (+$10/mo · 9.2%)
ⓘ Screening estimate from a state-policy table — verify with the county assessor before closing.
Climate risk First Street
- Flood 5/10 Major FEMA zone X (unshaded) · 27% chance over 30 yrs
- Wildfire 1/10 Low
- Heat 5/10 Major 7 d/yr ≥99°F today · 19 d/yr by 30 yrs out
- Wind 2/10 Low 100% chance of damaging wind over 30 yrs
- Air quality 2/10 Low 1 unhealthy d/yr today · 2 by 30 yrs out
Nearby sold comps map
Loading sold comps map…
Walkable amenities ~0.75 mi
Loading nearby amenities…
Taxation est. · year 1
- Rental income
- $20,682
- − Mortgage interest
- −$5,321
- − Property taxes
- −$1,252
- − Insurance
- −$475
- − Repairs & maintenance
- −$1,655
- − Management
- −$1,655
- − Depreciation
- −$2,764
- Taxable income
- $7,561
- Est. tax owed @ 24.0%
- −$1,815
- After-tax cash flow
- $6,819/yr
For passive investors: Depreciation is non-cash, so a rental often shows a tax loss while cash-flowing — sheltering income. Rental losses are passive: they offset passive income freely, and up to $25,000/yr can offset ordinary (W-2) income if you actively participate and your MAGI is under $100k (phasing out to $0 by $150k); unused losses carry forward. On sale, claimed depreciation is recaptured at up to 25%, and gains may owe capital-gains tax (a 1031 exchange can defer both). Figures are a year-1 estimate at your 24.0% rate — not tax advice; consult a CPA.
Schools (NCES district)
- District
- Marietta City
- NCES district ID
- 3910019
- Math proficiency
- 35% ▼ -20.00%
- Reading proficiency
- 49% ▼ -12.00%
- Median HH income
- $39,366
- Composite
- 35.08/100
- National rank
- #5025
- State rank
- #534 of 656 in OH
Livability — Reno
- Score
- 63/100
- State rank
- #812
- US rank
- #15078
Category grades
Schools grade is shown separately in the Schools card above.
Census & demographics
- County
- Washington County · 26,420 people
- Metro
- Marietta, OH
- Population (ZIP)
- 26,420
- Household income
- $60,229
- Rent vs Own
- Severe rent burden
- 727.0
Population outlook (Washington County) Hauer SSP2
- Today (2025)
- 59,640 people
- By 2030
- 58,315 · -2.2%
- By 2040
- 55,186 · -7.5%
- By 2050
- 52,246 · -12.4%
- By 2075
- 45,893 · -23.0%
- By 2100
- 38,128 · -36.1%
Race, ethnicity, and origin ACS 2023
- Neighborhood character
- Predominantly White (94%)
- Race & ethnicity
- White 94% Two or more races 2% Asian 1% Black 1% Hispanic / Latino 1%
- Common ancestry
- Italian 2% Slovak 2% Romanian 2%
- Foreign-born
- 2% · Canada
- Languages at home
- 97% English-only · Tagalog/Filipino 1% Other Indo-European 1%
Political lean MEDSL · Washington
- 2024 margin
- Solid R (+43.8) · D 27.7% · R 71.5%
- 2008→2024 swing
- +40.2pp toward D · 2008: -83.9pp · 2024: -43.8pp
- All cycles
- 2024: R+43.8 2020: R+40.8 2016: R+41.6 2012: R+19.4 2008: R+83.9
Not yet ingested
- Civics
- —
Market trends
- HPI YoY
- ▼ -95.06%
- Current HPI
- 198.6235
- Rent YoY
- —
- Metro
- Marietta, OH
- State GDP YoY
- ▲ 1.98%
- F500 in state
- 48
Industry mix (Fortune 500 HQ in OH)
| Industry | F500 HQs | Revenue |
|---|---|---|
| Insurance | 3 | $145B |
|
||
| Industrial Machinery | 3 | $49B |
|
||
| Financial Services | 3 | $24B |
|
||
| Consumer Goods | 2 | $93B |
|
||
| Aerospace / Defense | 2 | $47B |
|
||
| Utilities | 2 | $33B |
|
||
Price history
-15.2% since first listed2 events — show timeline
- 2026-06-08 Price Changed $95,000 MLSNOW
- 2026-05-12 Listed $112,000 MLSNOW
Property tax history
+3.2%/yrLatest (2025): $1,252 · +36.4% YoY. Source: county tax records.
Cash-flow waterfall
monthlySold comps — $/sqft
last 12 mo · ≤1 miLoading sold comps…