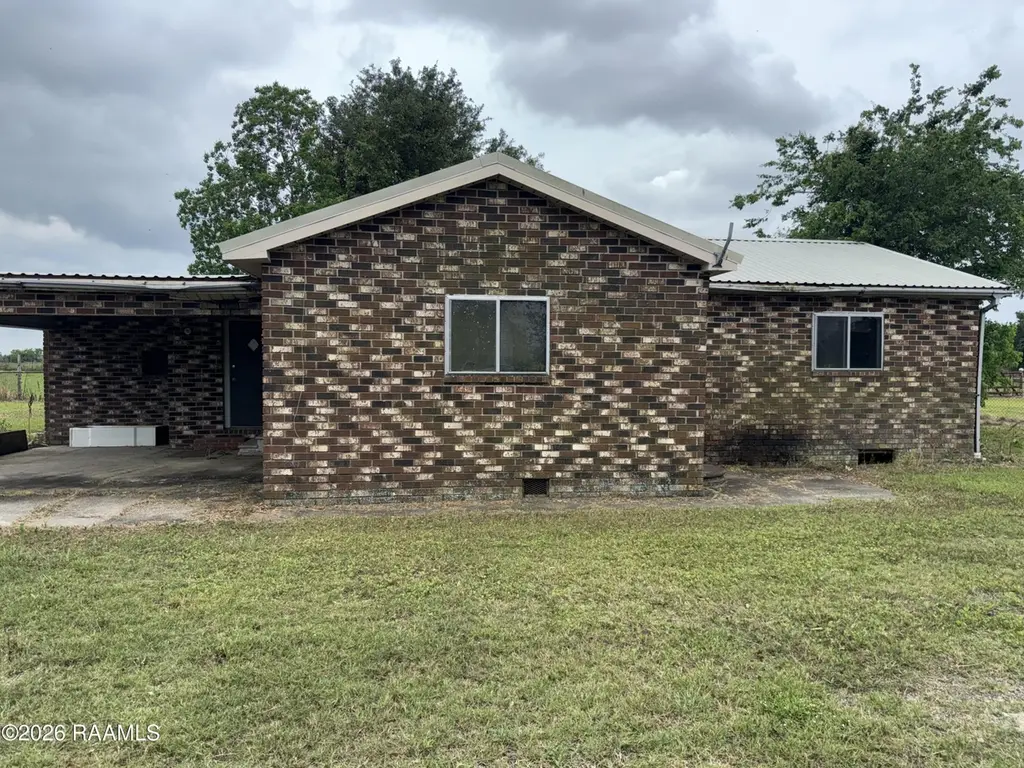
9309 Bourque Rd · Lake Arthur, LA
Flood risk No data
- FEMA flood zone
- —
- Chance of flooding over 30 yrs
- —
- Est. flood insurance / yr
- —
Fire risk No data
- Est. fire insurance / yr
- —
Heat risk No data
- Hot days now (above threshold)
- —
- Hot days in 30 yrs
- —
Wind risk No data
- Chance of severe wind over 30 yrs
- —
Air-quality risk No data
- Unhealthy air days now
- —
- Unhealthy air days in 30 yrs
- —
Risk factors via First Street. Map © Google.
Why this score? — see what drove the B+ grade
The composite is a weighted blend of 9 inputs, each scored 0–100. Each bar is that input's sub-score; the figure is the points it added to the 100-point composite (weight × sub-score).
- Cash flow +30.0/30.0
- ARV discount +15.0/15.0
- 1% rule +10.0/10.0
- DSCR +10.0/10.0
- Schools +3.9/10.0
- Livability +3.4/5.0
- Rent growth +2.5/5.0
- Condition / age +2.5/5.0
- Appreciation +0.0/10.0
$62,000
🖨 Deal sheet 📄 Offer letter ✓ Due diligence
Listing remarks
Investor Special / Camp Opportunity! Property is being sold as-is and is ideal for investors, renovators, or buyers looking for a fixer-upper with potential. Great opportunity for a camp, weekend retreat, or renovation project.
Key facts
- 3.1 acre lot
- Parking
- Built 1945
Property features AI
Exterior
- Parking: Carport (1 covered space)
- Utilities: City electric
- Home design: Single-family residence; Fixer condition
- Construction: Brick veneer and frame construction; Metal roof
- Exterior features: Chain link fencing; City street frontage
Interior
- Flooring: Wood
- Bathrooms: 2 full bathrooms
- Heating & cooling: Central air conditioning; Natural gas heating
- Interior features: Formica counters; Wood flooring
Neighborhood map
What this means for you Summary
Snapshot
- This is a 3-bed/2.0-bath single-family listed at $62k.
Deal economics
- At list price, monthly cash flow is $413 ($5k/yr) — positive.
- The deal already cash-flows at list — no discount required.
- Meets the 1% rule at list price ($1k rent vs $62k).
- Recommended offer: $60k (3.0% below list) — sets the bar for market timing.
Location & tenants
- Location reads 68/100 on livability (#99 in LA) — a middle-class / working-renter tenant base. Strengths: crime A+, cost of living A+, housing A+; Watch: amenities F, commute F, employment F.
- Vermilion Parish (town): math 40% / reading 53% proficiency, ranked #15 of 98 in LA (top 15%) — families likely to look elsewhere, expect single-tenant / working-renter base with shorter leases.
- Zoned schools: Jesse Owens Elementary School (math 37% / reading 52%, grade F, #176 of 646 statewide, top 29%, 203 students, 70% FRL); Gueydan High School (math 27% / reading 37%, grade F, #118 of 265 statewide, top 46%, 238 students, 62% FRL).
- Market conditions: 25 active listings in the ZIP; 228 units permitted in Vermilion Parish in 2024 (0 in 5+ unit buildings).
Forward outlook
- Local home prices are declining (-3.0%/yr); year-one equity from $429 of loan paydown is wiped out by about $2k of value loss. Plan a longer hold.
- Vermilion County population projected at +10% by 2050 — modest demand growth; plan on rents tracking national, not racing it.
- At projected returns (-3.0% appreciation + 3.0% rent growth), your $17k cash investment doubles in ~5 years — after that, you're playing with house money.
Negotiation context
- It's been on market 43 days — a 3% lower offer ($60k) is reasonable based on typical stale-listing flexibility.
Risks & watch-outs
- Watch-outs: built in 1945 — expect roof / HVAC / electrical / plumbing capex.
Questions for the listing agent
- It's been on market 43 days. Have you received any prior offers? Is the seller open to a 3% concession, seller financing, or rate buy-down credit?
- Built in 1945 — when were the roof, HVAC, electrical panel, plumbing, and water heater last replaced?
- Is there a deadline driving the sale (1031 exchange, divorce, estate, relocation)? That informs how much negotiation room exists.
- Schools are B-rated — typically a magnet for longer-tenancy family renters. What's the average tenant stay here, and is there a school-zone premium baked into asking?
- What's the average days-on-market for RENTAL listings here right now (not sales)? A rising rental-DOM trend means longer vacancies and softer asking-rent achievability than the comps imply.
- What's the recent tenant-quality profile in this submarket — average credit score on applications, eviction rate, late-payment / NSF rate, and stable-employment percentage? A property-management company in the area should have these aggregated.
- How much new for-sale + rental construction is in the pipeline within 1–3 miles? Heavy new supply typically softens prices + rents 12–24 months out; constrained supply supports both.
Investment metrics
- 1% rule
- 1.72% ✓
- Cap rate
- 14.30%
- Cash-on-cash
- 28.58%
- DSCR
- 2.27
- GRM
- 4.8
CMA / ARV
- ARV (median comp)
- $89,900
- List price
- $62,000
- Delta
- -31.03%
- Verdict
- UNDERPRICED
- Comps
- 1 within 2.0 mi
Projected returns pro-forma
-3.0% appreciation · 3.0% rent growth · sell at horizon
- IRR
- 22.9%
- Equity multiple
- 1.94×
- Total profit
- $16,306
- Equity at exit
- $9,244
- IRR
- 30.9%
- Equity multiple
- 3.78×
- Total profit
- $48,181
- Equity at exit
- $5,361
Cash invested: $17,360 (down + closing). Projections, not guarantees.
Landlord ↔ Tenant lean methodology
- Overall (STATE)
- 90 Strongly Landlord-Friendly
- State Louisiana
- 90 Strongly Landlord-Friendly · R+12
- County
- — inherits STATE
- City
- — inherits STATE
ZIP-level market 70542
- Home prices YoY
- -33.8%
- Active inventory
- 25
- Price-to-rent
- 4.8×
Monthly cashflow live
- Estimated rent
- $1,069 medium interval (Pro) →
- Mortgage (P&I)
- −$325
- Tax from tax record
- −$80 /mo · $963/yr
- Insurance
- −$26
- HOA
- −$0
- Vacancy / Maint / Mgmt
- −$225
- Net cashflow
- $413
Break-even live
UW: 25.0% down · 7.5% · 30yr · 1.5% tax · 5.0% vac · 8.0% maint · 8.0% mgmt
Financing live
Cash to close
- Down payment
- $15,500
- Closing costs
- $1,860
- Reserves months
- —
- Total cash needed
- —
Loan-product check · same deal, 3 products live
Conventional
25% down · 7.5% · 30yr
- Down + closing
- —
- Monthly P&I
- —
- Monthly cashflow
- —
- DSCR
- —
- Eligible?
- —
Personal DTI + credit; lowest rate.
DSCR
20% down · 8.5% · 30yr
- Down + closing
- —
- Monthly P&I
- —
- Monthly cashflow
- —
- DSCR
- —
- Eligible?
- —
No personal income docs; deal must DSCR.
Hard money
10% down · 12.0% · 12mo
- Down + closing
- —
- Monthly P&I
- —
- Monthly cashflow
- —
- DSCR
- —
- Eligible?
- —
Short-term bridge; refi at stabilization.
Listing history 16 events
-
2026-06-18days on market $62,000 Active 43 DOM
-
2026-06-17days on market $62,000 Active 42 DOM
-
2026-06-16days on market $62,000 Active 41 DOM
-
2026-06-15days on market $62,000 Active 40 DOM
-
2026-06-14days on market $62,000 Active 38 DOM
-
2026-06-13days on market $62,000 Active 37 DOM
-
2026-06-10days on market $62,000 Active 35 DOM
-
2026-06-09days on market $62,000 Active 34 DOM
-
2026-06-08days on market $62,000 Active 33 DOM
-
2026-06-07days on market $62,000 Active 32 DOM
-
2026-06-03days on market $62,000 Active 28 DOM
-
2026-06-02days on market $62,000 Active 27 DOM
-
2026-06-01days on market $62,000 Active 26 DOM
-
2026-05-31days on market $62,000 Active 25 DOM
-
2026-05-30days on market $62,000 Active 24 DOM
-
2026-05-06$62,000 Active 227-char remark
ⓘ Source: listings_history table (triggers on properties + properties_extension) + one-shot
backfill from property_details.listing_events for pre-trigger history.
Tax reassessment forecast LA · Resets to sale price
- Current annual tax
- $963 · $80/mo
- Projected year-2 tax
- $963 · $80/mo
- Expected delta
- $0/yr ($0/mo · 0.0%)
ⓘ Screening estimate from a state-policy table — verify with the county assessor before closing.
Nearby sold comps map
Loading sold comps map…
Walkable amenities ~0.75 mi
Loading nearby amenities…
Taxation est. · year 1
- Rental income
- $12,831
- − Mortgage interest
- −$3,473
- − Property taxes
- −$963
- − Insurance
- −$310
- − Repairs & maintenance
- −$1,027
- − Management
- −$1,027
- − Depreciation
- −$1,804
- Taxable income
- $4,228
- Est. tax owed @ 24.0%
- −$1,015
- After-tax cash flow
- $3,947/yr
For passive investors: Depreciation is non-cash, so a rental often shows a tax loss while cash-flowing — sheltering income. Rental losses are passive: they offset passive income freely, and up to $25,000/yr can offset ordinary (W-2) income if you actively participate and your MAGI is under $100k (phasing out to $0 by $150k); unused losses carry forward. On sale, claimed depreciation is recaptured at up to 25%, and gains may owe capital-gains tax (a 1031 exchange can defer both). Figures are a year-1 estimate at your 24.0% rate — not tax advice; consult a CPA.
Schools (NCES district)
- District
- Vermilion Parish
- NCES district ID
- 2201800
- Math proficiency
- 40% ▼ -38.00%
- Reading proficiency
- 53% ▼ -32.00%
- Median HH income
- $45,115
- Composite
- 39.37/100
- National rank
- #3974
- State rank
- #15 of 98 in LA
Livability — Lake Arthur
- Score
- 68/100
- State rank
- #99
- US rank
- #9980
Category grades
Schools grade is shown separately in the Schools card above.
Census & demographics
- Population (ZIP)
- 3,499
Population outlook (Vermilion County) Hauer SSP2
- Today (2025)
- 64,095 people
- By 2030
- 65,915 · +2.8%
- By 2040
- 68,985 · +7.6%
- By 2050
- 70,804 · +10.5%
- By 2075
- 73,897 · +15.3%
- By 2100
- 71,793 · +12.0%
Race, ethnicity, and origin ACS 2023
- Neighborhood character
- Predominantly White (94%)
- Race & ethnicity
- White 94% Black 4% Two or more races 1%
- Common ancestry
- Lithuanian 22% Italian 1% Scotch-Irish 1%
- Languages at home
- 95% English-only · French/Haitian/Cajun 5%
Political lean MEDSL · Vermilion
- 2024 margin
- Solid R (+63.8) · D 17.6% · R 81.4% · Other 1.1%
- 2008→2024 swing
- -16.3pp toward R · 2008: -47.5pp · 2024: -63.8pp
- All cycles
- 2024: R+63.8 2020: R+61.9 2016: R+59.6 2012: R+52.8 2008: R+47.5
Not yet ingested
- Civics
- —
Market trends
- HPI YoY
- ▼ -50.70%
- Current HPI
- 99.2909
- Rent YoY
- —
- Metro
- —
- State GDP YoY
- ▲ 3.29%
- F500 in state
- 10
Industry mix (Fortune 500 HQ in LA)
| Industry | F500 HQs | Revenue |
|---|---|---|
| Telecommunications | 2 | $23B |
|
||
| Utilities | 1 | $12B |
|
||
| Wholesale / Distribution | 1 | $5B |
|
||
| Advertising | 1 | $2B |
|
||
Price history
1 event — show timeline
- 2026-05-06 Listed $62,000 AcadianaMLS
Property tax history
+1.4%/yrLatest (2025): $963 · -4.3% YoY. Source: county tax records.
Cash-flow waterfall
monthlySold comps — $/sqft
last 12 mo · ≤1 miLoading sold comps…